Health&WealthMOD: A microsimulation model of the economic impacts of diseases on older workers
- School of Public Health Faculty of Medicine, University of Sydney, Australia
- National Centre for Social and Economic Modelling, University of Canberra, Australia
Abstract
The Australian Government is seeking to encourage older workers to remain in the labour force longer to overcome future labour shortages and ensure adequate taxation revenue to fund the needs of an ageing population. Longer labour force participation also has benefits to individuals in terms of available income and capacity to save for a better standard of living in retirement. While the Government recognises that not all older workers are able to participate in the labour force, there is little information on what health conditions keep people from working, or what the costs are to the government or the individual. This case study outlines how a new microsimulation model, Health&WealthMOD, is being designed to fill this information gap by estimating the economic impacts of illness. The general approach adopted is outlined, following which two early applications of the model are presented. The model is used to explore the determinants of the duration spent in retirement and to generate projections of retirement due to illness to 2020.
1. Objective of the case study
The Australian Government is encouraging older workers to remain in the labour force longer to overcome future labour shortages and ensure adequate taxation revenue to fund the needs of an ageing population. In the past, high unemployment rather than labour shortages has meant that policy approaches to providing jobs rather than labour has been the priority for government Accordingly, these employment policies and priorities have been determined independently from health priorities. However, with emerging skills shortages, and an ageing workforce, a more holistic approach is required that considers the interaction between health and labour force priorities. In particular, it is important that the inter-relationships between health and employment are understood and measured.
In order to estimate the relationship between health and work, we are building Australia’s first microsimulation model, the Health&WealthMOD, of health and disability and their impacts on labour force participation, income, and government revenue and expenditure. This case study outlines the approach we are adopting, in the belief that the policy issues the model addresses, and the solutions proposed, are of wider interest.
2. Target audience
Health&WealthMOD will allow Government and others to determine the costs — both to the individual and to government — of ill health leading to early retirement, the number of individuals who might realistically be able to continue to work in older age and to estimate the potential personal and Government financial gains that would accrue with intervention that might treat or prevent particular conditions. These are currently major drivers of economic health policy in Australia.
3. Method and platform
3.1 Platform and language
Health&WealthMOD is designed to run in a windows PC environment and uses SAS as the main language for the model and related statistical analysis.
3.2 Components of Health&WealthMOD
There are three main components of Health&WealthMOD. They are the base population, STINMOD and the wealth models. Figure 1 shows the schematic diagram of Health&WealthMOD.
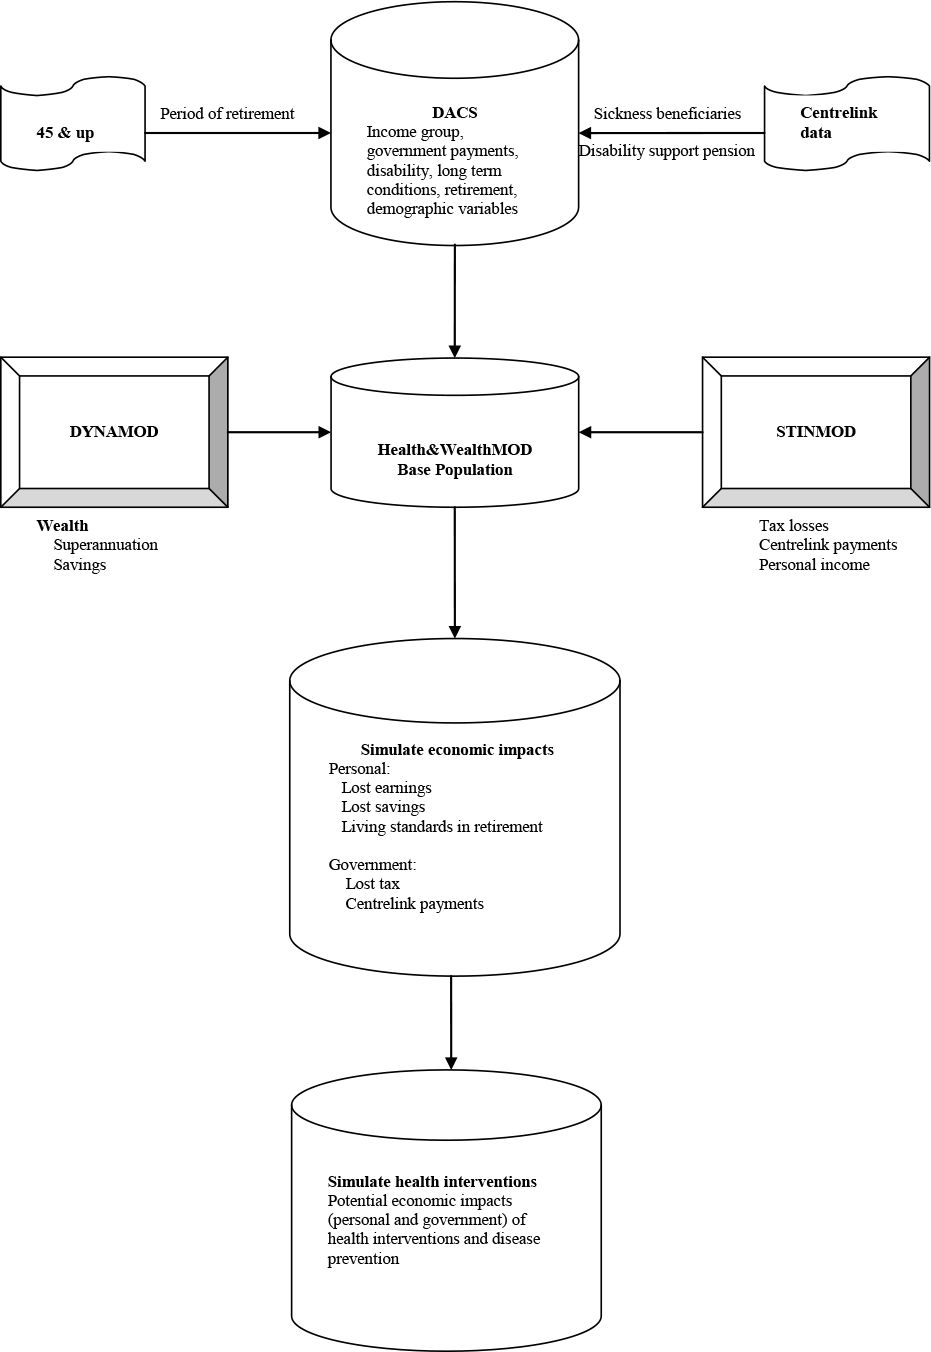

Health&WealthMOD.
Base population
The 45 to 64 years old population of the Disability, Ageing and Carers Survey 2003 (Australian Bureau of Statistics, 2005) forms the main base population. The survey collected demographic (eg. age, sex, family type, region and state of residence) and socio-economic information (level and field of education, income, benefits received) including information on labour force participation (labour force participation, employment restrictions, retirement). It also collected information on long term health conditions (long-term conditions, health status, type and extent of disability, support and care required).
While the survey provides an excellent basis as a starting point for the base population, it requires further work to obtain information on other variables such as retirement period, sickness benefit and etc, which are required for Health&WealthMOD. We need to impute estimates of these variables from other sources. The 45 and Up Study (The Sax Institute, 2006), a unique large scale survey of New South Wales residents aged 45 years and over, will be used to impute retirement period and Centrelink data on benefit type, age, sex and disability will be used to separately identify sickness beneficiaries.
STINMOD
STINMOD is Australia’s leading static microsimulation model (Lambert et al., 1994), which is now maintained and further developed for the Commonwealth by NATSEM and is routinely used by the Commonwealth departments for assessing distributional and revenue implications of tax and cash transfer reforms. The model operates at the ‘micro’ level of families and individuals, and uses ABS Income Distribution Survey unit record files as the base population (Percival, 1994).
The model simulates the impact of major federal government cash transfers, income tax and the Medicare levy on individuals and families in Australia. One benefit of STINMOD is that it has a projection facility, which allows its estimates of incomes, taxes and cash transfers to be provided either for a current period or for a period of up to four years ahead. STINMOD will be used in conjunction with Health&WealthMOD to identify exactly how much of each type of government cash transfer particular families should receive, given their demographic, family and earned income characteristics. It will also be used to identify the income tax payments that families should pay and the various tax rebates and deductions that they should receive.
Wealth model
There are a number of methods of projecting future personal wealth. The model developed by NATSEM – a dynamic microsimulation model (DYNAMOD) – is a complex, general-use tool that can answer a myriad of questions and dynamically handle changes to influences over time. This model looks at the circumstances of every individual, every month, and makes decisions based on their circumstances at that time. Within DYNAMOD, five assets: cash deposits, owner-occupied housing, equities, rental investment properties and superannuation are modelled to represent the wealth of Australian families. The workings of the model are outlined in Antcliff (1993) and the development of the wealth module is described in detail in Kelly (2003). The projection technique used to simulate the wealth variables in DYNAMOD will be adapted in Health&WealthMOD.
3.3 Building Health&WealthMOD
Modelling the costs of retirement due to ill health
The base population, STINMOD and the wealth models will be linked to develop Health&WealthMOD. The first step in doing this is to develop a satisfactory method for imputing data from STINMOD and the wealth models on to Health&WealthMOD. There are a range of options explored in more detail elsewhere (Schofield et al., 1996), however statistical imputation has the greatest advantages in capturing the relationship between important characteristics and imputation variables. So for example, to impute private income on to the Health&WealthMOD base population from STINMOD, a regression equation will be estimated using variables in common with Health&WealthMOD base population such as age, sex, marital status, family type, spouse characteristics and education. However, because income does not remain constant from age 45 to 65, income at each age will need to be imputed to capture the total loss from retirement to age 65. This process will be undertaken for each variable to be imputed including private and other income sources, income taxation, each Centrelink benefit type, wealth accumulated through superannuation and other asset classes and future superannuation and other income streams.
Having imputed all the necessary variables, we will be able to make current dollar estimates of the impact of illness. Based on the year that persons over the age of 45 retired due to illness, we could estimate total costs by multiplying each year of retirement by lost income and so on. However, this could lead to a significant overestimate as early retirement may also occur for reasons other than ill health and should thereby reduce the total period of retirement resulting from ill health. To take these reasons into account we will estimate the probability of retirement or unemployment for all persons other than those who have retired as a result of ill health by age and sex. This probability will be used to estimate the probability that each person who retired due to ill health would have subsequently retired for other reasons for each year from the reported retirement age to age 65.
The Health&WealthMOD will then simulate total losses for individuals and government because of early retirement due to illness.
Modelling the impact of reduced disease
To identify how reduced disease may reduce losses to individuals and government, several approaches will be tested. In preparing these modelling options, we will take account of guidance in the recent Productivity Commission report on medical technology (Productivity Commission, 2005) and the Pharmaceutical Benefits Advisory Committee guidelines (Department of Health and Ageing, 2005) which particularly discuss minimisation of overestimation.
Hypothetical approach
Using this approach, simple scenarios will be developed to estimate the impact of proportional reduction in disability. For example, the reduced losses if there were a 10, 20 and 30% reduction in disability from arthritis. While this is a relatively simple approach, it does provide more detail and realistic estimates than previous studies which have assumed a 100% reduction in disability and related labour force participation.
The broad health measure approach
This approach will be used to test the impact of reduction of particular illnesses for certain levels of disability. Using this approach, the likely impact of a reduction from a profound to a severe level of disability can be distinguished from the likely impact of a reduction from a moderate to a mild level of disability.
The clinical trial approach
This approach will use real data from the few available clinical studies which compare the impact on labour force participation of clinical interventions (Gerzeli et al., 2005; Puolakka et al., 2004; Wells et al., 2000). Data on increased labour force participation for those who did and those who did not receive the intervention will be used within the model to estimate the impact on personal and government costs of that particular intervention for a specific illness. Both health promotion interventions and early diagnosis and treatment will be modelled.
Health&WealthMOD will identify those conditions which have the greatest personal and government financial impact. They will be discussed in relation to disease trends and projections (Australian Institute of Health and Welfare, 2001) to identify conditions which are likely to create significant future personal and government financial risks and those where declines mean that risk may well be lower over the long term.
4. Applications of Health&WealthMOD
4.1 Determinants of retirement period
The base population of Health&WealthMOD was analysed to examine the variables associated with retirement period. This analysis has two implications: (a) it provides a basis for the selection of variables to match the records of Disability, Ageing and Carer Survey and 45 and Up Study datasets to impute the retirement period for those who retired for more than two years; and (b) it provides the evidence of which group of people likely to have a longer retirement period e.g. people with health conditions. This evidence will be used to guide policy makers about where to focus in order to reduce the duration of retirement.
In the Disability, Ageing and Carer Survey, the retirement period was categorised into five groups: under 4 weeks, 4 to 8 weeks, 8 to 13 weeks, 13 to 26 weeks, 26 to 52 weeks, 52 to 104 weeks, and 104 weeks and over (Australian Bureau of Statistics, 2005). The last category of retirement period (i.e. 104 weeks and over) had the highest number with 858 respondents. Compared to this group, the first six categories from “under 4 weeks” to “52 to 104 weeks” had a very small numbers, ranging from 4 to 73 respondents. In addition, the multinomial logistic regression analysis for the retirement period showed no significant association between any of the variables analysed and the retirement period of these categories, which may be due to a fewer number of respondents in these categories. Accordingly, the first six categories of retirement period from “under 4 weeks” to “52 to 104 weeks” were merged. As a result, there were only two categories of retirement period left: under 104 weeks, and 104 weeks and over. Logistic regression analysis was further undertaken to identify the variables that were associated with retirement period. The data were weighted by the ABS to address the issue of unequal probability of selection of respondents in the survey. Our analysis adjusted for unequal weighting for individuals in the survey.
Age group, sex, educational qualification, health assessment were significantly associated with retirement period (Table 1). The likelihood of having a longer retirement period of “104 weeks and over” increased with increase in age. The association of retirement period with marital status was marginally significant (p-value = 0.07) with married persons less likely to have the retirement period of “104 weeks and over” than the others, which included separated, divorced, widowed and never married. Females and people with no university qualification were more likely to have a longer retirement period of “104 weeks and over” than males and people with a university qualification respectively. People who assessed their health status as poor (fair, poor) were at greater risks of having a long retirement period than the individuals who thought they had better health (excellent, very good and good). Results of the Hosmer and Lemeshow goodness of fit test did not provide any evidence of a lack of fit in the model (Hosmer & Lemeshow, 2000).
Association of retirement period with its predictors: odds ratios of having retirement period of “104 weeks and over”.
| Variables | Odds ratios (95% CI) |
| Age group | |
| (Ref. 45 – 49 yrs) | 1.29 (0.77–2.14) |
| 50 – 54 | 1.52 (0.94 – 2.47) |
| 55 – 59 | 2.22 (1.37 – 3.60) |
| 60 – 64 | |
| Sex | 1.76 (1.27 – 2.46) |
| (Ref. Male) | |
| Female | |
| Marital status | 1.38 (0.97 – 1.96) |
| (Ref. Married): | |
| Others | |
| Educational qualification | 1.66 (1.10 – 2.49) |
| (Ref. University) | |
| No university | |
| Health assessment | 1.57 (1.12 – 2.19) |
| (Ref. Excellent-Good) | |
| Fair, Poor |
These results suggest that policies that focus on providing greater access to university level education and improving health status of older workers may be useful strategies which may in themselves reduce premature retirement, and may also result in more Australians being in a position to benefit from recent economic incentives (such as an abolition of taxes on pensions from superannuation – retirement savings – pensions) to delay retirement.
4.2 Projection retirement due to illness
Another early policy application of Health&WealthMOD has been to project the number of people out of the labour force due to chronic conditions, taking account of population growth, ageing and disease trends. The attributable risk of being out of the labour force associated with long term health conditions was estimated for each condition (Schofield et al., 2008). Analysis of the Health&WealthMOD base population was then undertaken, supplemented by this risk information and ABS population projections. In order to distinguish between the effects of conditions that primarily impact on the oldest workers (such as heart disease), and those which have a high prevalence amongst younger workers with generally high employment rates (such as mental illness), it was assumed that without the long term condition person might have achieved the labour force participation of their 5-year age and sex cohort.
The details of the methods and findings from this study are reported in Schofield et al. (2007). In summary, it was projected that ageing of the population and trends in disease prevalence would lead to a rise of approximately 609,000 people out of the labour force due to chronic illness by 2020. This represents a near doubling of the number of people and an increase of 50% in the proportion of people not employed due to ill health. While ageing was expected to produce a net increase of around 205,500 non labour force participants, trends in chronic illness were anticipated to have a considerably greater effect. As a result the model was found to be more sensitive to alterations in health trends than to those for demographic assumptions.
5. Future model development
Health&WealthMOD continues to be further developed and future stages will include modelling lost savings due to illness and their impact on living standards, and simulation of the impacts of health interventions on labour force participation and their potential economic impacts.
References
- 1
-
2
Information Paper - Basic Confidentialised Unit Record File: Survey of Disability, Ageing and Carers 2003 (reissue)Canberra: Australian Bureau of Statistics.
- 3
-
4
http://www.health.gov.au/internet/main/pub lishing.nsf/content/health-pbs-general-pubs- guidelines-content.htm2002 Guidelines for the Pharmaceutical Industry. Accessed August 20, 2007.
-
5
The economic burden of stroke in Italy. The EcLIPSE Study: Economic Longitudinal Incidence-based Project for Stroke EvaluationNeurol Sci 26:72–80.
- 6
-
7
Estimating the Wealth of Australians: A new approach using microsimulationunpublished PhD thesis, University of Canberra.
- 8
- 9
-
10
Impacts of Advances in Medical Technology in AusraliaCanberra: Productivity Commisssion.
-
11
Impact of initial aggressive drug treatment with a combination of disease-modifying antirheumatic drugs on the development of work disability in early rheumatoid arthritis: a five-year randomized followup trialArthritis Rheum 50:55–62.
-
12
A Comparison of Data Merging Methodologies for Extending a Microsimulation ModelCanberra: NATSEM.
-
13
Health&WeatlhMOD - Forecasting the economic impacts of retirement due to illnessPaper presented at the 1st General Conference of the International Microsimulation Association.
-
14
Chronic disease and labour force participation among older AustraliansMed J Aust 189:447–50.
- 15
-
16
Impact of disseminating quality improvement programs for depression in managed primary care: a randomized controlled trialJama 283:212–20.
Article and author information
Author details
Publication history
- Version of Record published: December 31, 2009 (version 1)
Copyright
© 2009, Schofield et al.
This article is distributed under the terms of the Creative Commons Attribution License, which permits unrestricted use and redistribution provided that the original author and source are credited.