Health&WealthMOD: A microsimulation model of the economic impacts of diseases on older workers
Deborah Schofield, Megan Passey, Arul Earnest, Richard Percival, Simon Kelly, Rupendra Shrestha, Susan Fletcher
Northern Rivers University Department of Rural Health, School of Public Health Faculty of Medicine, University of Sydney, Lismore, NSW, Australia; National Centre for Social and Economic Modelling, University of Canberra, Australia
Cite as: D. Schofield, M. Passey, A. Earnest, R. Percival, S. Kelly, R. Shrestha, S. Fletcher; 2009; Health&WealthMOD: A microsimulation model of the economic impacts of diseases on older workers; International Journal of Microsimulation; 2(2); 58–63. doi: 10.34196/ijm.00018
Abstract
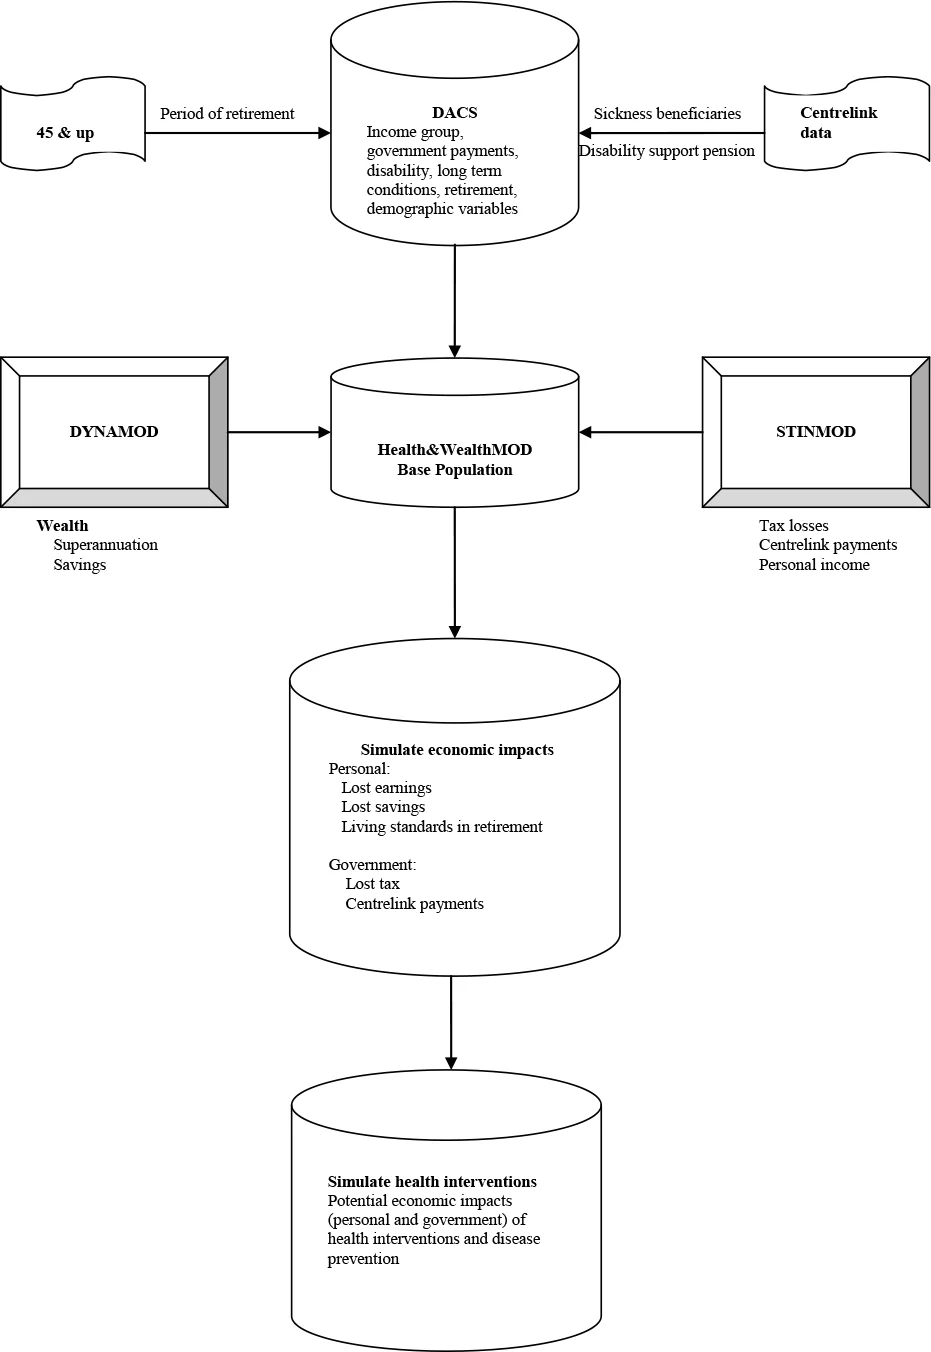
The Australian Government is seeking to encourage older workers to remain in the labour force longer to overcome future labour shortages and ensure adequate taxation revenue to fund the needs of an ageing population. Longer labour force participation also has benefits to individuals in terms of available income and capacity to save for a better standard of living in retirement. While the Government recognises that not all older workers are able to participate in the labour force, there is little information on what health conditions keep people from working, or what the costs are to the government or the individual. This case study outlines how a new microsimulation model, Health&WealthMOD, is being designed to fill this information gap by estimating the economic impacts of illness. The general approach adopted is outlined, following which two early applications of the model are presented. The model is used to explore the determinants of the duration spent in retirement and to generate projections of retirement due to illness to 2020.
This article contains 1 figure and 1 table.
Figures
Figure 1. Health&WealthMOD.
Tables
Table 1. Association of retirement period with its predictors: odds ratios of having retirement period of “104 weeks and over”.