Integrated computable general equilibrium (cge) micro-simulation approach
- Poverty and Economic Policy (PEP) research network and Université Laval, Canada
- Centre of Policy Studies Monash University, Australia
- Global Issues Initiative, Virginia Polytechnic University, United States
- Article
- Figures and data
- Jump to
Figures

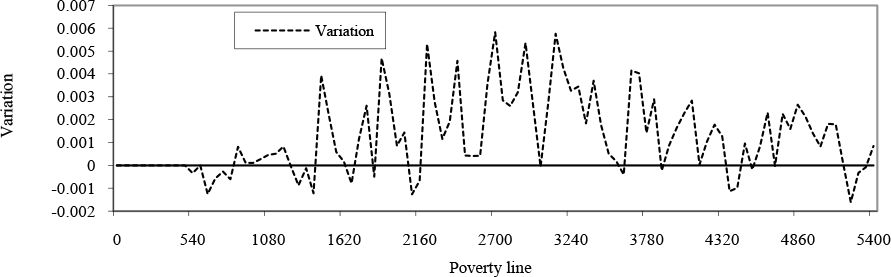
Variation in headcount ratio curves, Nepal (All regions).
Note: This figure represents the variation in the headcount ratio resulting from trade liberalisation for a whole range of poverty line.

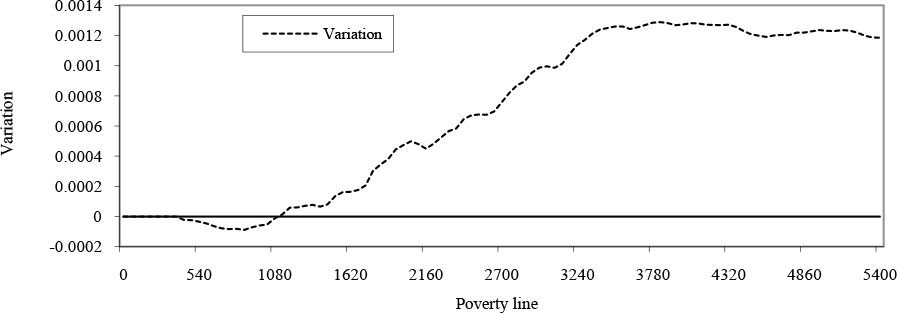
Variation in poverty gap curves, Nepal (All regions).
Notes: This figure represents the variation in the poverty gap resulting from trade liberalisation for a whole range of poverty lines.
Tables
Effects of trade liberalization on sectors, Philippines (% change).
| Price | Volume | |||||||||
|---|---|---|---|---|---|---|---|---|---|---|
| SECTORS | PM | PQ | PD | PL | PX | M | EX | D | Q | XS |
| Irrigated Paddy | −31.0 | −5.0 | −5.0 | −8.2 | −8.2 | 395.0 | − | −1.8 | −1.8 | −1.8 |
| Non irrigated Paddy | − | −5.8 | −5.8 | −9.0 | −9.0 | − | − | −1.6 | −1.6 | −1.6 |
| Corn | −33.9 | −7.0 | −5.3 | −8.4 | −8.4 | 53.2 | 7.6 | −4.1 | −1.7 | −4.0 |
| Banana | − | −6.3 | −6.3 | −9.4 | −3.9 | − | 22.7 | 2.2 | 2.2 | 14.0 |
| Fruits | −39.6 | −7.8 | −4.7 | −7.9 | −6.9 | 126.3 | 13.5 | −2.5 | 3.6 | −0.5 |
| Coconut | − | −4.3 | −4.3 | −7.5 | −6.7 | − | 18.8 | 2.9 | 2.9 | 4.5 |
| Sugarcane | − | −6.9 | −6.9 | −10.0 | −10.0 | − | − | −7.2 | −7.2 | −7.2 |
| Other agricultural crops | −16.3 | −4.5 | −4.3 | −7.5 | −6.9 | 51.7 | 26.2 | −1.8 | −1.1 | −0.1 |
| Hog | −32.8 | −7.4 | −5.5 | −8.6 | −8.6 | 88.9 | − | −4.6 | −0.5 | −4.6 |
| Chicken, eggs & poultry products | −12.0 | −4.2 | −4.1 | −7.3 | −7.3 | 17.0 | 14.7 | −1.5 | −1.4 | −1.5 |
| Other livestock | −24.1 | −5.4 | −5.3 | −8.4 | −8.4 | 38.6 | 12.9 | −1.3 | −1.1 | −1.3 |
| Fishing | −9.8 | −2.4 | −2.4 | −5.7 | −4.5 | 10.5 | 7.8 | 0.2 | 0.2 | 1.8 |
| Other Agriculture | 3.5 | −3.2 | −3.5 | −6.7 | −6.7 | −20.7 | − | 0.2 | −0.6 | 0.2 |
| AGRICULTURE | −25.7 | −5.0 | −4.4 | −7.6 | −7.0 | 66.2 | 13.9 | −1.7 | −0.6 | −0.5 |
| Mining | −6.8 | −5.9 | −3.0 | −6.3 | −3.3 | 6.6 | 24.4 | −17.4 | 0.3 | 0.9 |
| Meat Processing | −34.3 | −8.6 | −6.3 | −9.4 | −9.4 | 314.6 | 42.4 | −5.8 | 4.7 | −5.5 |
| Canning/preserving of fruits & veg. | −26.0 | −4.9 | −3.5 | −6.8 | −4.7 | 66.7 | 12.9 | −1.8 | 1.1 | 2.5 |
| Fish canning and processing | −29.5 | −1.2 | −0.6 | −3.9 | −2.3 | 330.9 | 13.5 | −4.8 | −2.1 | 2.5 |
| Coconut processing | −29.6 | −12.5 | −7.0 | −10.1 | −3.6 | 58.8 | 12.5 | −9.0 | 2.9 | 4.6 |
| Rice and corn milling | −31.0 | −3.6 | −2.9 | −6.2 | −6.2 | 139.1 | 16.0 | −1.7 | 0.0 | −1.7 |
| Sugar milling and refining | −40.4 | −10.4 | −5.5 | −8.7 | −7.8 | 211.3 | 15.0 | −10.0 | 3.9 | −7.7 |
| Beverages, Sugar, Confectionery | −15.5 | −3.7 | −3.1 | −6.3 | −6.1 | 20.5 | 8.8 | −0.8 | 0.0 | −0.5 |
| Other food manufacturing | −16.6 | −6.5 | −3.8 | −7.0 | −6.6 | 33.9 | 13.3 | −5.0 | 1.7 | −3.9 |
| Textile and garments | −23.5 | −16.5 | −9.5 | −12.6 | −5.8 | 52.7 | 34.8 | −19.0 | 10.0 | 7.4 |
| Wood and paper products | −16.5 | −11.0 | −6.9 | −10.0 | −6.9 | 24.7 | 23.1 | −11.7 | 1.8 | −1.8 |
| Fertilizer | 3.0 | 2.5 | 1.7 | −1.7 | −1.0 | −1.7 | 8.4 | 2.4 | −0.3 | 5.0 |
| Other chemicals | −11.0 | −8.5 | −6.2 | −9.3 | −8.0 | 11.2 | 28.9 | −6.6 | 1.7 | −2.2 |
| Petroleum related products | −1.5 | −1.5 | −1.5 | −4.8 | −4.5 | −0.6 | 10.1 | −0.7 | −0.7 | 0.0 |
| Metal and related products | −11.3 | −8.7 | −5.0 | −8.1 | −4.2 | 13.8 | 20.6 | −11.4 | 2.5 | 3.0 |
| Semi-conductors & other electronic | −8.9 | −7.4 | −3.4 | −6.7 | −1.8 | 13.3 | 19.0 | −12.1 | 5.7 | 10.1 |
| Motor vehicles & other machineries | −7.6 | −6.9 | −4.8 | −7.9 | −4.9 | 5.3 | 27.7 | −6.0 | 2.1 | 6.0 |
| Other manufacturing | −26.1 | −18.7 | −11.0 | −14.0 | −9.0 | 46.5 | 30.3 | −22.2 | 5.8 | −5.6 |
| Construction and utilities | 0.0 | −3.2 | −3.2 | −6.4 | −6.3 | − | 14.5 | −1.9 | −1.9 | −1.7 |
| INDUSTRY | −11.6 | −7.3 | −4.6 | −7.8 | −5.9 | 18.5 | 23.5 | −6.3 | 1.9 | 0.2 |
| Wholesale trade | − | −0.4 | −0.4 | −3.7 | −2.9 | − | 5.9 | −1.5 | −1.5 | 0.1 |
| Other service | − | −0.2 | −0.2 | −3.6 | −3.0 | − | 6.4 | −0.7 | −0.7 | 0.4 |
| Government services | − | − | − | − | −3.8 | − | − | − | − | − |
| SERVICES | − | −0.3 | −0.3 | −3.6 | −3.0 | − | 6.2 | −1.0 | 0.3 | 0.3 |
-
Key: PM = import prices; PQ = composite consumer prices; PD = prices of local goods sold on the domestic market (with tax); PL = prices of local goods sold on the domestic market (without tax); PX = composite (export-domestic) producer prices; M = imports; EX = exports; D = domestic sales; Q = composite commodity; XS = total output; “-”- zero at the base.
Effects of trade liberalization on factors, Philippines (% change).
| Value Added | Labour Demand | ||||||
|---|---|---|---|---|---|---|---|
| SECTORS | VA | PVA | R | Total Labour | Agriculture | Un-skilled Non-Agriculture | Skilled Non-Agriculture |
| Irrigated Paddy | −1.8 | −10.2 | −11.8 | −3.5 | −3.3 | −8.2 | −9.0 |
| Non irrigated Paddy | −1.6 | −9.5 | −10.9 | −2.5 | −2.3 | −7.2 | −8.1 |
| Corn | −4.0 | −9.8 | −13.4 | −5.8 | −5.0 | −9.8 | −10.7 |
| Banana | 14.0 | −4.4 | 8.9 | 18.3 | 19.4 | 13.4 | 12.4 |
| Fruits | −0.5 | −8.3 | −8.7 | −0.9 | 0.1 | −4.9 | −5.8 |
| Coconut | 4.5 | −7.5 | −3.3 | 5.2 | 6.0 | 0.7 | −0.3 |
| Sugarcane | −7.2 | −13.5 | −19.8 | −12.3 | −12.0 | −16.4 | −17.2 |
| Other agricultural crops | −0.1 | −8.2 | −8.2 | −0.3 | 0.6 | −4.4 | −5.3 |
| Hog | −4.6 | −11.4 | −15.4 | −8.4 | −7.3 | −11.9 | −12.8 |
| Chicken, egg & poultry products | −1.5 | −9.2 | −10.6 | −3.0 | −1.9 | −6.9 | −7.7 |
| Other livestock | −1.3 | −10.1 | −11.2 | −3.7 | −2.6 | −7.5 | −8.4 |
| Fishing | 1.8 | −4.7 | −3.0 | 5.0 | 6.4 | 1.0 | 0.1 |
| Other Agriculture | 0.2 | −7.8 | −7.6 | 0.2 | 1.3 | −3.8 | −4.7 |
| AGRICULTURE | −0.4 | −8.4 | −8.5 | −0.8 | 0.0 | −4.4 | −5.1 |
| Mining | 0.9 | −2.5 | −1.6 | 2.0 | − | 2.5 | 1.6 |
| Meat Processing | −5.5 | −18.7 | −23.2 | −20.4 | − | −20.0 | −20.7 |
| Canning/preserving of fruits & veg. | 2.5 | −0.6 | 1.9 | 5.7 | − | 6.1 | 5.2 |
| Fish canning and processing | 2.5 | −0.2 | 2.3 | 6.1 | − | 6.5 | 5.5 |
| Coconut processing | 4.6 | 1.7 | 6.3 | 10.1 | − | 10.7 | 9.7 |
| Rice and corn milling | −1.7 | −8.8 | −10.4 | −7.1 | − | −6.7 | −7.5 |
| Sugar milling and refining | −7.7 | −11.8 | −18.6 | −15.6 | − | −15.2 | −16.0 |
| Beverages, Sugar, Confectionery | −0.5 | −4.3 | −4.8 | −1.3 | − | −0.9 | −1.8 |
| Other food manufacturing | −3.9 | −7.9 | −11.5 | −8.3 | − | −7.8 | −8.7 |
| Textile and garments | 7.4 | 6.8 | 14.7 | 18.8 | − | 19.4 | 18.3 |
| Wood, and paper products | −1.8 | −6.2 | −7.8 | −4.5 | − | −4.0 | −4.9 |
| Fertilizer | 5.0 | 8.9 | 14.4 | 18.5 | − | 19.1 | 18.0 |
| Other chemicals | −2.2 | −9.2 | −11.2 | −7.9 | − | −7.6 | −8.4 |
| Petroleum related products | 0.0 | −3.7 | −3.7 | −0.1 | − | 0.3 | −0.7 |
| Metal and related products | 3.0 | 3.3 | 6.4 | 10.3 | − | 10.8 | 9.8 |
| Semi-conductors & other electronic | 10.1 | 13.9 | 25.4 | 29.9 | − | 30.5 | 29.3 |
| Motor vehicles and other machineries | 6.0 | 4.6 | 10.9 | 14.9 | − | 15.5 | 14.4 |
| Other manufacturing | −5.6 | −9.5 | −14.5 | −11.4 | − | −11.0 | −11.8 |
| Construction and utilities | −1.7 | −6.3 | −8.0 | −4.5 | − | −4.2 | −5.0 |
| INDUSTRY | −0.2 | −4.3 | −4.5 | −0.3 | 0.0 | −0.2 | 0.02 |
| Wholesale trade | 0.1 | −3.7 | −3.6 | 0.2 | − | 0.4 | −0.5 |
| Other service | 0.4 | −2.4 | −2.0 | 1.4 | − | 2.0 | 1.1 |
| Government services | 0.0 | −4.0 | 0.0 | 0.0 | − | − | − |
| SERVICES | 0.3 | −2.8 | −2.5 | 0.9 | 0.0 | 1.0 | 1.0 |
| TOTAL | −0.1 | −4.5 | −4.1 | ||||
| Change in average wage, % --> | −4.7 | −8.8 | −4.0 | −3.1 | |||
-
Key: VA = value added; PVA = value added prices; R = rate of return to capital; “-”– zero at the base.
-
Notes: The changes in labour demand volume for skilled and unskilled agricultural labour in the agricultural sectors are the same. This is because in the SAM, all agricultural sectors have the same share of skilled and unskilled agricultural labour (18 and 82 percent share in total agriculture labour respectively) in production—owing to absence of data to break detailed agriculture labour across agricultural sub-sectors. Nonetheless, this does not significantly affect the computational results of the model.
Effects of trade liberalization on household income, Philippines (% change).
| Female | Male | |||||||
|---|---|---|---|---|---|---|---|---|
| Factors | Household categories | All | All | Low Educated | High Educated | All | Low Educated | High Educated |
| Agriculture Skilled | −0.2 | −0.1 | − | −0.1 | −0.2 | − | −0.4 | |
| Agriculture Unskilled | −0.6 | −0.3 | −0.7 | − | −0.7 | −1.5 | − | |
| Non-agriculture Skilled | −0.9 | −0.7 | − | −1.3 | −0.9 | − | −1.7 | |
| Non-agriculture Unskilled | −0.4 | −0.5 | −1.0 | − | −0.4 | −0.9 | − | |
| Labour | Total Labour | −2.1 | −1.5 | −1.7 | −1.4 | −2.2 | −2.4 | −2.1 |
| Agriculture | −0.7 | −0.4 | −0.7 | −0.2 | −0.8 | −1.3 | −0.3 | |
| Industry | −0.1 | −0.1 | −0.1 | 0.0 | −0.1 | −0.1 | −0.1 | |
| Services | −0.6 | −0.6 | −0.6 | −0.6 | −0.6 | −0.5 | −0.7 | |
| Land | −0.2 | −0.1 | −0.1 | 0.0 | −0.2 | −0.3 | −0.1 | |
| Capital | Total Capital | −1.6 | −1.2 | −1.5 | −0.9 | −1.6 | −2.1 | −1.2 |
| Other | Dividends | − | − | − | − | − | − | − |
| Income | Others | − | − | − | − | − | − | − |
| Total | −3.7 | −2.7 | −3.2 | −2.2 | −3.9 | −4.5 | −3.3 | |
-
Notes: (a) “-” in labour income block indicates the absence of household income from the corresponding labour type. For instance, low (high) educated male and female have no labour income from skilled (unskilled) agriculture labour and skilled (unskilled) non-agriculture labour. (b) “-” in the Other income block is due to the assumption that non-factor income (i.e., dividends, government transfers and remittances) are held fixed to prevent any possible welfare/poverty effects of variations from these income sources; (c) “Total” shows over-all variation in income. This is calculated as the sum of contribution of each income source to the total variation in income.
Effects of trade liberalization on income and prices, Philippines (% change).
| All | All Female | Low Educated Female | High Educated Female | All Male | Low Educated Male | High Educated Male | |
|---|---|---|---|---|---|---|---|
| Income | |||||||
| All Philippines | −3.7 | −2.7 | −3.2 | −2.2 | −3.9 | −4.5 | −3.3 |
| NCR | −2.7 | −2.3 | −2.4 | −2.3 | −2.8 | −2.5 | −2.9 |
| Urban except NCR | −3.3 | −2.4 | −2.8 | −2.1 | −3.4 | −3.8 | −3.2 |
| Rural | −4.9 | −3.7 | −4.1 | −2.6 | −5.1 | −5.5 | −4.2 |
| Consumer price index per household category | |||||||
| All Philippines | −4.2 | −3.7 | −3.9 | −3.3 | −4.2 | −4.1 | −4 |
| NCR | −3.6 | −3.3 | −3.5 | −2.5 | −3.7 | −3.3 | −3.5 |
| Urban except NCR | −4.2 | −3.8 | −3.9 | −3.5 | −4.3 | −4.5 | −4 |
| Rural | −4.4 | −4.1 | −4.2 | −3.7 | −4.5 | −4.5 | −4.4 |
-
Notes: (a) Consumer price index per household category is the same as the Weighted Price of Household Specific Consumer Basket; (b) NCR stands for National Capital Region, otherwise known as Metro Manila, which is the capital of the Philippines.
Effects of trade liberalization on poverty, Philippines (% change).
| FGT Poverty Index | All | All Female | Low Educated Female | High Educated Female | All Male | Low Educated Male | High Educated Male |
|---|---|---|---|---|---|---|---|
| All Philippines | |||||||
| Headcount | −0.2 | −2.9 | −2.5 | −5.9 | 0.0 | 0.1 | −0.6 |
| Gap | 0.8 | −1.3 | −1 | −4.3 | 0.9 | 1.1 | 0 |
| Severity | 1.2 | −1.2 | −0.9 | −3.5 | 1.4 | 1.6 | 0.3 |
| National Capital Region (NCR) | |||||||
| Headcount | −1.6 | −6.3 | −5.1 | −9.1 | −1 | −2.6 | 0.8 |
| Gap | −2.5 | −3.5 | −3.4 | −4.5 | −2.4 | −2.8 | −2 |
| Severity | −3.2 | −4.2 | −4.4 | −4.8 | −2.9 | −3.5 | −2 |
| All Urban Households (except NCR) | |||||||
| Headcount | −0.7 | −3.1 | −2.7 | −5.7 | −0.5 | −0.1 | −1.7 |
| Gap | 0.2 | −2.5 | −2.1 | −5.7 | 0.4 | 0.6 | −0.7 |
| Severity | 0.7 | −2.3 | −2 | −5.8 | 0.9 | 1.2 | −0.3 |
| All Rural Households | |||||||
| Headcount | 0.0 | −2.6 | −2.3 | −5.3 | 0.2 | 0.3 | −0.03 |
| Gap | 1.1 | −0.8 | −0.6 | −3.6 | 1.2 | 1.3 | 0.6 |
| Severity | 1.5 | −0.7 | −0.5 | −2.7 | 1.7 | 1.8 | 0.8 |
-
Notes: Poverty headcount – Proportion of the population that falls below the poverty line; Poverty gap – Indicates how far on the average the poor are from the poverty line; Poverty-severity – Squared average distance of income of the poor from the poverty line.
Effects of trade liberalization on sectoral production, Nepal (% change).
| Tariff rate | Import volumes | Exports and Production | Value Added | |||||||||
|---|---|---|---|---|---|---|---|---|---|---|---|---|
| TM | M | M/Q | D | PD | EX | EX/XS | XS | PX | Urban | Terai | Hills | |
| AGRICULTURE | ||||||||||||
| Paddy | 13.5 | 52.4 | 0.2 | −0.8 | −4.0 | 21.6 | 0.1 | −0.7 | −4.0 | −0.7 | −0.5 | −1.4 |
| Other food crops | 12.2 | 43.4 | 0.6 | −0.8 | −4.0 | 21.9 | 0.2 | −0.8 | −4.0 | 0.8 | 0.4 | −1.7 |
| Cash crops | 7.0 | 11.7 | 3.5 | −0.7 | −4.3 | 23.8 | 2.0 | −0.2 | −4.2 | −1.3 | −0.8 | 0.4 |
| Livestock/fisheries | 4.4 | −1.5 | 1.2 | −0.9 | −4.4 | 24.0 | 1.9 | −0.4 | −4.3 | −1.0 | −0.9 | 0.0 |
| Forestry | 0.8 | −4.2 | 25.1 | 0.1 | 0.9 | −4.2 | −0.5 | 0.6 | 1.6 | |||
| NON-AGRICULTURE | ||||||||||||
| Mining | 12.3 | 39.8 | 8.6 | −10.4 | −2.6 | −10.4 | −2.6 | −12.2 | −11.8 | −9.8 | ||
| Manufacturing | 8.1 | 15.8 | 47.0 | −8.1 | −3.1 | 7.8 | 16.8 | −5.4 | −2.6 | −6.0 | −5.4 | −3.5 |
| Construction | −0.9 | −2.4 | −0.9 | −2.4 | −1.2 | −0.7 | −0.6 | |||||
| Gas, electricity, water | 10.9 | 47.7 | 2.4 | −2.3 | −2.0 | −2.3 | −2.0 | −2.4 | −1.9 | −1.9 | ||
| Hotel and restaurant | 1.6 | −2.4 | 14.9 | 55.9 | 9.1 | −1.0 | 9.2 | 10.1 | 6.6 | |||
| Transport/communication | 6.0 | 13.8 | 13.3 | −1.4 | −2.9 | 14.4 | 30.5 | 3.5 | −2.0 | 3.4 | 4.0 | 3.0 |
| Trade | 3.4 | 2.2 | 6.8 | 1.5 | −3.1 | 18.9 | 20.9 | 5.2 | −2.4 | 3.2 | 6.4 | 10.0 |
| Banking and real estate | 0.9 | −2.1 | 0.9 | −2.1 | 0.5 | 1.6 | 0.5 | |||||
| Government services | −0.1 | −2.5 | −0.1 | −2.5 | −0.1 | −0.3 | 0.3 | |||||
| Other services | −0.1 | −2.2 | 11.6 | 0.8 | 0.0 | −2.2 | 1.6 | 0.2 | −2.7 | |||
-
Key: TM = initial tariff rate; δ = variation; M = Imports; Q = domestic consumption; M/Q = import penetration rate; D = Local sales of domestic output; PD = Price of local sales of domestic output; EX = exports; XS = domestic output; EX/XS = export intensity ratio; PX = Producer price of composite domestic output; VA = value added.
-
Notes: Changes in value added and Output are equal.
Effects of trade liberalisation on factor remuneration, Nepal (% change).
| Wage Rate | Returns to: | |||||
|---|---|---|---|---|---|---|
| Unskilled | Skilled | Capital in Agriculture | Capital in Non-agriculture | Land | Other income | |
| Urban | −2.9 | −2.3 | −5.4 | −1.7 | −5.4 | 0.02 |
| Terai | −4.1 | −2.3 | −5.1 | −0.6 | −5.1 | 0.02 |
| Hills and Mountains | −4.3 | −2.3 | −4.4 | −0.8 | −4.4 | 0.02 |
Sources of household income by region, Nepal.
| Income shares (%) | Change in factor Remuneration rates (%) | Income changes (%) | |||||||
|---|---|---|---|---|---|---|---|---|---|
| Urban | Terai | Hills | Urban | Terai | Hills | Urban | Terai | Hills | |
| WAGES | |||||||||
| Unskilled | 24.5 | 33.8 | 36.1 | −2.9 | −4.1 | −4.3 | −0.7 | −1.4 | −1.6 |
| Skilled | 22.0 | 10.4 | 9.2 | −2.3 | −2.3 | −2.3 | −0.5 | −0.2 | −0.2 |
| RETURNS TO: | |||||||||
| Agricultural Capital | 0.4 | 1.9 | 1.8 | −5.4 | −5.1 | −4.4 | 0.0 | −0.1 | −0.1 |
| Non-agricultural Capital | 32.5 | 18.8 | 11.6 | −1.7 | −0.6 | −0.8 | −0.6 | −0.1 | −0.1 |
| Land | 3.2 | 30.5 | 34.1 | −5.4 | −5.1 | −4.4 | −0.3 | −1.6 | −1.5 |
| OTHER INCOME | 14.3 | 4.7 | 7.1 | 0.0 | 0.0 | 0.0 | 0.3 | 0.1 | 0.1 |
| TOTAL | 100.0 | 100.0 | 100.0 | −1.8 | −3.3 | −3.3 | |||
Effects of trade liberalization on consumer prices, Nepal (% change).
| PM | PD | M/Q | PC | Urban | Terai | Hills / Mountains | |
|---|---|---|---|---|---|---|---|
| AGRICULTURE | 65.0 | 79.2 | 79.0 | ||||
| Paddy | −11.9 | −4.0 | 0.2 | −3.0 | 14.1 | 32.1 | 18.2 |
| Other food crops | −10.9 | −4.0 | 0.6 | −3.1 | 5.9 | 13.5 | 18.1 |
| Cash crops | −6.5 | −4.3 | 3.5 | −3.4 | 24.1 | 24.2 | 28.8 |
| Livestock/fisheries | −4.2 | −4.4 | 1.2 | −3.4 | 4.4 | 4.0 | 5.0 |
| Forestry | −4.2 | −4.2 | 1.2 | −3.2 | 16.5 | 5.4 | 8.8 |
| Mining | −10.9 | −2.6 | 8.6 | −2.5 | 0.0 | 0.0 | 0.0 |
| NON-AGRICULTURE | 35.0 | 20.8 | 21.0 | ||||
| Manufacturing | −7.5 | −3.1 | 47.0 | −3.7 | 19.5 | 13.2 | 15.1 |
| Construction | 0.0 | −2.4 | 0.0 | −1.4 | 0.0 | 0.0 | 0.0 |
| Gas, electricity, water | −9.8 | −2.0 | 2.4 | −1.2 | 0.5 | 0.1 | 0.0 |
| Hotel and restaurant | 0.0 | −2.4 | 0.0 | −1.4 | 0.3 | 0.1 | 0.1 |
| Transport/communication | −5.7 | −2.9 | 13.3 | −2.2 | 2.9 | 1.1 | 1.1 |
| Trade | −3.2 | −3.1 | 6.8 | −2.1 | 0.0 | 0.0 | 0.0 |
| Banking and real estate | 0.0 | −2.1 | 0.0 | −1.1 | 0.2 | 0.5 | 0.1 |
| Government services | 0.0 | −2.5 | 0.0 | −1.4 | 10.0 | 5.0 | 4.0 |
| Other services | 0.0 | −2.2 | 0.0 | −1.1 | 1.6 | 0.8 | 0.6 |
| Total | 100 | 100 | 100 | ||||
| Consumer price indices | −3.1 | −3.1 | −3.2 |
-
Key: PM = Price of imports; PD = Price of local sales of domestic output; M/Q = import penetration rate; PC = Consumer prices