Economic growth and income distribution: linking macro- economic models with household survey data at the global level
- Latin America and Caribbean Economic Policy, The World Bank, United States
- Subsecretaría de Educación Media Superior, D.F.
Cite this article
as: M. Bussolo, R. E. De Hoyos, D. Medvedev; 2010; Economic growth and income distribution: linking macro- economic models with household survey data at the global level; International Journal of Microsimulation; 3(1); 92-103.
doi: 10.34196/ijm.00027
- Article
- Figures and data
- Jump to
Figures
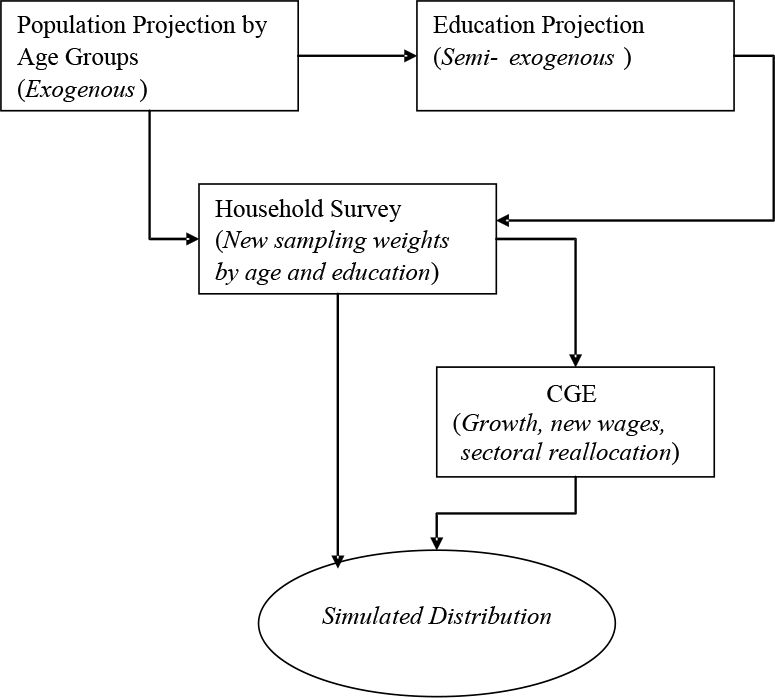
Figure 1

GIDD methodological framework.
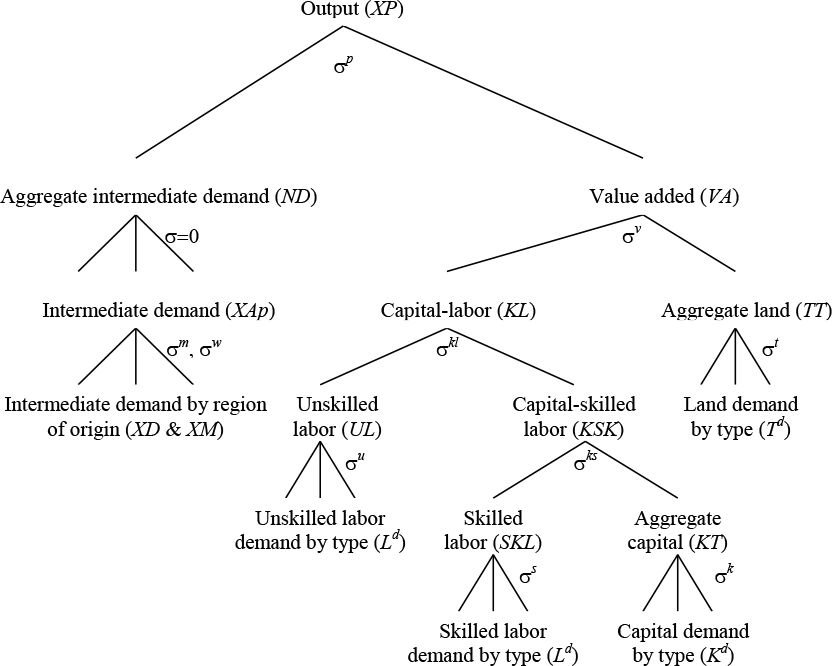
Figure 2

Nested structure of production in LINKAGE.
Source: van der Mensbrugghe (2006: 62).
Figure 3
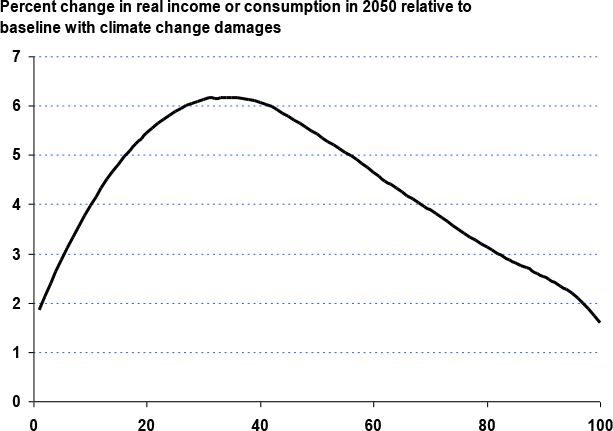
Global incidence of climate change damages.
Source: Simulations with World Bank’s GIDD model.
Tables
Table 1
Global Income Inequality.
| Index | 2000 | 2030 | Dispersion Only | Conver-gence Only |
|---|---|---|---|---|
| Gini | 0.672 | 0.626 | 0.673 | 0.625 |
| Theil | 0.905 | 0.749 | 0.904 | 0.749 |
| Mean Log Deviation | 0.884 | 0.764 | 0.893 | 0.759 |
-
Source: Authors’ own calculations using data from GIDD.
Table 2
Poverty is higher among agricultural households even if their incomes are less unequal.
| Gini (%) | Population Share (%) | Average Monthly Income (2000, US PPP) | 1-Dollar Poverty Incidence (%) | Poverty Share (%) | |
|---|---|---|---|---|---|
| Agriculture | 44.9 | 44.8 | 65.4 | 31.7 | 75.9 |
| Non-Agricultural | 62.8 | 55.2 | 328.9 | 8.1 | 24.0 |
| World | 67.0 | 1 | 210.8 | 18.7 | 1 |
-
Source: GIDD database.
Download links
A two-part list of links to download the article, or parts of the article, in various formats.