Simulating migration in the Pensim2 dynamic microsimulation model
- Teagasc Rural Economy Research Centre, Athenry, Co. Galway, Ireland
- Department for Work and Pensions (DWP), United Kingdom
- Teagasc Rural Economy Research Centre Athenry, United Kingdom
Abstract
Modelling migration is fundamentally important to maintaining the appropriate population structure in a dynamic microsimulation model. It is particularly important as it is faster changing than other demographic processes such as fertility and mortality and so can impact upon the structure of the population quickly. In this paper we review methods that have been used by other models and describe the choices and methods used in the Pensim2 dynamic microsimulation model. In particular we model immigration flows, emigration flows and the overseas population. We divide our method into modelling how many migrate using external macro data and who emigrates, based upon micro processes.
1. Introduction
With mortality and fertility, migration is one of the demographic processes that determine the population within a country. Fertility and especially mortality are relatively slow moving processes as they reflect long-term trends in society and in the health status of society. Migration, the flows of people into and out of a location, however changes relatively quickly in response to change in economic circumstances and in policy as witnessed by the recent entry of the new-entrant states to the EU. As a result this process can add significant uncertainty as to the size of the population and to population projections.
Given the long-term impacts of demographic change, they have potentially major impacts on long-term policy instruments such as pension’s policy. Modelling demographic characteristics such as migration therefore is important within analytical programmes for evaluating and designing pension’s policy reform such as dynamic microsimulation models. Migrants can be seen as a contributor to reducing the dependency ratio and improving the sustainability of the pensions system in OECD countries (See Stølen, amd Texmon, 2007). These immigrants, given the typical age profile may reduce the ratio of retirement to working age. However they themselves will build up future pension entitlements. In addition if one’s focus is on trying to capture the financial cost of the pension system, also depending upon the design of the pension system, people may accumulate pension entitlement while working in a country and then be eligible for receipt of pensions while living overseas. As most dynamic microsimulation models have a single country focus, these people with pension entitlement are typically not covered in nationally focused microsimulation models.
This paper focuses in particular at modelling migration in a dynamic microsimulation model whose focus is on both the distributional impact of pension policy in the home country and on the overall fiscal cost of public pensions. Specifically we focus on incorporating migration in the UK model based at the Department of Work and Pensions, Pensim2. The purpose of the paper is to describe and evaluate a methodology for undertaking this task.
The scope of Pensim2 is Great Britain (GB), simulating the main public and private pension instruments in Britain as well as the demographic, labour market and income processes that influence pension entitlement, membership, contribution and benefits as well as other income sources of pensioners.
Migration while important from the point of view of population coverage is of particular relevance for the UK pension system. This is the case for a number of reasons.
Firstly the pension system in Northern Ireland (NI), part of the UK, but not part of Pensim2 is the same as that of the rest of the UK and financed by the Treasury but administered by the Northern Ireland Civil Service. Migrants from NI to GB carry with them, transferable rights to a UK pension and as do GB migrants to NI.
Non-national (or at least non-members of the UK national insurance system) migrants may carry with them entitlement or partial entitlement to foreign pensions, but this is beyond the scope of this paper. However if they work in the UK, they may build up eligibility for UK entitlement and their tax and contribution payments help to finance the pension and social security system.
Returning emigrants similarly may have held rights overseas which is not relevant for the scope of this model or rights from previous residence in the UK, which is relevant.
Similarly emigrants who accrue rights in Britain may result in overseas obligations – however the size of the obligation depends upon the country of residence as non-reciprocal countries, countries without a bilateral social security agreement will not be eligible for increments due to indexation in their pensions.
In this paper we focus on the methodological aspects of modelling migration in a dynamic microsimulation model. Heavy use of calibration is used in this analysis. As a result aggregate results are trivial as the population is precisely adjusted by the calibrated number of immigrants and emigrants. We therefore do not undertake an empirical analysis of migration. Rather this paper focuses on the description and analysis of the methodology of modelling migration. What is more interesting empirically is the impact migration has on pensions including the impact of migration on the economic dependency ratio and its consequences for pension sustainability and the welfare of pensioners. This analysis is beyond the scope this paper and thus this analysis is deferred until a later paper.
In this paper, we shall firstly overview recent trends in UK migration. In Section 3, we shall review what other dynamic microsimulation models have done to model migration. Section 4 overviews the Pensim2 dynamic microsimulation model. Section 5 describes the data available for the UK as well as the methodology used for modelling migration.
2. Migration trends in the UK
Table 1 details recent trends in migration to the UK in relation to the origin and destination of immigrants and emigrants. In the early 1990’s the number of immigrants and emigrants was quite similar, with emigration exceeding immigration in 1992 and 1993. In the early to mid 1990’s both emigration and immigration declined or at least remained relatively static. In 1998, annual immigration increased by about 20%, while emigration did not exceed early 1990’s levels until 2000. These trends however have accelerated since this period, but with immigration accelerating at a more rapid pace. Between 1991 and 2006, emigration increased by over 60% while immigration increased by about 130%.
Migration Trends in the UK 1991–2006 (000’s).
| British | EU | Immigrants Commonwealth | Other | Total | British | EU | Emigrants Commonwealth | Other | Total | |
|---|---|---|---|---|---|---|---|---|---|---|
| 1991 | 110 | 53 | 85 | 82 | 330 | 154 | 53 | 35 | 43 | 285 |
| 1992 | 93 | 44 | 65 | 67 | 269 | 155 | 38 | 31 | 57 | 281 |
| 1993 | 86 | 44 | 70 | 65 | 265 | 149 | 40 | 34 | 43 | 266 |
| 1994 | 109 | 50 | 80 | 76 | 315 | 125 | 42 | 31 | 40 | 238 |
| 1995 | 84 | 61 | 85 | 82 | 312 | 135 | 38 | 29 | 34 | 236 |
| 1996 | 94 | 72 | 78 | 74 | 318 | 156 | 44 | 32 | 32 | 264 |
| 1997 | 90 | 71 | 90 | 76 | 327 | 149 | 53 | 40 | 37 | 279 |
| 1998 | 104 | 82 | 105 | 101 | 392 | 126 | 49 | 33 | 44 | 252 |
| 1999 | 115 | 66 | 123 | 150 | 454 | 139 | 59 | 41 | 52 | 291 |
| 2000 | 99 | 63 | 147 | 169 | 478 | 161 | 57 | 47 | 55 | 320 |
| 2001 | 110 | 57 | 149 | 164 | 480 | 158 | 49 | 51 | 49 | 307 |
| 2002 | 97 | 59 | 155 | 201 | 512 | 185 | 52 | 58 | 64 | 359 |
| 2003 | 99 | 64 | 167 | 177 | 507 | 191 | 50 | 59 | 62 | 362 |
| 2004 | 88 | 256 | 215 | 155 | 714 | 195 | 83 | 53 | 52 | 383 |
| 2005 | 96 | 295 | 180 | 137 | 708 | 185 | 108 | 60 | 59 | 412 |
| 2006 | 81 | 330 | 201 | 142 | 754 | 207 | 132 | 67 | 61 | 467 |
-
Source: ONS (2007) international migration: Migrants entering or leaving the United Kingdom and England and Wales, 2005.
The composition of migration has also changed. About a third of immigrants to the UK in 1991 were British citizens, with about 15% from the EU and a quarter each from the commonwealth and other countries. While the return flow of British citizens has been relatively stable, the proportion of total immigration has declined to about 10%. Other than a period in the mid 1990’s, EU immigration remained stable until the entrance of the new member states of the EU in 2004, now accounting for about 45% of immigrants, although the in-flow from Eastern Europe was visible in the other countries since 1999. The in-flow from commonwealth countries also has more than doubled in the period. The rationale for migration has changed with only 39% of immigrants coming to the UK to work or study in 1991 compared with 68% in 2005, evidencing the economic rationale for migration and the potential volatility that may arise in different economic circumstances.
While emigration has increased, the pattern has not changed much with about 50% (but a declining proportion) of emigrants being British nationals. About 30% of emigrants are EU citizens. Overall there is a greater number of British nationals emigrating than immigrating with the gap reaching 126,000 in 2006. All other nationalities have positive net inflows, particularly in recent times for EU nationals. Most of the inflow and out-flow is concentrated in and around London, but there has been a slight trend since the mid 1990’s for greater dispersal across the country of immigrants.
3. Modelling international migration in dynamic microsimulation models
In this section we review the methods used by existing dynamic microsimulation models, described in Table 2 drawing upon previous reviews of dynamic microsimulation models in O’Donoghue (2001), Spielauer (2002) and Pennec and Keegan (2007). There are a number of different possibilities in modelling migration. However because of the technicalities and/or focus on national populations, a number of models, especially dynamic cohort models such as LIFEMOD, HARDING and the LIAM cohort model but also dynamic population models such as SAGEMOD, INAHSIM (Inagaki, 2005) and Pensim2 (until now) did not include migration processes.
Components of migration modules used in dynamic microsimulation models internationally
| Data source | Migration flows | Emigration explanatory variables | Immigrant characteristics | Re-entry of emigrants | |
|---|---|---|---|---|---|
| APPSIM (Australia)1 | 2001 census, LSIA, overseas departure data | Immigration and Emigration | Age, sex, marital status, Australian or overseas-born | No | |
| CORSIM (USA) | Immigration statistics | Net Immigration | Age, marital status, race, sex of HOH | Age, marital status, race, sex | |
| DESTINIE (France) | 1998 Financial Assets Survey, 1999 census | Net migration only | n/a | Population projections, birth cohort distributions | No |
| DYNACAN (Canada) | Immigration and Emigration | HH process Number of Age, Number of gender and region | Age, gender, Clones existing family characteristics except CPP contributions | ||
| DYNAMOD (Australia) | 1986 census, LSIA, emigration records | Immigration (by visa status) and emigration flows, net long term migration | Age, sex, marital status, Australian or overseas-born | LSIA, cloned from census data | No |
| LIAM (Ireland) | 1986–2006 Census, 1994–1997 Labour Force Survey | Immigration and Emigration Flows | Age, Region | Quarterly National Household Survey divided into national and nonnational samples, Census | No |
| LifePaths (Canada) | 1921–1998 censuses, birth and immigration records | Immigration and emigration flows; international and interprovincial movement | Age, sex, province of residence, year, immigrant status, year of immigration | Immigration data | Yes |
| MOSART (Norway) | 1993 National Insurance data | Net migration only | n/a | General Norwegian population characteristics | No |
| NEDYMAS (Netherlan ds) | Immigration and emigration flows | Age, Year of birth, Family type, sex, marital status | Age, Year of birth, Family type, sex, marital status, year of previous emigration | ||
| Sverige (Sweden) | Immigration data from 1989–90 | Immigration and emigration flows | Age, sex, education level, previous immigration, country of origin, labour force participation, income | Immigration pool of 60 000 individuals | No |
| SESIM (Sweden) | Linda | Immigration and emigration flows | Swedish or foreign born, number of children, adults in household, highest education and oldest age in household, time since immigration | Linda | Yes |
-
Source: Pennec and Keegan (2007) and O’Donoghue (2001).
-
Note 1: APPSIM is based upon the proposed in Pennec and Keegan.
In order to maintain the correct population distribution, a model requires at a minimum net migration. This would adjust the population by the net change in migration (immigration minus emigration) each year. This is the method used by the CORSIM, DESTINIE and MOSART models Although requiring little extra external information, there are not that many computational gains from modelling migration in this way, as net migration can be positive or negative, thus requiring both immigration and emigration to be modelled. Also modelling net migration may bias the structure of the population as the number of foreign born may be too low as it will ignore the emigration. For example Pennec and Keegan (2007) identified that when modelling net migration, one may face a problem that while one may have information on immigrants and use this to model the population structure of net migrants, it may in fact be different to the population of emigrants.
Once a model contains decision to go down the route of modelling migration one needs to decide a number of issues
the nationality;
the unit of analysis;
permanent residents;
how to produce immigrants
Modelling the nationality of the individual is relevant for a number of reasons. Nationality may impact future labour market and demographic transitions, but also it may have an effect on pension membership as previous contributions may have been made previously. More precisely for the latter point it is national pension scheme membership that should be modelled. A number of models distinguish between national and nonnational migrants including DYNAMOD, LIAM, Lifepaths, NEDYMAS, Sverige and SESIM. SESIM and Lifepaths in addition model re-entry. SESIM uses data on overseas Swedish residents for this.
The unit of analysis relates to the decision making unit, which could vary from the household to the tax or benefit unit or the individual. In other words when migration is modelled do we move individuals by themselves or together with other individuals. We face a choice as to which unit will be modelled. Typically migration is modelled using the same unit of analysis as for other processes, typically the tax or benefit unit or household. This poses slight methodological issues as external control totals are typically only available at the individual level which is at a different level to the unit of analysis and so calibration routines need to be altered.
Some models such as Lifepaths exclude nonpermanent residents from their models. In the UK an increasing number of immigrants express a preference of staying for shorter periods with about half planning to stay 1–2 years. DYNAMOD distinguishes between different types of emigrants such as permanent (differentiated by skill level) and long-term migrants
Emigration tends to be modelled as a regression based upon characteristics such as age, sex, marital status nationality, residence and labour force status. While emigration is relatively easy to do as existing individuals are simulated to leave the model,1 immigration requires the generation of new individuals, which creates the problem of how to maintain multi-dimensional characteristics of the population. A number of models such as Lifepaths and DESTINIE synthetically generate new individuals and assign individual characteristics, the main method used in dynamic microsimulation models is to clone individuals either from the existing population as in the case of DYNAMOD and DYNACAN or from specific immigrant pools such as LIAM and SVERIGE.
4. Pensim2
Pensim2 is a dynamic microsimulation model developed by the UK Department of Work and Pensions (See Drane, 2006). The model is a second generation model based upon a combination of administrative data (the LLMDB described below) and survey data (Family Resources Survey and British Household Panel Survey), combined using data fusion (See Redway, 2003). The coverage of the model is Great Britain, so the United Kingdom excluding Northern Ireland, whose pension system is managed by a different Ministry. Pudney (1992) describes the earlier Pensim model. The model is constructed using the GENESIS modelling framework, constructed in SAS, (See Edwards, 2004), which has been used to develop a suite of models within the DWP for benefit forecasting and labour market analysis.
Utilising the categorisation of O’Donoghue (2001), the model can be categorised as a
Cross-sectional longitudinal model, projecting cross-section of the population forward in time
Discrete time intervals, although containing episode data to be able to generate semi-continuous time episodes
Closed model, where spouses are married within the sample. New children are imported into the model
Aligned model, using extensive alignment of demographic and labour market characteristics
Statistical, in that currently behaviour is not modelled endogenous to policy
The model contains detailed demographic, labour market and pension’s data. Tax-benefit policy is simulated via the DWP’s Policy Simulation Model (PSM). At present other income sources such as capital income and housing costs are modelled solely for pension age individuals. A key gap is in the maintenance of the actual GB population. The unit of analysis is the benefit unit. An evaluation of the processes contained with the model is described in Emmerson et al., (2004).
The model is fully operational, although subject to continuous updating and improvement and particularly used for pensions analysis. It formed the basis of the UK Pensions Commission Report (Turner et al., 2005) and the subsequent White Paper on Pensions.
Data and Methodology
In this section we consider how to model migration in the UK as part of Pensim2. The objective of the module is to
Enable the model to reflect the population totals of the population projections of the Office for National Statistics
Include sufficient information to be able to simulate the expenditure of the GB Pension model2
In making our modelling choices, we base our decision on the experience of other models internationally, highlighted above.
As there are few extra modelling components required to simulate immigration and emigration instead of net migration alone, unless one makes the assumption as the Norwegian MOSART model does that there is always positive inward net migration, we model these processes separately. This will help us to avoid producing biased population estimates due to the different characteristics of emigrants (mainly UK nationals) and immigrants (mainly non-UK nationals).
Fundamentally the modelling strategy is multistage see Figure 1. For both immigration and emigration, we have macro level processes known as alignment or calibration containing external control totals to model the number of migrants, or the how question and micro equations and processes to model what types of individuals migrate, the who question. As we are also interested in the population living overseas due to their eligibility for pensions, we must also model some of the processes relevant to their eligibility.
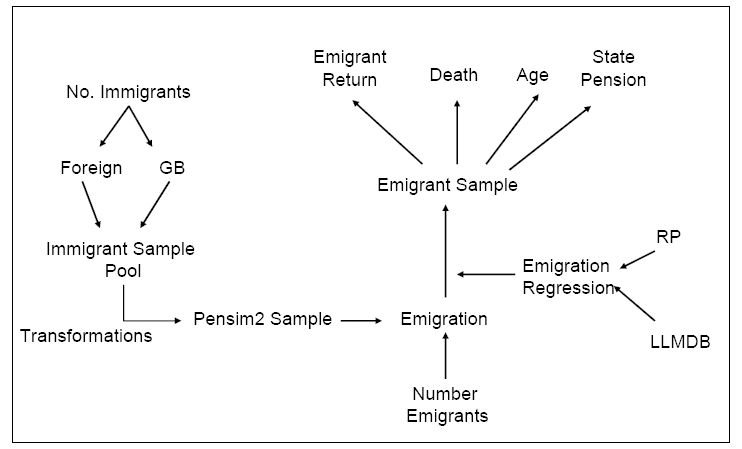

Migration Model Outline.
Migration poses a number of challenges to a closed microsimulation model as:
we have to bring the people into the population,
we have to model processes where the external control totals have different units of analysis to the micro equations, and
we may have to model a population living overseas.
In the following sections we discuss the choices and the decisions made in developing the model.
5.1 Control Totals
Key to our simulation of the number of migrants is appropriate control totals.3 Frequently, population projections publish only net migration totals, rather than the gross flows into and out of the country. One must then make an assumption as to how to disaggregate this net variable into these gross components. One possibility is to use historic ratios of emigration and immigration totals. However the question then is how to transform changes in the net migration totals to the gross migration totals. If net outward migration or net inward migration increases, then it may be reasonable to apply the ratio of the net migration to the gross migration totals to produce new estimated gross flows. However the difficulty occurs when the net migration total changes sign. In this case the ratio will be negative, having no sensible meaning in adjusting the gross control totals. Our solution is rather than concentrating on the level of the net totals, we focus on the absolute change in the net totals. Consider the following.
Net migration in baseline: NM1 = I1 − E1.
Net migration in future year: NM2 = I2 − E2.
We observe the following values: historic net migration (NM1), historic inward migration (I1) and historic outward migration (E1) as well as the future assumed value of net migration (NM1). The change in net migration is also known:
One arbitrary assumption is to assume that the change in migration is borne in proportion to the original gross flows. Thus if ANM are positive then, immigration increases by
and emigration decreases by
If ΔM is negative then the gross flows decrease by these proportions. Therefore summing:
Also
thus
or
Thus we can express the future net migration in terms of known values, where
and
We face a choice in what we use for k. In Figure 2 we consider a number of different possibilities. In this graphic we consider the performance of our assumptions based upon a dataset that exhibited relatively small variations from 35,000 to 1,05,000 in the period 1991–1997, but increased rapidly to 1,50,000 to 2,25,000 in the 1998–2005 periods. In Figure 1, we consider in turn the assumption that (a) k depends upon the transition in the previous year, (b) that k depends upon the average transition over the period and (c) that k depends upon the value based upon 1991 transitions. We find that assumption (a) performs the best as the transitions year on year are smaller than over longer periods, while the average in (b) performs better than when k is based upon the 1991 transitions in (c). This is particularly noticeable in the 1998–2005 when there is greater volatility, but less important in the less volatile 1991–1997 period. This is not surprising as a sudden surge is likely to be as a result of either a large increase in immigration or emigration, due to an asymmetric shock such as immigration due to a war or entry of new states to the EU or emigration due to a downturn in the national economy. We would therefore argue for k based upon the shortest time, the lag order one.
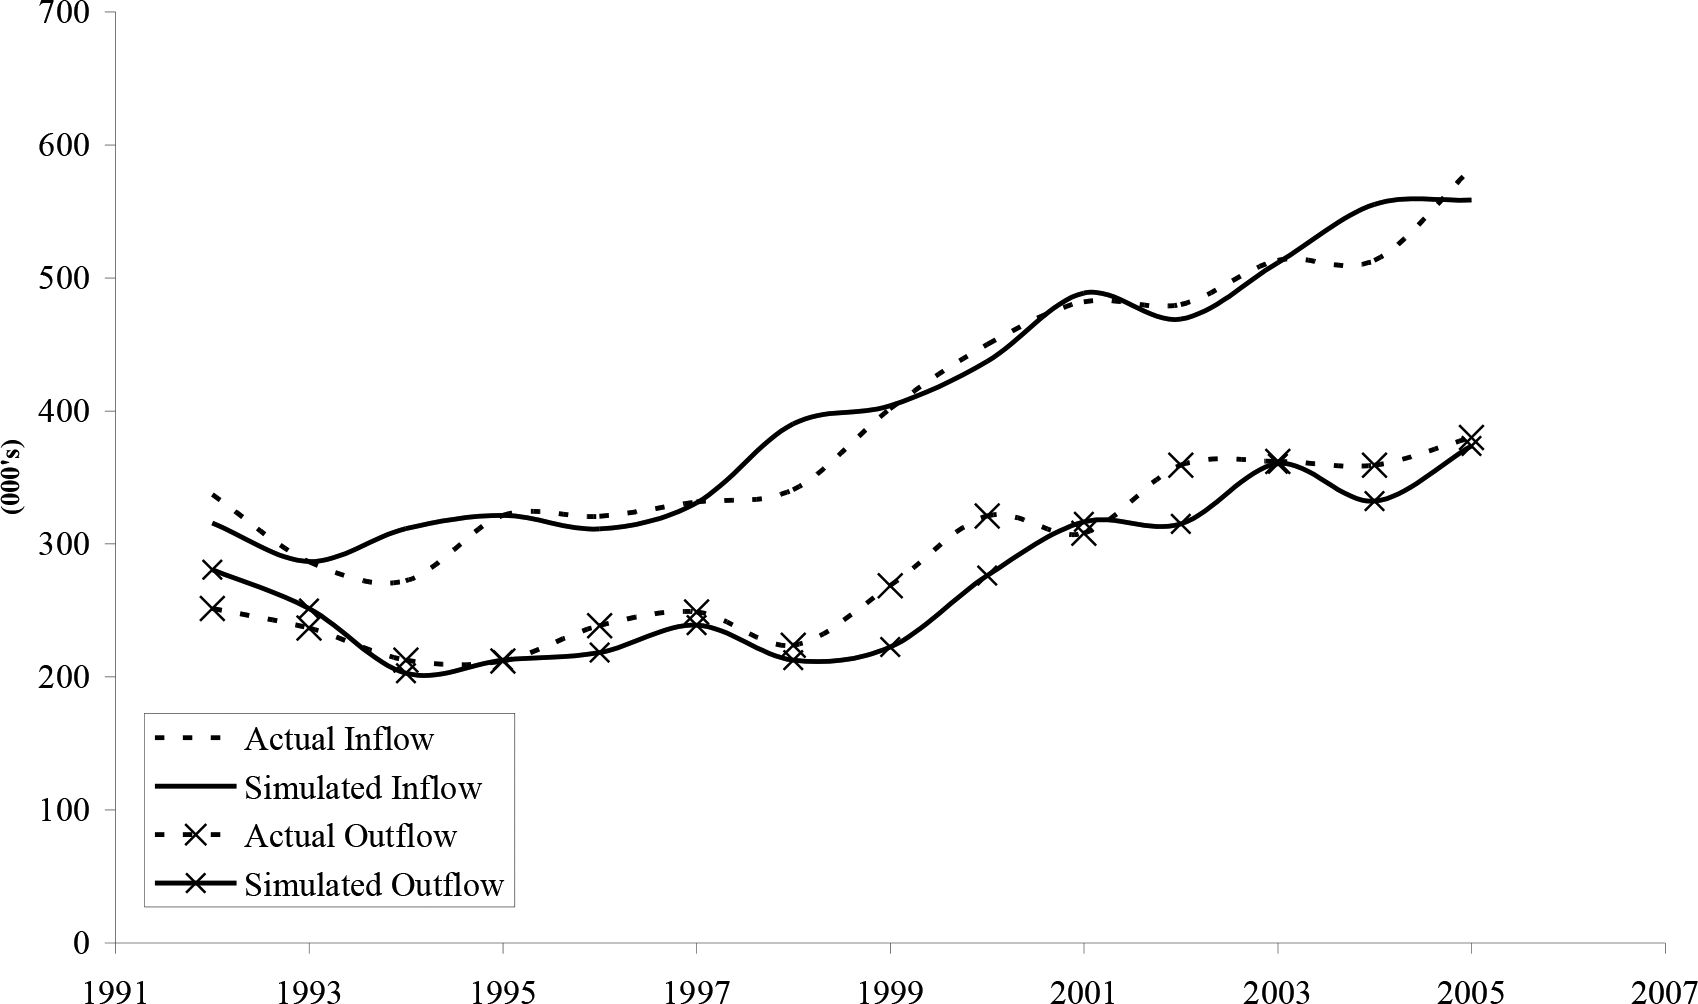

k – based upon lagged transitions (1991–2000)
Utilising ONS net migration projections and the disaggregation method described here, based on historical gross migration flows, we describe in Figure 3 the control totals used in the model for the total number of immigrants and emigrants.
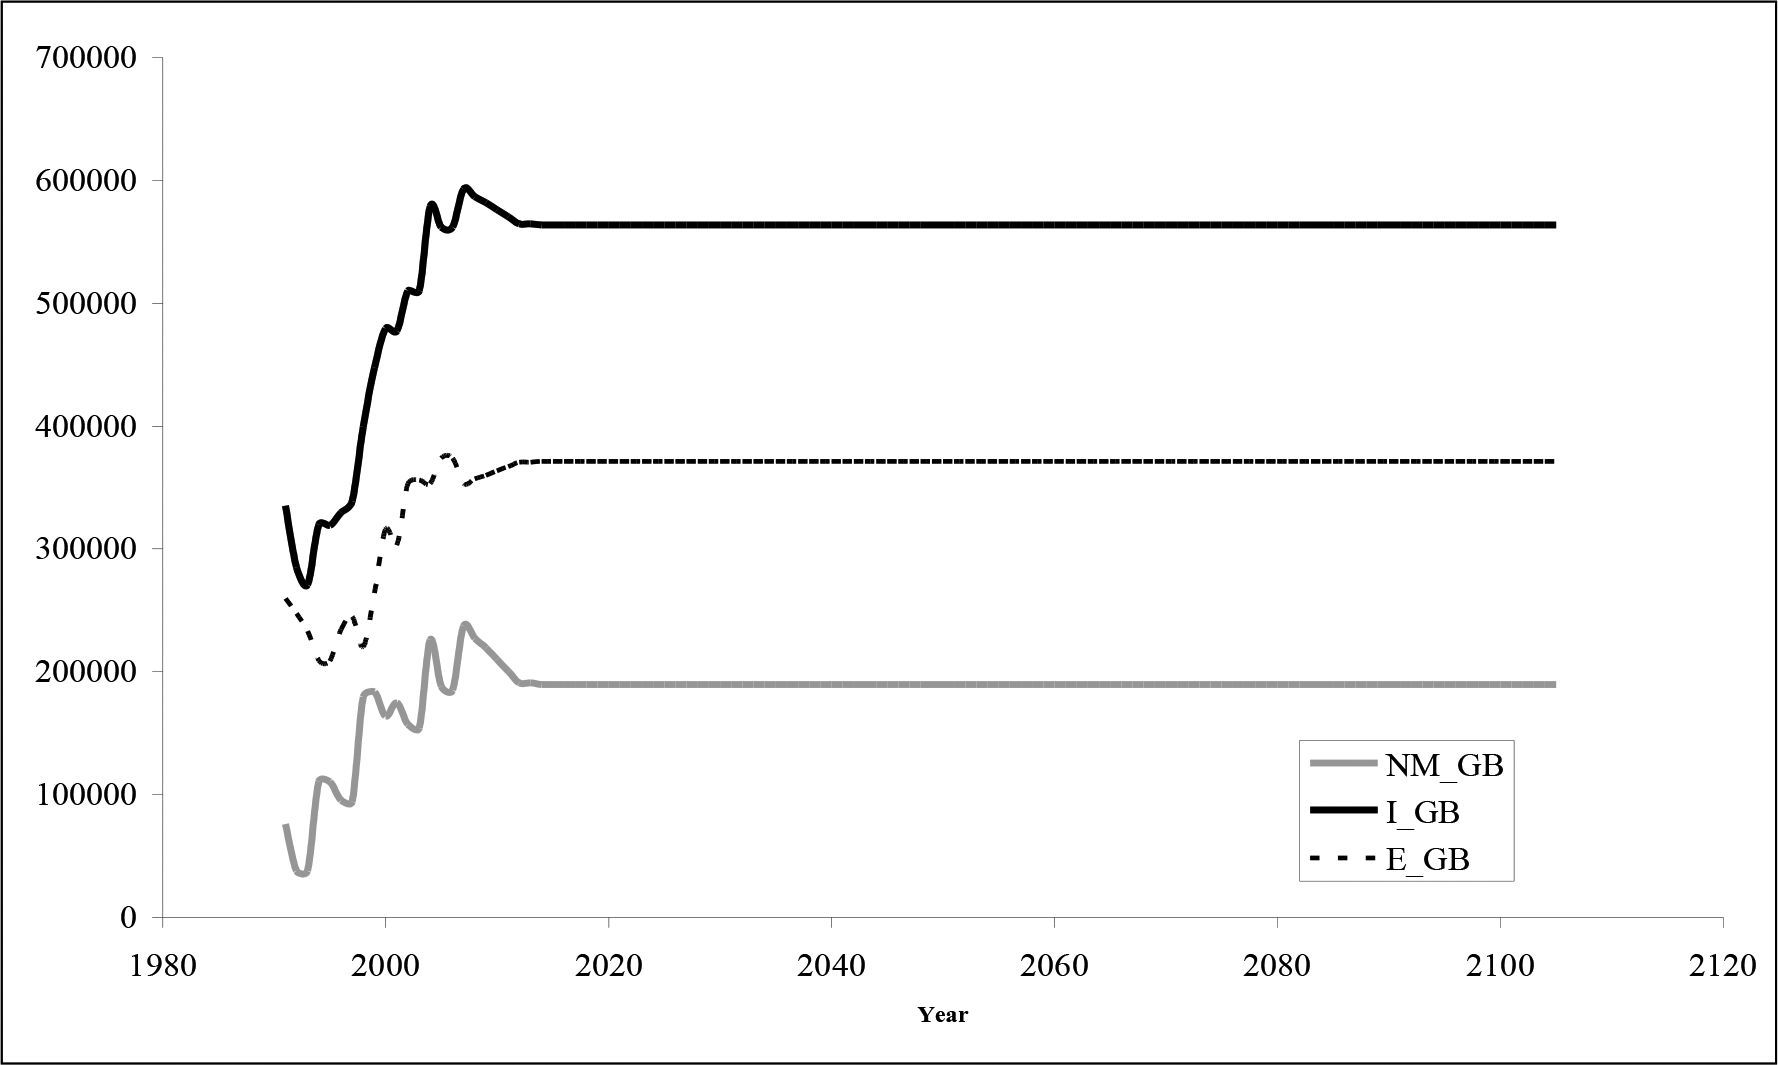

External Control Totals for Emigration and Immigration
5.2 Modelling Who Immigrates
In this section we develop a framework to simulate who immigrates having produced external controls totals above as to how many immigrate. Immigrants are relatively difficult to model as new people have to enter the model. In many ways it is similar to generating a new child. However the characteristics of a new immigrant are more complicated. A new immigrant may have demographic, education and labour market histories that are relevant for future transitions. They may themselves bring with them other dependants such as children and spouses. Therefore as for emigrants we face the issue that the relevant unit of analysis is wider than the individual. We choose for our purposes the tax or benefit unit.
Modelling entry characteristics of immigrants and their dependants can be difficult as it is a multi dimensional problem. It would require the estimation of models to simulate the entry characteristics of all new immigrants and this is quite time consuming.
Duleep and Dowha (2008a) discuss a number of methods for incorporating immigrants in a microsimulation model; (a) the “human capital” approach, (b) the “past-is-prologue” approach, and (c) the “donor” approach. We utilise a donor or cloning approach. As outlined in Table 1, a number of models such as DYNACAN, DYNAMOD, LIAM and CBOLT (Simpson, 2009) etc clone individuals from a stored sample of immigrants. When immigrants are required we sample without replacement and treat these new immigrants as new people.
As outlined above, immigration like other migration processes faces the problem that external control totals have a different unit of analysis to that used for simulation. In other words the total number of immigrants depends upon the Office for National Statistics (ONS) individual level population statistics, while we desire benefit units to immigrate together. Therefore cloning is not simply the case of taking a random sample of individual immigrants and bringing them into the model, we need to take a random sample of immigrant families and ensure that the numbers of individuals are consistent with the external control totals. These individual control totals can themselves be decomposed into sub-groups such as age-sex-nationality further complicating the process. As outlined above, we need to distinguish between UK-national immigrants and non-UK national immigrants on the grounds of location and thus pension entitlement while abroad to produce the consistency with the emigration module. Also native and non native immigrants have quite different characteristics. For example native reimmigrants tend to be older than non-native immigrants. Therefore, we store two immigration samples to clone individuals, containing (a) a sample of UK-national immigrants and their UK and non-UK national dependants and (b) a sample of non UK national immigrants. This sample is drawn from the 2003 Labour Force survey spring sample.
This sampling process uses a variant of the pageant algorithm due to Chènard (2000) to produce the appropriate age-sex distribution. This algorithm is described in the appendix below and essentially ensures that sampled families produce consistent individual unit targets. While the algorithm is generic the sample size is important in determining how many dimensions one can use in the sampling. We initially started with age and sex categories, however due to the small sample size, we restrict the selection to total numbers of migrants.
Modelling Who Emigrates
While simulating the emigration of an individual or family is not particularly difficult as it involves the simulation of a process of individuals within the model as a function of their characteristics, accessing the data necessary to estimate a model of emigration is more difficult.
In producing population and migration estimates and projections, the Office for National Statistics (ONS) uses data from the International Passenger Survey. This survey contains details about the personal and migration characteristics of emigrants and immigrants and is conducted at ports, airports and the channel tunnel in the UK. It is combined with data from the Republic of Ireland to include migration between Ireland and the UK. This data is useful in quantifying absolute flows. However for the purpose of modelling emigration transitions, we require not only information on those who emigrated, but also those who did not, so as to model the probability of leaving.
The Lifetime Labour Market Database (LLMDB) is a 1% sample drawn from administrative records of the national insurance system of UK. It is an individual based panel dataset containing income, labour market, demographic, national insurance and pension characteristics. Of particular relevance to us is the availability of a migration flag. Although emigration is not collected as part of the administrative procedures emigration has been modelled in the data by the data providers.4 This variable is generated using two pieces of information,
those who have registered as living abroad such as those in receipt of benefits
and
a calibrated adjustment based upon a proportion those who have a gap in their connection with the social security system of two years or more for those who are aged over 23 and a gap of 5 years for women aged 45 or over. The gap for women is greater due to the longer employment gaps of women from the labour market due to caring.
These results have been calibrated to ensure that the dataset agrees with the ONS population estimates for the country by age and sex.
This dataset has been used to estimate a probit model of emigration detailed in Table 3 below. The summary statistics of the variables are contained in Table 4. The model estimates contain age decade dummies interacted with previous immigrant status, showing that the emigration probability for men and women rises to a peak in the mid to late 20’s before falling back. Immigrants are significantly more likely to emigrate. These results are consistent with external totals given by the ONS. In testing the model, we considered the inclusion of lagged employment and out of work status variables, however as these variables were used in creating the emigrant flag, we found that all had negative signs, due in part to the fact that individuals who are classified as emigrants are people who, in part, have developed a history of non-interaction with the insurance system.
Probit Model of Emigration
| Variable | Coefficient | p-value |
|---|---|---|
| Male | 0.085838 | |
| Age 20–29 | 1.147498 | 0 |
| Age 30–39 | 1.040151 | |
| Age 40–49 | 0.876858 | |
| Age 50–59 | 0.812458 | |
| Age 60–65 | 1.432797 | |
| Immigrant × Age 20–29 | 0.908987 | 0 |
| Immigrant × Age 30–39 | 0.656066 | |
| Immigrant × Age 40–49 | 0.545079 | |
| Immigrant × Age 50–59 | 0.574327 | |
| Immigrant × Age 60–65 | 0.732853 | |
| Immigrant | −0.0267 | 0 |
| Constant | −3.91427 | 0 |
| Sample Size | 1305652 | |
| Pseudo R2 | 0.072 | |
| Proportion Emigrate | 0.0046 |
-
Note: Year dummy variables are also included in the model
-
Data source: LLMDB (1975–2006), working age population
Summmary Statistics Emigration
| Variable | Males | Females |
| Age | 39.4 | 37.7 |
| Immigrant | 0.104 | 0.101 |
-
Note: Year and Cohort dummy variables are also included in the model Data source: LLMDB 1975–2006, working age population
One other problem that was identified when simulating using the model was that there was an unexpected number of emigrants over 60. Because the simulations are calibrated by total number of emigrants, this tends to skew the age structure of the emigrants. The issue we identified for this problem relates also to the construction of the emigration variable in the underlying data, which depends upon a period of lack of contact with the social insurance system for a period of years. It is likely that individuals with personal pensions or savings who take early retirement may neither be in employment, nor in receipt of benefits and thus may appear to meet the criteria for having emigrated.
We therefore have to use an alternative methodology. In this case we disaggregate emigration totals into ages 15–59 and 60+. For the younger age group, we continue to utilise the emigration probit model and for the older age group we use a transition probability based upon official statistics.
Partners and dependent children are likely to move with the emigrant (unless there is a family break-up which is modelled separately or where an individual moves temporarily away for work purposes which is difficult to model). Therefore emigration should be modelled using the family or benefit unit of analysis. As the unit of analysis of the LLMDB is individual, to produce the ranking variable used to select benefit units for emigration, we select the highest emigration probability within a benefit unit. Benefit units are then ranked by this probability to select emigrant families.
Our choice of data causes us some problems as the estimation data is based upon individual characteristics rather than family characteristics. One of our objectives is to hit the ONS population projection totals by age and sex. Therefore when we simulate emigration we utilise these totals as our external control total. Again however these external control totals are at the individual level not the family level. Our solution therefore is to simulate first the probability of an adult emigrating including a stochastic component. A running total is retained of the number of emigrants until we have reached the desired control total.
One issue that arose was in determining whether to use a single total of emigrants or to vary it by age and sex. We chose the former for test purposes however an algorithm has been developed to ensure that the ONS age-sex assumptions can be achieved to be implemented later in the development stage of the model. The algorithm takes the following form and is akin to quota sampling without replacement.
Sort possible emigrant families by the probability of emigration as above
Divide the population into groups corresponding to the ONS age-sex migration profiles at the individual level
As a family emigrates the numbers in the individual emigration “bins” are incremented
Once a bin is full, no further family with a member with the characteristic of this bin may emigrate. The next family to emigrate is a family where the bins are not full
Continue until all emigrant bins are full
This method is distinct from the Pageant algorithm due to Chènard (2000), which uses the gap between desired emigrant numbers per bin and the number selected to influence the probability of each new emigrant.
Figure 3 above outlines the external control totals. The ONS based results have been adjusted to exclude emigrants from Northern Ireland.
However at present no adjustment has been made to include people who leave Great Britain to live in Northern Ireland.
Flows to and from the Overseas Population
Another question we would like to address is whether we want to keep a pool of emigrants who can return as return migrants later? The SESIM model does this to be able to model the pension entitlements of foreign residents, a requirement also of Pensim2. APPSIM because of the difficulty in maintaining all characteristics of emigrants chose not to simulate this group. These issues make it impossible to maintain representative characteristics of the emigrant population due to the fact that their behaviour and characteristics are likely to be different to the home population, requiring in effect a different or even multiple microsimulation models to simulate their characteristics.
However there is an intermediate possibility. In order to model pension expenditures, we merely require information about the age, pension contributions and mortality of overseas retirees. What is required therefore is to maintain an external sample of these retirees and to model flows to and from this sample. As individuals do not accumulate pension rights abroad, we simply model the mortality rate of these emigrants. When a family emigrates they move into the emigrant pool or overseas sample, bringing with them their pension entitlements.
Returning immigrants are simulated using a model outlined above. However as we do not simulate their life-cycle characteristics such as marriage, children, labour market, incomes, savings etc, we cannot move an individual from the emigrant population. Rather for each returning emigrant we select randomly (without replacement and individual from the emigrant pool) and discard them. Instead we assign their pension contribution to sampled returning immigrant (containing the full range of characteristics required for immigrants) described above on the basis of their age and sex. Thus we maintain the total sum of pension contributions and accrued obligations under the national insurance system, while also maintaining the representativity of the immigrant population.
Modelling the initial stock of the Overseas Population
As the purpose of the model is to model total entitlement to UK state pensions, we need to not only model the number of people who leave and enter, which are flow variables, but also model the stock of people living abroad who either have entitlement to the state pension or have accumulated entitlement to state pensions in the future. This stock will depend upon the initial stock of emigrants plus flows due to emigration from the Britain and re-immigration of emigrants back to Britain and deaths of the emigrant population.
We now describe the process of creating this initial stock of the population living overseas. This component of the model adds an additional layer of complexity as it extends the scope of the model beyond a single nation state. This poses significant data problems. While, although nontrivial, it is relatively straight forward to produce a base dataset for a population living within a country as this tends to be consistent with existing datasets, creating a base dataset of people living abroad in many different countries is typically not available in a single source. In this section we describe the creation of the initial stock or sample of emigrants at the start of the simulation and the maintenance of this stock over time. We call this our emigrant pool.
In order to solve the base dataset problem we utilise a number of different datasets. While no single dataset exists of those living abroad, we can achieve our objective through a number of steps.
Firstly administrative data on retirement pensions, the RP dataset, contains all pension recipients for the British pension system. Although the data is only at the individual unit of analysis and has limited contextual variables, it has sufficient information to model current pension entitlements. This is our starting sample contains a sample of pension age individuals drawn randomly from the RP dataset to be consistent with the sample size of the Pensim2 starting population.
For working age emigrants, the situation is less straightforward as no single dataset contains a sample of these emigrants. Rather we utilise information on the characteristics of emigrants contained in the LLMDB dataset described above to serve as our pool of working age emigrants.
While the RP dataset contains the number of emigrant pensioners, we do not know precisely the number of British nationals of working age living overseas. We calculate the stock of working age emigrants from estimates in the IPPR Brits Abroad study which using Census, passport and social security data estimates the number of British emigrants. Subtracting the number of pension emigrants in the RP dataset we get the number of working age emigrants.
In addition we want to know not only the number of emigrants, but also the country of residence. This is relevant as social security benefits are only indexed for countries for which Britain has a Social Security Agreement. Using the IPPR data, we find that 8% of pensioners and 18% of all emigrants are living in countries without social security agreements. At present we assign individuals to countries randomly.
As both samples represent different proportions of the population, we create an emigrant pool with the correct proportion of working age and pension age using external control totals from the RP and IPPR data and sample randomly from each dataset. The unit of analysis in the first year is the individual due to the structure of the available data.
Emigrant Processes
As individuals emigrate within the emigration process above, they are moved from the nationally resident dataset into the emigrant pool and are then subject to a number emigrant processes. One of the intentions of the model is to be able to simulate the cost of pensions to overseas residents. This is particularly relevant given recent changes to the pension legislation that give benefits proportional to the years of contributions, without requiring a minimum threshold. In other words, spending even a year in the UK will entitle someone to a partial pension from Britain and thus given the substantial number of immigration and emigration in recent years, there will be potentially very many emigrants with future pension entitlement.
While immigrants in the model enter the dataset and are then simulated like other individuals, for emigrants this is not possible. This is because (a) they are not subject to the control totals used within the model and (b) have different contextual information and so from a technical perspective can not be simulated using existing code.
Therefore we need to model a number of relevant processes separately. We have chosen to model a subset of processes as we do not have models that contain the transition processes for other countries. These are:
Mortality
Re-immigration
State Pension Simulations
The mortality model in Pensim2 is quite complicated requiring information about incomes, disability and IS membership etc. As we really only have information on age and sex, we make the simplifying assumption that emigrants have the same mortality rate as individuals of the same age and sex in the UK.
We also model re-immigration using the same control totals for the GB born in the immigration module. However, because we do not model family formation for emigrants, if we were to reintroduce these families to Pensim2, our population distribution may be affected. Therefore our strategy is to take out one for one an individual from the emigrant pool and treat them as if they were dead.
Lastly we model pension entitlement. Table 5 below outlines the processes simulated. Work thus far has focused on preparing the variables in the base-data required to simulate these processes. In terms of pension simulation, we assume pensions received by those in pension age continue as is, while for working age emigrants, their pension will be simulated using the entitlement rules based upon their accumulated contributions and earnings histories. This entitlement depends both upon simulated variables for periods an individual spends in the future part of the model and variables contained in the base data. For simulated emigrants, this is consistent with the simulation for nationally resident, however those who start the model within the emigrant pool, we have to generate the appropriate variables.
Processes used to calculated for state pension.
| Name | Description |
|---|---|
| sp01 SetVarStatePenPe | Set Variables to PE for state pension calculation |
| sp02_SetVarStatePenPa | Set Variables to PA for state pension calculation |
| sp03_WaBspAccrual1 | Calculate the accrual of BSP/HRP rights |
| sp04_WaGrossApAccrual | Gross AP accrual |
| sp07_WaAPValue | Net AP accrual |
| sp08_ClaimStatePen | Whether individual will claim state pensions |
| sp09_AmountStatePen | Amount/Value of state pensions claimed |
5. Conclusions
In this paper we developed a methodology for simulating migration in a dynamic microsimulation model. The method builds on methodologies used in other models, particularly in Sweden, Canada and Australia and focuses in particular on defining the algorithms used. We hope that these algorithms will prove useful to other model builders. Our migration module consisted of a number of parts. Firstly immigration was modelled using a sampling routine from an external sample of British and non-British migrants.
Emigrants were modelled utilising an emigration regression. Emigrants move into an external pool of emigrants who are then subjected to a sub-set of processes in order to be able to model pension expenditure amongst pensioners living abroad. Unlike the domestic pensioners, at present it is not possible to model the relative welfare of these pensioners as we neither model other family members and family formation, nor do we model other income sources. However the model is useful in capturing future liability for pensions paid to overseas pensioners and to assess the cost of pension reforms for this group.
One key gap in the model is migration between Northern Ireland which has a separate pension system and mainland GB. Given the transferability of eligibility for migrants between these different parts of the UK, this is an issue that will have to be dealt with in medium term improvements in the model.
Lastly once immigrants are introduced into the model, the question then remains what we do with them once they enter the model. Sulaheen and Shadforth (2006) and Haque et al. (2002) describe the situation of migrants in the UK, highlighting that immigrants tend to be younger, more like to be in work, but also likely to be both in the highest paid professions and the lowest paid professions, but less represented in the middle of the distribution. New immigrants are also more educated than older immigrants. Also there is quite a significant wage gap between immigrants and UK born. However for background information, it would be useful to have a handle on the extent to which migrant and non-migrant histories differ, even if only to provide some contextual background for simulations.
Incorporating this information would require the re-estimation of the entire labour market and demographic processes of the model and thus adjusting the other modules to account for alternative transitions for migrant and non-migrants is a very large task. Re-estimating existing models of labour market characteristics was beyond the scope of this project.
Therefore labour market processes for immigrants were not differentially simulated. Rather it was assumed that the difference in education and experience variables will account for the earnings and employment differential. However Duleep and Dowha (2008c) acknowledge that this approach from the point of view of simulating migrant earnings is problematical. It is likely to misrepresent the earnings profiles of migrants. They also recommend that in estimating models of migrant earnings, that separate equations should be estimated for migrants rather than simply including dummy variables in existing earnings regression models. This recommendation is likely to apply to other components of the labour market as well. Therefore it is hoped to improve this aspect in future developments of the model.
Footnotes
1.
This is unless one wants to track an individual living overseas, who accumulates pension entitlements which are transferable to their original country and then goes home to claim pension rights there.
2.
Note Northern Ireland is not included within the scope of Pensim2.
3.
For a good description of how to produce migration projections, see Duleep and Dowha (2008b). They consider a three methods for generating projections, (a) a time series approach basing future trends on recent historical trends and (b) a structural approach involving a number of steps1 and (c) a hybrid approach involving both time-series and structural.
4.
Information in relation to the simulation has been provided in a personal communication with Andrew Needham who constructed the variable in the llmdb.
Appendix
Glossary of Terms
In the appendices below, we detail the algorithms used for migration within Pensim2. Data is stored in different tables. In this glossary we define the different tables
– Person Annual Table: Annual changing values for individuals
– Person Table: Non changing values for individuals
– Benefit Unit Annual Table: Changing values for Benefit Units
– Benefit Unit Table: Non changing values for Benefit Units
Immigration Algorithm
Select Number of GB national individuals GB(g) and non-nationals F(g) per group to be migrated. We set this number as a proportion of the sample size so as to allow for different base data samples to be used, pGB(g) and pF(g) such that N(g) = N * pGB(g) and F(g) = N*pF(g).
In Pensim2, the rates are stored as assignments pGB(g) and pF(g)
In BU table of GB Immigrants (for simpler selection)
Generate variables nGBImmig and nForImmig as products of N*pGB(g) and N*pF(g).
Generate a random number in BU table
Sort BU’s by random number
Calculate the cumulative number of GB members of BU by this order cumulnGBImmig
Calculate the cumulative number of Foreign members of BU by this order cumulnForImmig
Store the lagged value of cumulnGBImmig _1
Select BU’s if cumulative sum is less than nGBImmig → SelectGBImmig = 1
Generate a random number r_GBImmig
If there is a BU where cumulnGBImmig > nGBImmig and cumulnGBImmig _1 < nGBImmig, calculate the difference diff_cumulnGBImmig = cumulnGBImmig -cumulnGBImmig_1
If r_GBImmig < [nGBImmig/cumulnGBImmig_1]/ diff_cumulnGBImmig then also select this BU set SelectGBImmig = 1
Drop if SelectGBImmig = 0
Save as TempGBImmigBU
Merge with PA and PE
In PA and PE keep if SelectGBImmig = 1, store respectively as TempGBImmigPA and TempGBImmigBE
Transform variables in all 3 Temporary files to be consistent with new people
New Person ID in PA and PE tables
New BU ID in BU table
New BU ID in PA and PE tables consistent with their BU
Change date of birth so that age is consistent with year of entry to country
Subtract cumulnForImmig from nForImmig and set to New_nForImmig → Remainder of foreign immigrants come from all foreign benefit units
In BU table for the subset of Foreign Immigrants
Steps required for a more complicated age specific alignment.
Initialise by setting to zero the number of national individuals N’(g) and non-nationals F’(g) per group that have been allocated
Assign each family in migrant sample pool 1 (containing national returning – can include non-national dependants) a random number
For this we need a benefit unit file → link PE and PA tables to do this.
Sort migrant sample pool 1 according to random number
Select family of all individuals can be accommodated in a group if N’(g) < N(g) and F’(g) < F(g)
If N’(g) ≥ N(g) or F’(g) ≥ F(g), then skip family and consider next family in order
Increment N’(g) for each national born individual (according to their group g) and F’(g) for non-national dependants who are to enter the model
Copy family from sample pool 1 to model data structure
Initialise individual with new ID’s and assign location and housing information etc.
Repeat these steps until N’(g) = N(g) for all groups g.
Repeat for sample 2, containing only non-national born families.
References
-
1
Microsimulation Modelling for Policy AnalysisIndividual alignment and group processing: an application to migration processes in DYNACAN, (eds), Microsimulation Modelling for Policy Analysis, Cambridge University Press, Cambridge.
-
2
Pensim2: Analysing the Effect of Government Policy in the Long-termPresentation to the, Pensions Policy Institute Modelling Seminar, http://www.pensionspolicyinstitute.org.uk/uploadeddocuments/Events/DWP_Presentation_at_PPI_Modelling_Seminar_06_2006.pdf, March, 3rd.
- 3
-
4
Incorporating Immigrant Flows into Microsimulation Models Social Security BulletinIncorporating Immigrant Flows into Microsimulation Models Social Security Bulletin, 68, 1.
- 5
-
6
GENESIS: SAS based computing environment for dynamic microsimulation modelsMimeo: Department of Work and Pensions.
-
7
An Assessment of Pensim2. IFS Working Paper W04/21An Assessment of Pensim2. IFS Working Paper W04/21.
-
8
A Microsimulation Model for Projections of the Japanese Socioeconomic Structure (INAHSIM). IPSS Discussion Paper Series No.2005-03A Microsimulation Model for Projections of the Japanese Socioeconomic Structure (INAHSIM). IPSS Discussion Paper Series No.2005-03.
- 9
-
10
Migrants in the UK: their characteristics and labour market outcomes and impactsRDS Occasional Paper No 82.
- 11
-
12
APPSIM -Modelling Migration National Centre for Social and Economic Modelling (NATSEM). Working Paper No. 5APPSIM -Modelling Migration National Centre for Social and Economic Modelling (NATSEM). Working Paper No. 5, University of Canberra.
-
13
Dept. of Applied Economics Microsimulation Unit DiscussionDynamic Simulation of Pensioner’s incomes: methodological issues and a model design for Great Britain, Dept. of Applied Economics Microsimulation Unit Discussion, paper no. MSPMU 9201, University of Cambridge.
-
14
Data Fusion through Statistical Matching – Creating the Base Dataset for Pensim2Presentation to the, Microsimulation Conference, Canberra, 2003, https://guard.canberra.edu.au/natsem/conference2003/papers/pdf/ppt_redway_h.pdf, March, 3rd.
-
15
Immigrant characteristics and the supply potential of the economyQ4, Quarterly Bulletin.
-
16
Incorporating Immigration into Microsimulation ModelsPaper Presented to the, 2nd General Conference of the International Microsimulation Association, Ottawa.
-
17
The Potential Dynamic of Microsimulation in Family Studies: A Review and Some Lessons for FAMSIM+. Working Paper 18-2002The Potential Dynamic of Microsimulation in Family Studies: A Review and Some Lessons for FAMSIM+. Working Paper 18-2002.
-
18
Effects from Higher Immigration on Demographic Development, Labour Supply and Pension Expenditures1st General Conference of the International Microsimulation Association.
- 19
Article and author information
Author details
Publication history
- Version of Record published: December 31, 2010 (version 1)
Copyright
© 2010, O’Donoghue et al.
This article is distributed under the terms of the Creative Commons Attribution License, which permits unrestricted use and redistribution provided that the original author and source are credited.