Simulating migration in the Pensim2 dynamic microsimulation model
- Teagasc Rural Economy Research Centre, Athenry, Co. Galway, Ireland
- Department for Work and Pensions (DWP), United Kingdom
- Teagasc Rural Economy Research Centre Athenry, United Kingdom
Cite this article
as: C. O’Donoghue, H. Redway, J. Lennon; 2010; Simulating migration in the Pensim2 dynamic microsimulation model; International Journal of Microsimulation; 3(2); 65-79.
doi: 10.34196/ijm.00039
- Article
- Figures and data
- Jump to
Figures
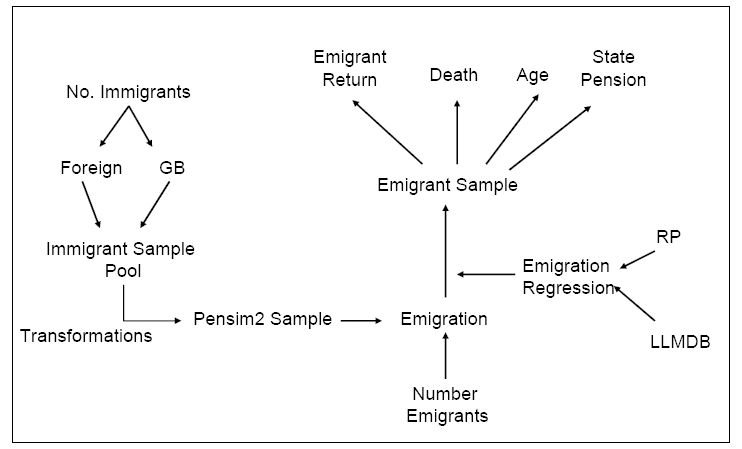
Figure 1

Migration Model Outline.
(a) with 2 supplements

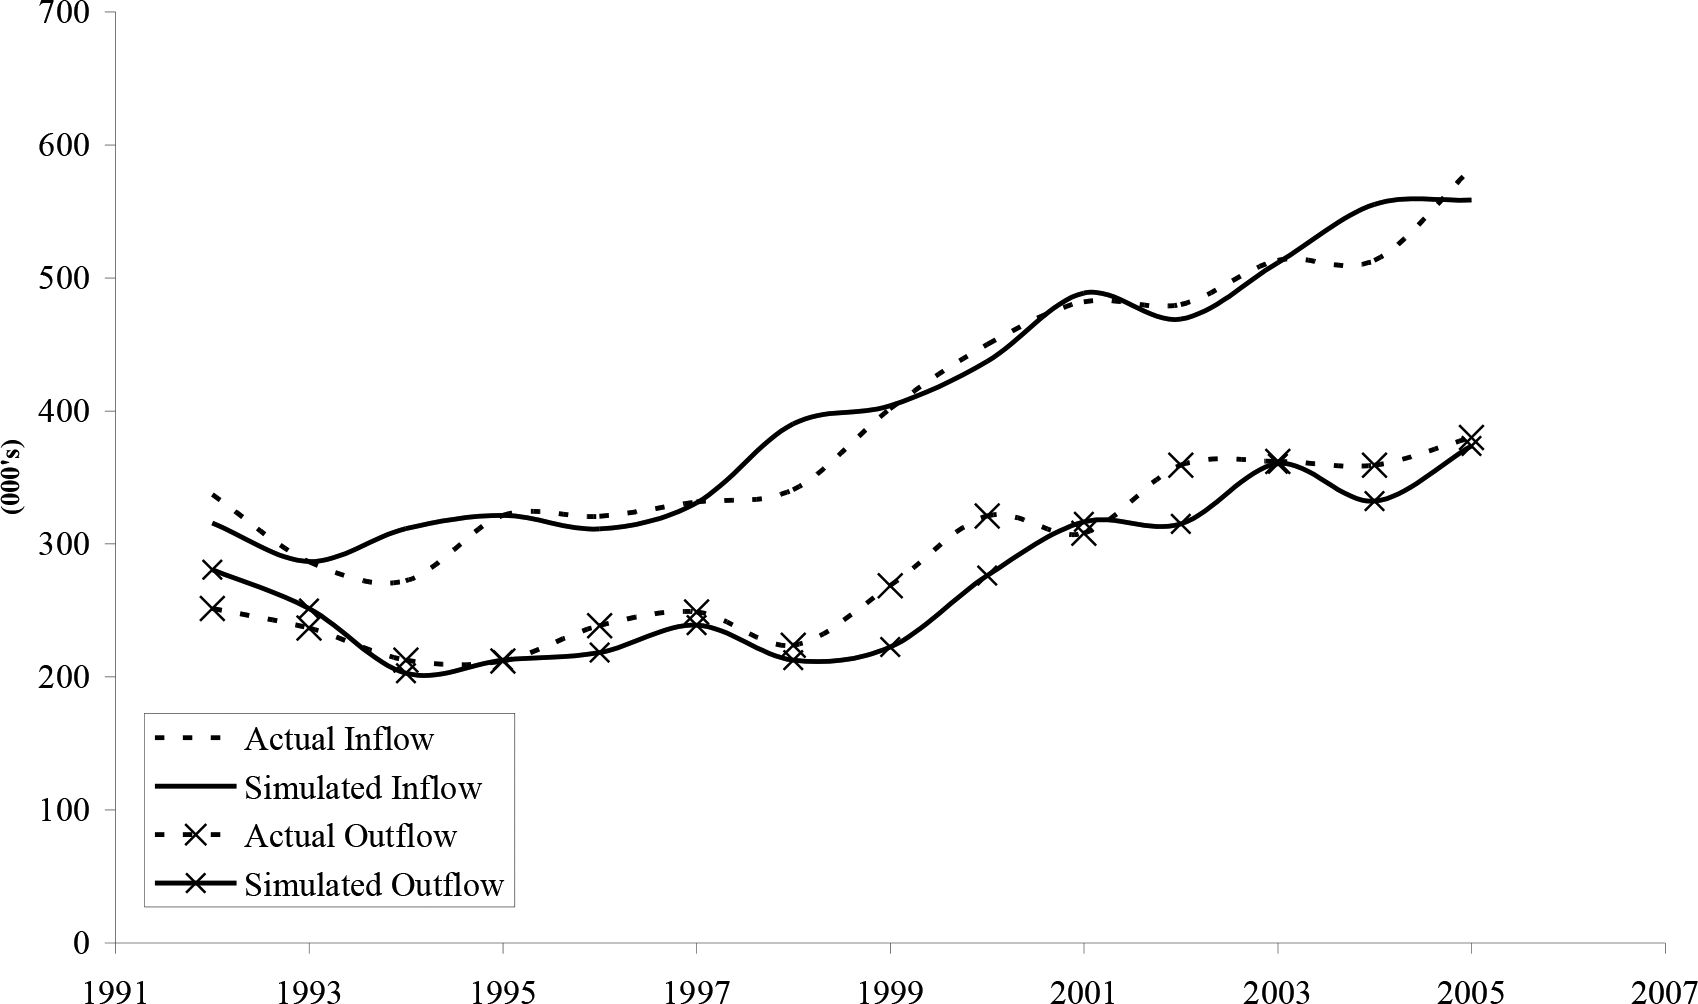
k – based upon lagged transitions (1991–2000)

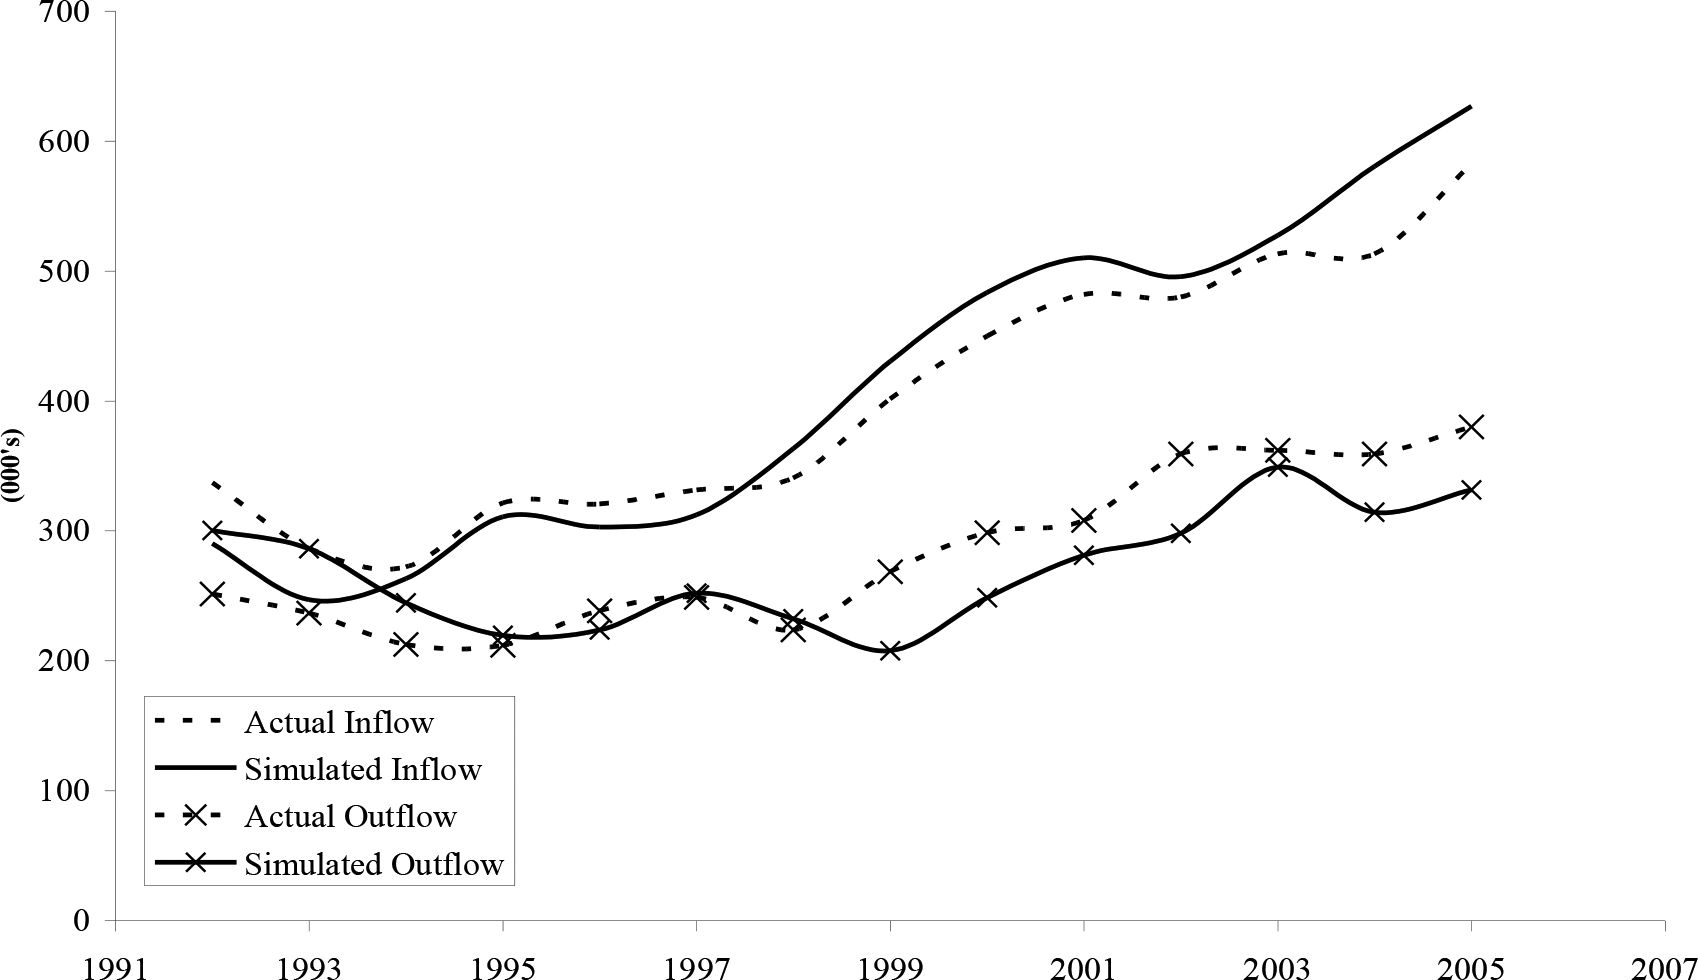
k – based upon average transitions (1991–2000)

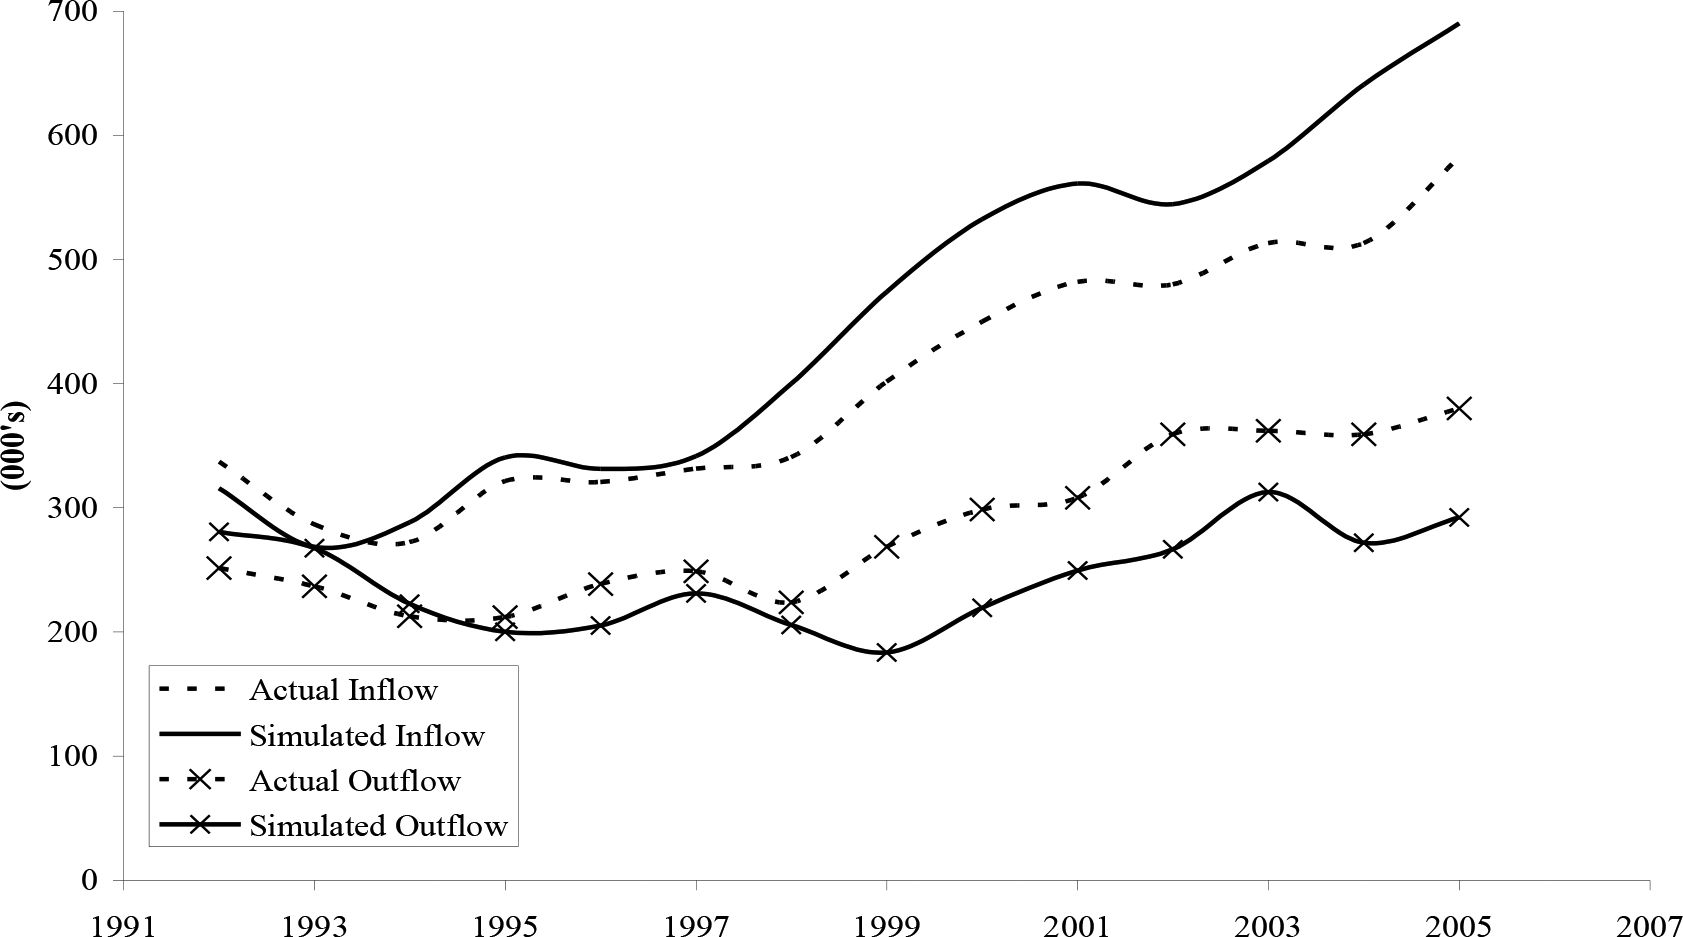
k – based upon first transition in 1991 (1991–2000)
Figure 3
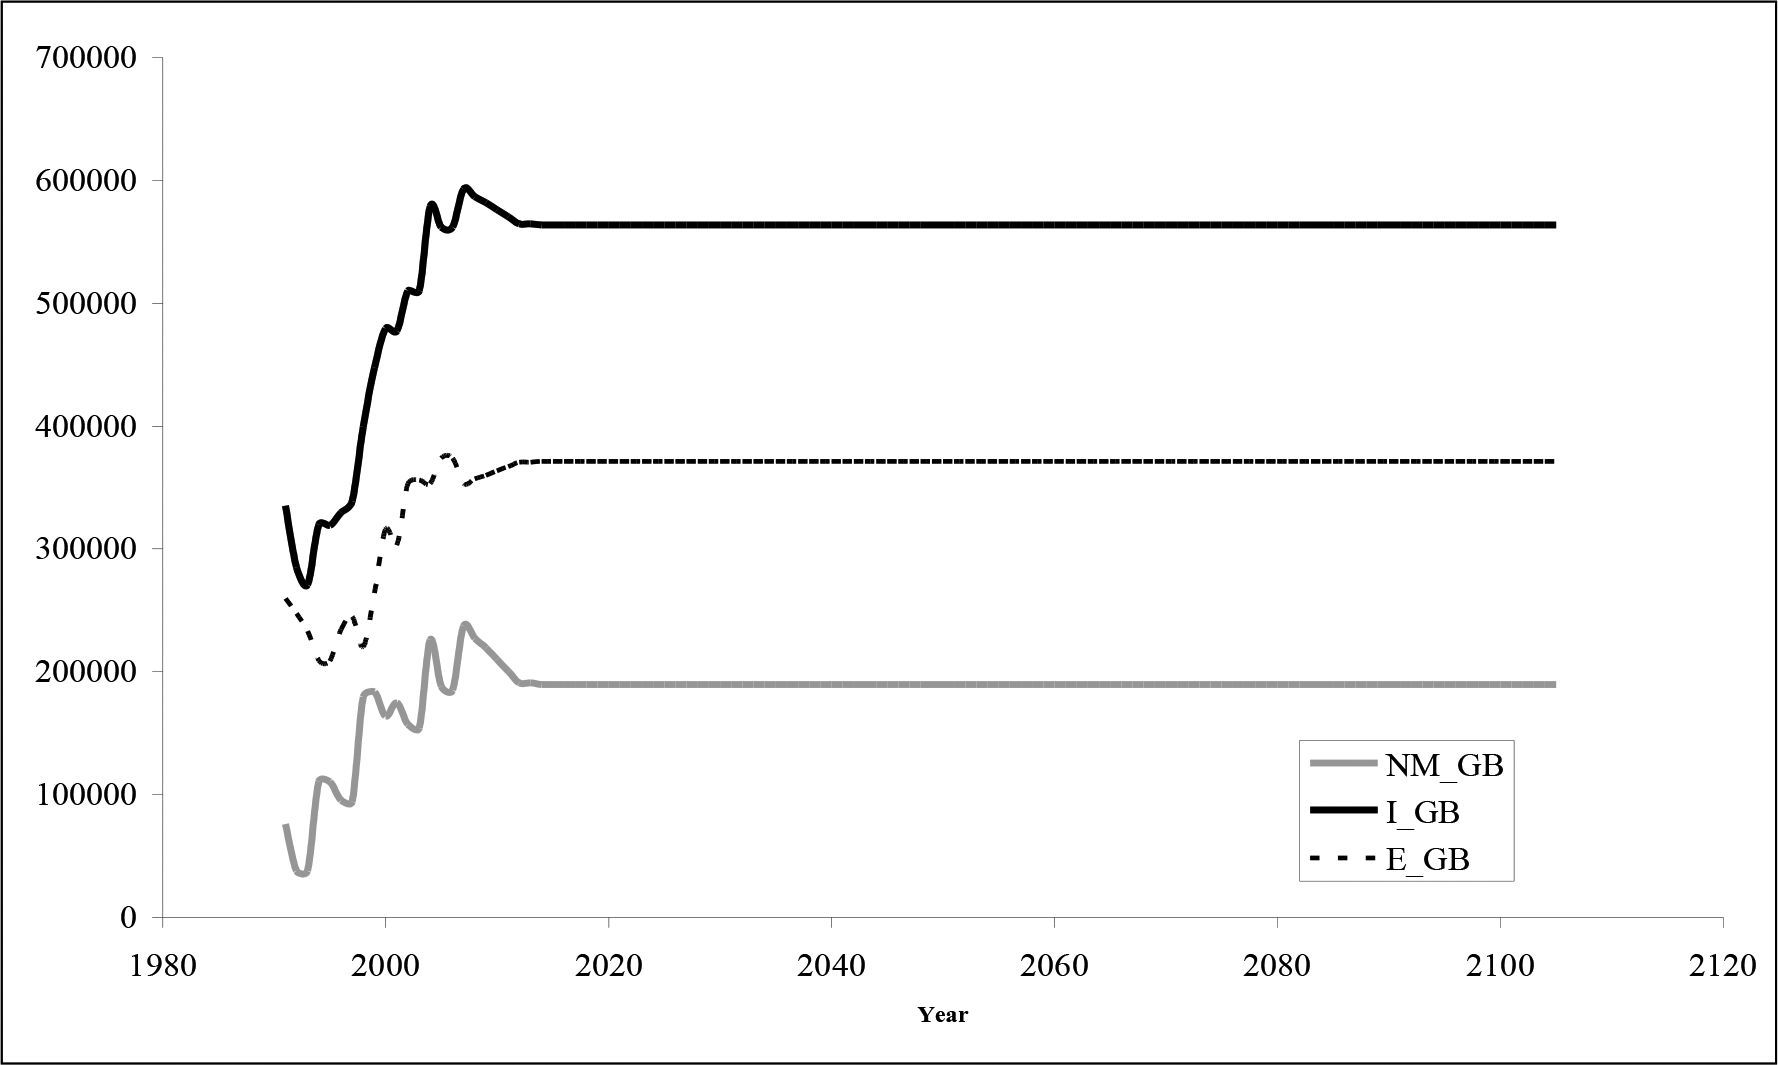

External Control Totals for Emigration and Immigration
Tables
Table 1
Migration Trends in the UK 1991–2006 (000’s).
| British | EU | Immigrants Commonwealth | Other | Total | British | EU | Emigrants Commonwealth | Other | Total | |
|---|---|---|---|---|---|---|---|---|---|---|
| 1991 | 110 | 53 | 85 | 82 | 330 | 154 | 53 | 35 | 43 | 285 |
| 1992 | 93 | 44 | 65 | 67 | 269 | 155 | 38 | 31 | 57 | 281 |
| 1993 | 86 | 44 | 70 | 65 | 265 | 149 | 40 | 34 | 43 | 266 |
| 1994 | 109 | 50 | 80 | 76 | 315 | 125 | 42 | 31 | 40 | 238 |
| 1995 | 84 | 61 | 85 | 82 | 312 | 135 | 38 | 29 | 34 | 236 |
| 1996 | 94 | 72 | 78 | 74 | 318 | 156 | 44 | 32 | 32 | 264 |
| 1997 | 90 | 71 | 90 | 76 | 327 | 149 | 53 | 40 | 37 | 279 |
| 1998 | 104 | 82 | 105 | 101 | 392 | 126 | 49 | 33 | 44 | 252 |
| 1999 | 115 | 66 | 123 | 150 | 454 | 139 | 59 | 41 | 52 | 291 |
| 2000 | 99 | 63 | 147 | 169 | 478 | 161 | 57 | 47 | 55 | 320 |
| 2001 | 110 | 57 | 149 | 164 | 480 | 158 | 49 | 51 | 49 | 307 |
| 2002 | 97 | 59 | 155 | 201 | 512 | 185 | 52 | 58 | 64 | 359 |
| 2003 | 99 | 64 | 167 | 177 | 507 | 191 | 50 | 59 | 62 | 362 |
| 2004 | 88 | 256 | 215 | 155 | 714 | 195 | 83 | 53 | 52 | 383 |
| 2005 | 96 | 295 | 180 | 137 | 708 | 185 | 108 | 60 | 59 | 412 |
| 2006 | 81 | 330 | 201 | 142 | 754 | 207 | 132 | 67 | 61 | 467 |
-
Source: ONS (2007) international migration: Migrants entering or leaving the United Kingdom and England and Wales, 2005.
Table 2
Components of migration modules used in dynamic microsimulation models internationally
| Data source | Migration flows | Emigration explanatory variables | Immigrant characteristics | Re-entry of emigrants | |
|---|---|---|---|---|---|
| APPSIM (Australia)1 | 2001 census, LSIA, overseas departure data | Immigration and Emigration | Age, sex, marital status, Australian or overseas-born | No | |
| CORSIM (USA) | Immigration statistics | Net Immigration | Age, marital status, race, sex of HOH | Age, marital status, race, sex | |
| DESTINIE (France) | 1998 Financial Assets Survey, 1999 census | Net migration only | n/a | Population projections, birth cohort distributions | No |
| DYNACAN (Canada) | Immigration and Emigration | HH process Number of Age, Number of gender and region | Age, gender, Clones existing family characteristics except CPP contributions | ||
| DYNAMOD (Australia) | 1986 census, LSIA, emigration records | Immigration (by visa status) and emigration flows, net long term migration | Age, sex, marital status, Australian or overseas-born | LSIA, cloned from census data | No |
| LIAM (Ireland) | 1986–2006 Census, 1994–1997 Labour Force Survey | Immigration and Emigration Flows | Age, Region | Quarterly National Household Survey divided into national and nonnational samples, Census | No |
| LifePaths (Canada) | 1921–1998 censuses, birth and immigration records | Immigration and emigration flows; international and interprovincial movement | Age, sex, province of residence, year, immigrant status, year of immigration | Immigration data | Yes |
| MOSART (Norway) | 1993 National Insurance data | Net migration only | n/a | General Norwegian population characteristics | No |
| NEDYMAS (Netherlan ds) | Immigration and emigration flows | Age, Year of birth, Family type, sex, marital status | Age, Year of birth, Family type, sex, marital status, year of previous emigration | ||
| Sverige (Sweden) | Immigration data from 1989–90 | Immigration and emigration flows | Age, sex, education level, previous immigration, country of origin, labour force participation, income | Immigration pool of 60 000 individuals | No |
| SESIM (Sweden) | Linda | Immigration and emigration flows | Swedish or foreign born, number of children, adults in household, highest education and oldest age in household, time since immigration | Linda | Yes |
-
Source: Pennec and Keegan (2007) and O’Donoghue (2001).
-
Note 1: APPSIM is based upon the proposed in Pennec and Keegan.
Table 3
Probit Model of Emigration
| Variable | Coefficient | p-value |
|---|---|---|
| Male | 0.085838 | |
| Age 20–29 | 1.147498 | 0 |
| Age 30–39 | 1.040151 | |
| Age 40–49 | 0.876858 | |
| Age 50–59 | 0.812458 | |
| Age 60–65 | 1.432797 | |
| Immigrant × Age 20–29 | 0.908987 | 0 |
| Immigrant × Age 30–39 | 0.656066 | |
| Immigrant × Age 40–49 | 0.545079 | |
| Immigrant × Age 50–59 | 0.574327 | |
| Immigrant × Age 60–65 | 0.732853 | |
| Immigrant | −0.0267 | 0 |
| Constant | −3.91427 | 0 |
| Sample Size | 1305652 | |
| Pseudo R2 | 0.072 | |
| Proportion Emigrate | 0.0046 |
-
Note: Year dummy variables are also included in the model
-
Data source: LLMDB (1975–2006), working age population
Table 4
Summmary Statistics Emigration
| Variable | Males | Females |
| Age | 39.4 | 37.7 |
| Immigrant | 0.104 | 0.101 |
-
Note: Year and Cohort dummy variables are also included in the model Data source: LLMDB 1975–2006, working age population
Table 5
Processes used to calculated for state pension.
| Name | Description |
|---|---|
| sp01 SetVarStatePenPe | Set Variables to PE for state pension calculation |
| sp02_SetVarStatePenPa | Set Variables to PA for state pension calculation |
| sp03_WaBspAccrual1 | Calculate the accrual of BSP/HRP rights |
| sp04_WaGrossApAccrual | Gross AP accrual |
| sp07_WaAPValue | Net AP accrual |
| sp08_ClaimStatePen | Whether individual will claim state pensions |
| sp09_AmountStatePen | Amount/Value of state pensions claimed |
Download links
A two-part list of links to download the article, or parts of the article, in various formats.