Cross-validating administrative and survey datasets through microsimulation
- CEPS/INSTEAD, Belgium
- CEPS/INSTEAD
- Inspection Générale de la Sécurité Sociale (IGSS), Luxembourg
- Article
- Figures and data
- Jump to
Figures
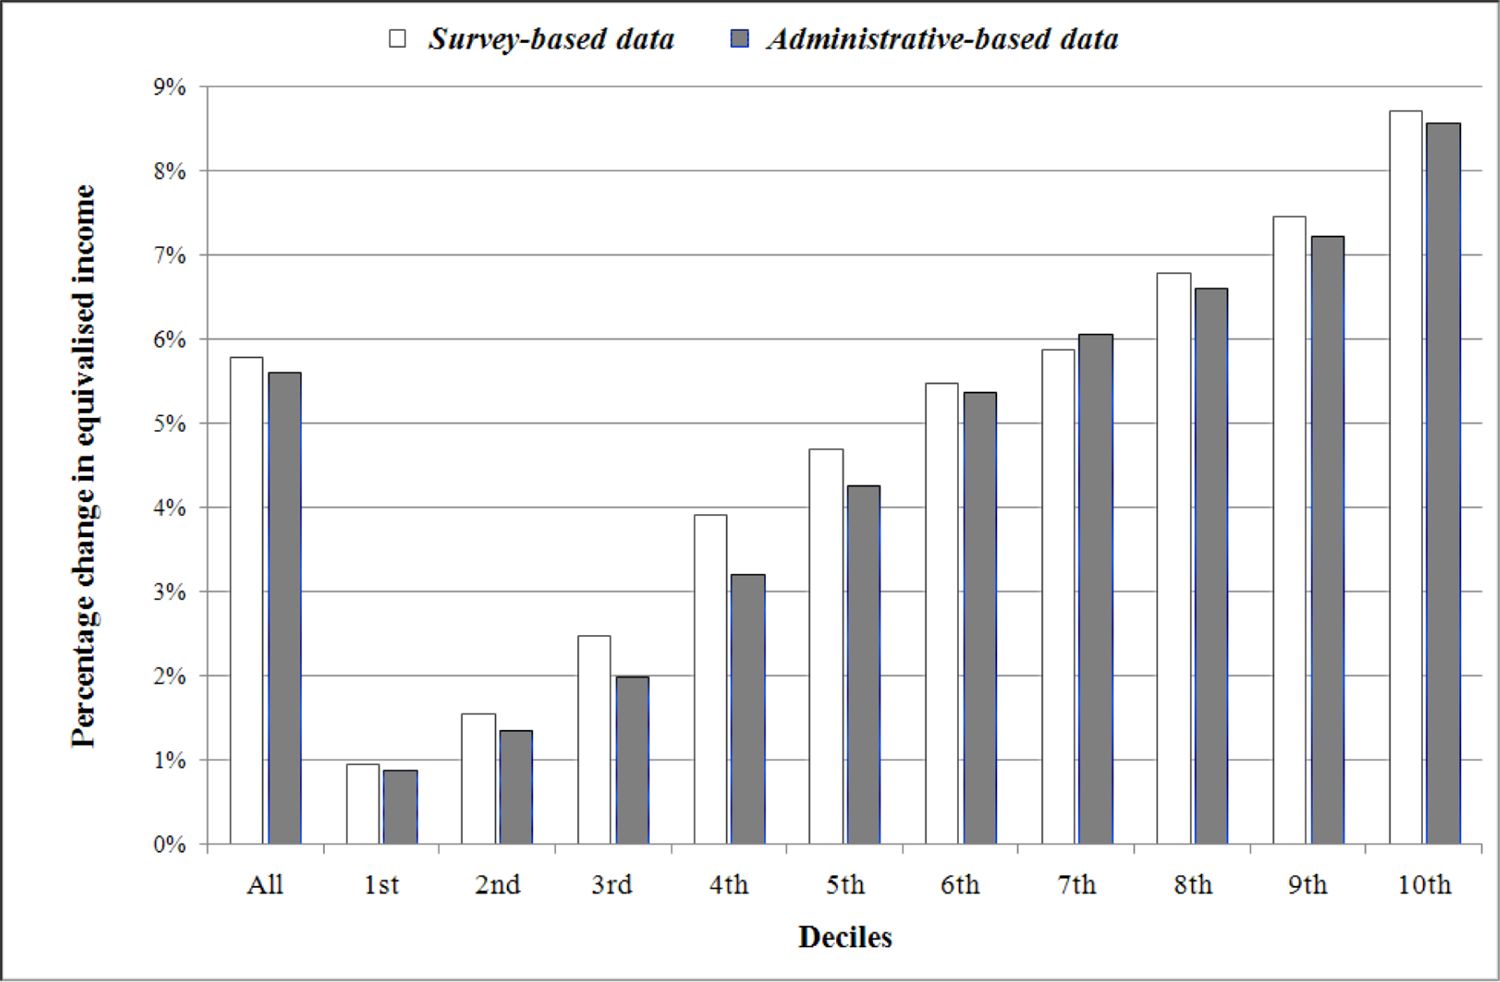
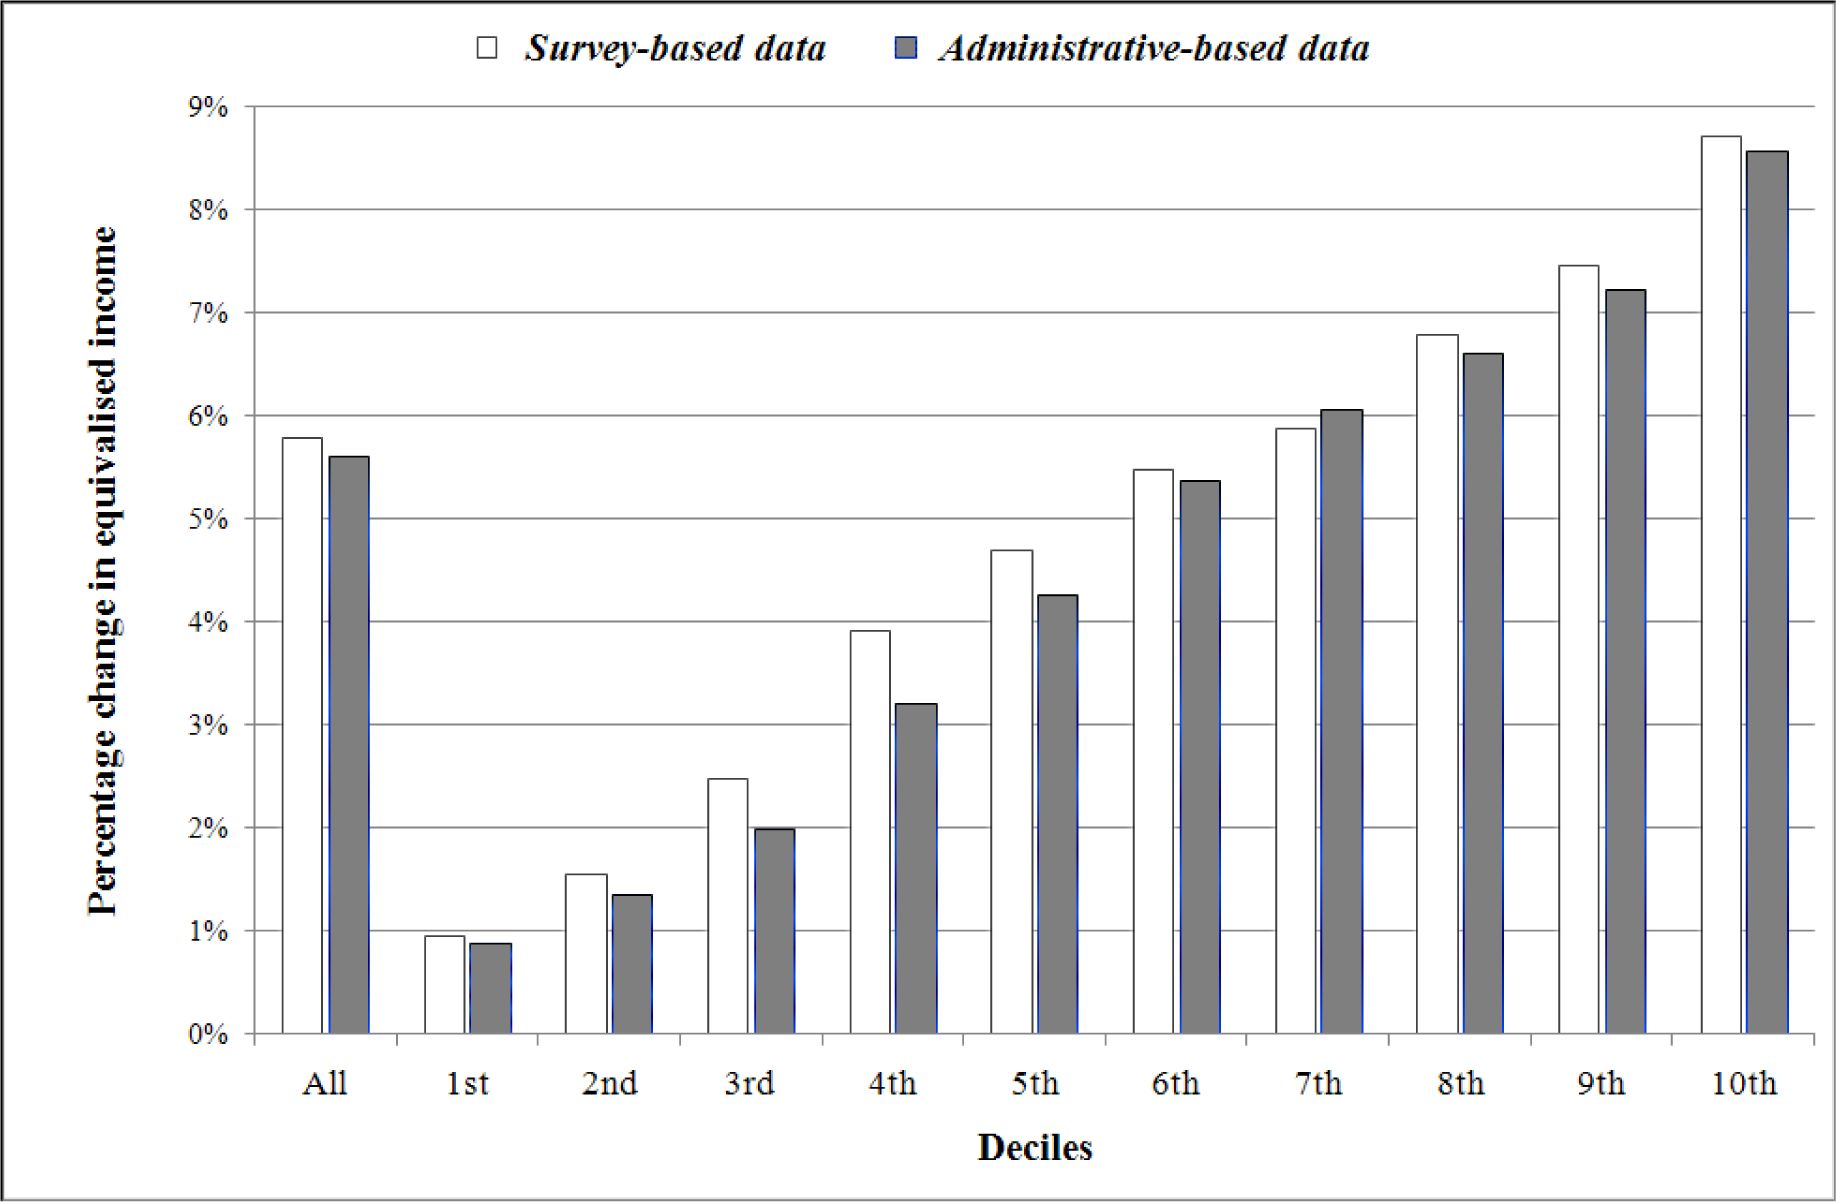
Relative change in mean equivalised income due to the tax reform, by decile (*)
Source: PSELL3/EU-SILC, 2004, Luxembourg Social Security Data Warehouse, 2003, and EUROMOD computations
(*) Deciles of equivalised income distributions are determined with and without tax reform, separately, and then compared.
Tables
Adaptation of survey and administrative datasets to enhance comparability.
| Topic | Survey-based data | Administrative-based data | Action / Remarks |
|---|---|---|---|
| Number of individuals before the adaptation process | 443,642 (weighted) | 449,025 | Some information about cross-border workers available in administrative data but not in survey data; hence initially dropped in the former, leading to 449,025 cases |
| Unit of analysis | Resident household | Fiscal household | All comparisons and actions to be based on fiscal households |
| Institutional households | Not included | Included but cannot be identified | None (**) |
| International civil servants | Included | Excluded but may happen that household’s members still within the data | (**) Administrative-based data : Drop cases (*) if a married partner announced despite absence from the data (***) Survey-based data : Drop cases (*) if a member of the household not socially insured in GDL (***) |
| Voluntarily insured | Included but cannot be identified | Included and can be identified (but earnings not reliable) | (**) Drop cases (*) in administrative-based data if a member of the household voluntarily insured |
| Capital income and private transfers | Information collected | Unknown | Variables set to ‘0’ in survey-based data |
| Income from agriculture | Information collected | Information available (but earnings not reliable) | Drop cases (*) |
| Number of individuals left after the present adaptation process | 419,030 (weighted) | 418,749 | Administrative-based data : 7% cases dropped Survey-based data : 5% cases dropped |
-
(*)
‘Drop cases’ should be understood as ‘Drop all fiscal household’s members’ if the condition is fulfilled. Dropping individuals separately (hence partially depriving households of members) would bias computations of equivalised disposable income (see infra), at-risk-of-poverty rates, and other computations that are based on (fiscal) households as a whole.
-
(**)
This decision, despite its necessity, generates some (or is unsuccessful in removing all sources of) non-comparability between datasets.
-
(***)
This is most probably due to an ‘international civil servant’ status (a proxy only). For example, as a proxy for “institutional households”.
Equivalised income and the unit of analysis.
| Household ID | Individual characteristics | Equivalised income | |||||||
|---|---|---|---|---|---|---|---|---|---|
| Resident | Fiscal | ID | Age | Status | Net earnings | Weight | Resident | Fiscal | |
| Resident | Fiscal | ||||||||
| I | A | 1 | 45 | Unmarried partner (father) | 2,110 | 1 | 1 | 1,700 | 2,110 |
| I | B | 2 | 42 | Unmarried partner (mother) | 1,800 | 0.5 | 1 | 1,700 | 1,000 |
| I | B | 3 | 20 | Child (student) | 0 | 0.5 | 0.5 | 1,700 | 1,000 |
| I | B | 4 | 13 | Child (student) | 0 | 0.3 | 0.3 | 1,700 | 1,000 |
Comparing EUROMOD datasets when unit of analysis is the HOUSEHOLD.
| Characteristics | Categories | Survey-based EUROMOD data | Administrative-based EUROMOD data (fiscal households only) | |
|---|---|---|---|---|
| Resident households | Fiscal households | |||
| Number of households | Raw data (i) | 3,296 | 4,274 | 212,578 |
| Weighted count (i) | 169,620 | 205,802 | ||
| Number of fiscal households in the resident household | 1 | 80% (ii) | Not available | Not available |
| 2 | 17% | Not available | Not available | |
| 3 or more | 2% | Not available | Not available | |
| Number of persons in the household | 1 | 30% | 47% | 50% |
| 2 | 28% | 25% | 24% | |
| 3 or 4 | 33% | 23% | 21% | |
| 5 or more | 9% | 5% | 5% | |
| Number of workers (iii) in the household | 0 | 30% | 34% | 35% |
| 1 | 40% | 48% | 47% | |
| 2 or more | 29% | 18% | 17% | |
| Type of household | Single (< 65) | 19% | 35% | 37% |
| Single (> 65) | 11% | 12% | 14% | |
| Single with dependent(s) (iv) | 7% | 6% | 5% | |
| Couple – 0 dependent | 63% | 21% | 20% | |
| Couple – 1–2 dependent(s) | 20% | 20% | ||
| Couple – 3 dependents or more | 5% | 5% | ||
| Others | Not relevant | Not relevant | ||
-
(i)
Raw data: number of surveyed households; Weighted counts: households’ weights (from PSELL3/EU-SILC survey) taken into account
-
(ii)
All results below given in % of total number of households (households’ weights taken into account)
-
(iii)
Employer, self-employed, or employee (from the employment status)
-
(iv)
Dependent: neither head of household nor partner in a couple
-
Guide to reader: 3,296 resident households’ characteristics are reported from the 2004 PSELL3/EU-SILC in the EUROMOD survey-based dataset, ‘representing’ 169,620 resident households within the population; 19% of the resident households (household weights taken into account) are composed of one person who is less than 65 years old; 17% are composed of 2 fiscal households.
Comparing EUROMOD datasets when the unit of analysis is the INDIVIDUAL: Non-monetary characteristics.
| Characteristics | Categories | Survey-based EUROMOD data | Administrative-based EUROMOD data |
|---|---|---|---|
| Number of persons | Raw data (i) | 8,657 | 418,749 |
| Weighted count (i) | 419,030 | ||
| Gender | Female | 50.7% | 50.5% |
| Male | 49.3% | 49.5% | |
| Age | Age < 18 | 22% | 22% |
| 18 <= Age < 59 | 59% | 59% | |
| Age >= 60 | 19% | 20% | |
| Type of household | Single (< 65) | 17% | 19% |
| Single (> 65) | 6% | 7% | |
| Single with dependent(s) (ii) | 7% | 6% | |
| Couple – 0 dependent | 21% | 21% | |
| Couple – 1–2 dependent(s) | 35% | 35% | |
| Couple – 3 dependents or more | 14% | 12% | |
| Number of workers (iii) in the household | 0 | 25% | 26% |
| 1 | 45% | 45% | |
| 2 or more | 30% | 29% |
-
(i)
Raw data: number of surveyed individuals; Weighted counts: individual weights (from PSELL3/EU-SILC survey) taken into account.
-
(ii)
Dependent: neither head of household nor partner in a couple.
-
(iii)
Employer, self-employed, or employee (from the employment status).
Comparing EUROMOD datasets when the unit of analysis is the INDIVIDUAL: Monetary characteristics, on average (in EUR / month).
| Monetary variables | Survey-based data | Ratio: Fiscal/Resident | Administrative- based data | ||
|---|---|---|---|---|---|
| Resident households | Fiscal households | ||||
| Primary income (excluding capital income) (mean) | 1,493 [1,416 – 1,570] |
Not relevant | 1,384 | ||
| Capital income (mean) | 78 | Not relevant | Not available in source data | ||
| Standard disposable income (excluding capital income) (mean) | 1,644 | Not relevant | 1,579 | ||
| Total household primary income (excluding capital income) (mean) | 4,489 | 3,900 | 0.913 | 3,561 | |
| Total household disposable income (excluding capital income) (mean) | 4,715 | 4,068 | 0.863 | 3,822 | |
| OECD equivalent weight (mean) | 1.96 | 1.77 | 0.903 | 1.74 | |
| OECD equivalised income | Mean | 2,444 | 2,314 | 0.947 | 2,200 |
| Median | 2,219 | 2,095 | 0.944 | 1,975 | |
| Poverty line (60% of the median) | 1,331 | 1,257 [1,237 – 1,277] | 0.944 | 1,185 | |
-
Source: PSELL3/EU-SILC, 2004, Luxembourg Social Security Data Warehouse, 2003, and EUROMOD computations
Notes:
All amounts based on the 2003 income distribution; Values in square brackets = 95 % ‘bootstrap’ confidence intervals (500 replications) calculated using STATA
Primary income = gross earnings (all sources), before employee social contributions and income taxation, excluding public pensions and social benefits (i.e. gross employment income and self-employment income + gross investment and property income + maintenance payments + gross private pension benefits + apprentice income)
Capital income = gross property income + gross investment income
Standard disposable income = primary income – employee social contributions – income taxes + social benefits in cash (Reminder: the capital income is here excluded from computations)
Total household disposable income – attributed to each member in conformity with the computation of the equivalised household income
Comparing EUROMOD datasets when the unit of analysis is the INDIVIDUAL: Inequality indicators and redistribution effects of the tax system (*)
| Inequality indicators | Survey-based EEROAIOD data | Administrative-based EUROMOD data | ||
|---|---|---|---|---|
| Without tax reform (A) | With tax reform (B) | Without tax reform (C) | With tax reform (D) | |
| Gini before tax (i) (1) |
0.297 | 0.299 | ||
| Gini after tax (ii) (2) |
0.231 | 0.245 [0.238−0.251] (iii) | 0.233 | 0.248 |
| ΔG (3) = (1) – (2) = (4) – (5) |
0.067 | 0.053 | 0.066 | 0.051 |
| Reynolds-Smolesnsky index of vertical equity (4) = (6)*((7)/1-(7)) |
0.068 | 0.054 | 0.067 | 0.052 |
| Re-ranking Index of horizontal inequity | 0.001 | 0.001 | 0.001 | 0.001 |
| Kakwani index of tax progressivity | 0.342 | 0.411 | 0.357 | 0.430 |
| Rate (iv) (7) |
0.166 | 0.115 | 0.158 | 0.108 |
| P75/P25 | 1.721 | 1.811 [1.772 − 1.850] | 1.739 | 1.823 |
| P90/P10 | 2.741 | 2.917 [2.836 − 2.998] | 2.720 | 2.907 |
| Atkinson index (inequality aversion = 0.5) |
0.042 | 0.047 [0.045 − 0.050] | 0.045 | 0.051 |
| Atkinson Index (inequality aversion = 2) |
0.151 | 0.168 [0.160 − 0.177] | 0.207 | 0.226 |
-
(*)
Based on the distribution of individual equivalised income in 2003; When applying formula, rounding effects observed sometimes
-
(i)
Based on the individual equivalised income when all taxes dropped = household total disposable income if no tax / equivalent weight of the household (see Section 2.3)
-
(ii)
Based on the individual equivalised income when all taxes included (normal case)
-
(iii)
95% STATA ‘bootstrap’ confidence intervals (500 replications)
-
(iv)
Average taxation rate, based on the distribution of equivalised income
At-risk-of-poverty rates and distribution of categorical populations over income quintiles and deciles (based on equivalised income determined through the ‘fiscal households’ framework).
| Characte-ristics | Categories | Data (*) | Share in total population | Poverty rate | Share of categorical populations between equivalised income QUINTILES (Q1-Q5), with lowest and highest DECILES (D1, D10) also mentioned (**) | ||||||
|---|---|---|---|---|---|---|---|---|---|---|---|
| D1 | Q1 | Q2 | Q3 | Q4 | Q5 | D10 | |||||
| All | Adm | 100.0% | 9.6% | 10.0% | 20.0% | 20.0% | 20.0% | 20.0% | 20.0% | 10.0% | |
| Survey | 100.0% | 11.5% | 10.1% | 20.0% | 20.0% | 20.0% | 20.0% | 20.0% | 10.0% | ||
| Gender | Female | Adm | 50.5% | 9.6% | 9.9% | 20.7% | 20.0% | 20.5% | 20.0% | 18.9% | 9.4% |
| Survey | 50.7% | 11.4% | 10.1% | 20.2% | 20.4% | 20.2% | 20.9% | 18.2% | 8.8% | ||
| Male | Adm | 49.5% | 9.7% | 10.1% | 19.3% | 20.0% | 19.5% | 20.0% | 21.1% | 10.6% | |
| Survey | 49.3% | 11.6% | 10.0% | 19.8% | 19.6% | 19.7% | 19.2% | 21.8% | 11.1% | ||
| Age | Age < 18 | Adm | 21.5% | 12.1% | 12.4% | 22.6% | 21.9% | 18.8% | 18.4% | 18.3% | 8.5% |
| Survey | 22.4% | 17.0% | 14.4% | 25.8% | 19.0% | 18.7% | 17.9% | 18.5% | 8.5% | ||
| 18 <= Age < 60 | Adm | 58.8% | 11.0% | H.6% | 20.1% | 18.4% | 17.8% | 20.0% | 23.6% | 1272% | |
| Survey | 58.9% | 12.1% | 11.1% | 19.1% | 19.0% | 18.3% | 20.5% | 23.1% | 11.6% | ||
| Age >= 60 | Adm | 19.7% | 2.7% | 247% | 16.8% | 22.6% | 27.9% | 21.6% | 11.1% | 5.1% | |
| Survey | 18.7% | 2.9% | 1.7% | 15.8% | 24.4% | 26.9% | 21.0% | 11.8% | 6.5% | ||
| Type of household | Single (< 65) | Adm | 18.6% | 13.5% | 1447% | 27.4% | 17.5% | 15.5% | 19.8% | 19.8% | 9.0% |
| Survey | 17.3% | 13.6% | 13.4% | 24.7% | 17.6% | 15.5% | 20.9% | 21.2% | 10.0% | ||
| Single (>= 65) | Adm | 6.9% | 3.5% | 3.5% | 23.4% | 14.0% | 26.6% | 27.5% | 8.4% | 3.0% | |
| Survey | 6.0% | 1.7% | 1.7% | 18.5% | 20.0% | 26.0% | 27.2% | 8.6% | 3.4% | ||
| Single with dependent(s) | Adm | 6.4% | 24.8% | 25.3% | 40.6% | 20.8% | 15.9% | 14.5% | 8.2% | 3.0% | |
| Survey | 7.5% | 26.8% | 23.6% | 41.5% | 26.3% | 10.2% | 13.0% | 9.0% | 2.1% | ||
| Couple−0 dependent | Adm | 20.8% | 3.5% | 3.6% | 11.8% | 22.0% | 23.4% | 18.8% | 24.0% | 14.2% | |
| Survey | 20.5% | 4.7% | 3.1% | 13.2% | 23.0% | 24.1% | 18.1% | 21.6% | 14.8% | ||
| Couple – 1–2 dependent(s) | Adm | 35.2% | 9.4% | 9.6% | 15.1% | 19.2% | 20.2% | 21.5% | 24.0% | H.9% | |
| Survey | 35.2% | 11.2% | 10.4% | 15.8% | 18.0% | 20.1% | 22.6% | 23.5% | 11.0% | ||
| Couple – 3 dependents or more | Adm | 12.1% | 10.2% | 10.6% | 24.0% | 25.7% | 18.9% | 16.6% | 14.7% | 6.4% | |
| Survey | 13.5% | 15.8% | 11.8% | 24.2% | 20.3% | 21.9% | 15.9% | 17.7% | 7.1% | ||
| Number of workers in the household | 0 | Adm | 26.0% | 9.4% | 9.5% | 26.2% | 23.3% | 25.1% | 18.3% | 7.1% | 2.5% |
| Survey | 24.8% | 13.6% | 11.8% | 29.2% | 24.5% | 22.7% | 17.2% | 6.5% | 3.4% | ||
| 1 | Adm | 44.7% | 11.9% | 12.6% | 22.2% | 19.8% | 18.7% | 20.3% | 19.1% | 8.8% | |
| Survey | 45.2% | 15.0% | 14.2% | 22.4% | 20.3% | 20.2% | 18.6% | 18.4% | 8.3% | ||
| 2 or more | Adm | 29.3% | 6.4% | 6.5% | 11.2% | 17.4% | 17.4% | 21.2% | 32.9% | 18.4% | |
| Survey | 30.0% | 4.5% | 2.4% | 8.8% | 15.8% | 17.4% | 24.6% | 33.4% | 17.9% | ||
-
Source: PSELL3/EU-SILC, 2004, Luxembourg Social Security Data Warehouse, 2003, and EUROMOD computations Notes:
-
(*)
‘Adm’ = Administrative-based EUROMOD input data ’Survey’ = Survey-based EUROMOD input data
-
(**)
Income deciles/quintiles as evaluated over the whole population (not the category only); the unit of analysis is the individual; income in 2003; proportions rounded to the closest percentage point: the resulting total may differ from 100%
-
Guide to reader: 20% of the ‘couples with 1 or 2 dependent(s)’ belong to the third quintile of the population equivalised income distribution
Distribution of equivalised income, in % of overall means (determined through the ‘fiscal households’ framework).
| Characteristics | Categories | Data (*) | Share of tax payers | Mean equivalised income, for the overall population (in EUR) or in % of the population average (**) | |||||||
|---|---|---|---|---|---|---|---|---|---|---|---|
| All | QUINTILES (Q1-Q5), lowest and highest DECILES (D1, D10) | ||||||||||
| D1 | Q1 | Q2 | Q3 | Q4 | Q5 | D10 | |||||
| All | Adm | 75.6% | 2,200 | 46.7% | 52.0% | 70.2% | 89.8% | 112.7% | 175.3% | 209.3% | |
| Survey | 77.1% | 2,314 | 46.3% | 51.8% | 71.6% | 90.0% | 112.5% | 174.2% | 208.1% | ||
| Gender | Female | Adm | 73.2% | 99% | 47.1% | 52.5% | 70.3% | 89.9% | 112.4% | 174.4% | 208.0% |
| Survey | 75.2% | 98% | 47.4% | 52.4% | 71.4% | 90.2% | 112.2% | 172.7% | 206.9% | ||
| Male | Adm | 78.1% | 101% | 46.3% | 51.4% | 70.2% | 89.7% | 112.9% | 176.2% | 210.5% | |
| Survey | 79.0% | 102% | 45.2% | 51.2% | 71.7% | 89.8% | 112.9% | 175.6% | 209.1% | ||
| Age | Age < 18 | Adm | 59.1% | 96% | 49.8% | 53.0% | 69.8% | 89.5% | 113.0% | 170.4% | ‘204.0% |
| Survey | 59.9% | 95% | 49.1% | 52.6% | 70.6% | 90.0% | 111.7% | 168.9% | 203.9% | ||
| 18 <= Age ̼ 60 | Adm | 78.7% | 103% | 45.4% | 50.2% | 70.0% | 89.7% | 113.3% | 175.6% | 207.4% | |
| Survey | 80.4% | 103% | 44.8% | 50.1% | 71.7% | 89.9% | 113.4% | 175.0% | 208.7% | ||
| Age >= 60 | Adm | 84.5% | 95% | 47.4% | 56.6% | 71.2% | 90.1% | 110.5% | 182.4% | 232.9% | |
| Survey | 87.2% | 95% | 49.2% | 56.7% | 72.3% | 90.4% | 110.6% | 179.4% | 211.4% | ||
| Type of household | Single (< 65) | Adm | 91.3% | 96% | 40.1% | 47.8% | 69.6% | 90.0% | 113.5% | 171.6% | 207.2% |
| Survey | 91.7% | 99% | 38.6% | 47.3% | 71.7% | 90.3% | 113.2% | 174.0% | 212.3% | ||
| Single (>= 65) | Adm | 62.0% | 92% | 47.7% | 57.6% | 70.7% | 91.0% | 110.5% | 164.4% | 205.9% | |
| Survey | 66.9% | 92% | 48.0% | 56.7% | 72.7% | 91.3% | 110.1% | 162.1% | 191.1% | ||
| Single with dependent(s) | Adm | 31.9% | 79% | 49.1% | 52.0% | 69.2% | 89.5% | 112.5% | 162.7% | 202.9% | |
| Survey | 31.5% | 78% | 47.8% | 51.9% | 70.6% | 90.8% | 112.6% | 159.7% | 213.5% | ||
| Couple – 0 dependent | Adm | 93.1% | 109% | 47.6% | 54.3% | 71.3% | 89.7% | 112.0% | 186.6% | 217.7% | |
| Survey | 92.7% | 106% | 47.6% | 55.1% | 71.7% | 89.7% | 113.2% | 187.5% | 207.9% | ||
| Couple – 1–2 dependent(s) | Adm | 74.3% | 105% | 49.2% | 52.1% | 70.4% | 89.7% | 113.0% | 172.7% | 204.4% | |
| Survey | 76.3% | 105% | 48.0% | 51.5% | 71.4% | 90.0% | 112.5% | 172.1% | 208.5% | ||
| Couple – 3 dependents or more | Adm | 56.3% | 92% | 50.1% | 53.9% | 69.5% | 89.2% | 113.0% | 171.2% | 210.9% | |
| Survey | 66.1% | 94% | 51.1% | 53.7% | 71.8% | 89.4% | 111.8% | 163.9% | 202.5% | ||
| Number of workers in the household | 0 | Adm | 78.5% | 84% | 43.1% | 52.5% | 70.7% | 89.9% | 110.4% | 157.4% | 189.3% |
| Survey | 76.8% | 83% | 40.9% | 50.9% | 72.1% | 90.2% | 110.7% | 163.5% | 186.0% | ||
| 1 | Adm | 70.0% | 98% | 47.5% | 51.5% | 69.9% | 89.8% | 113.1% | 175.0% | 214.4% | |
| Survey | 70.4% | 97% | 48.5% | 51.7% | 71.2% | 89.8% | 112.6% | 171.7% | 210.0% | ||
| 2 or more | Adm | 81.7% | 117% | 48.8% | 52.3% | 70.3% | 89.6% | 113.7% | 179.1% | 208.1% | |
| Survey | 87.4% | 119% | 48.5% | 54.7% | 71.7% | 90.4% | 113.5% | 178.0% | 210.3% | ||
-
Source: PSELL3/EU-SILC, 2004, Luxembourg Social Security Data Warehouse, 2003, and EUROMOD computations Notes :
-
(*)
‘Adm’ = Administrative-based EUROMOD input data ’Survey’ = Survey-based EUROMOD input data
-
(**)
Average income for individuals belonging to the decile/quintile as evaluated over the whole population (not the category only); the unit of analysis is the individual; income in 2003
-
Guide to reader: ’Singles less than 65 years old’ in the 1st decile benefit from a mean equivalised income of 40.1% * 2,200 EUR = 882.2 EUR / month through ‘Adm’ data