Micro simulations on the effects of ageing-related policy measures: The social affairs department of the Netherlands Ageing and Pensions Model
- VU University Amsterdam, Amsterdam
- Ministry of Social Affairs and Employment, Den Haag
Cite this article
as: J. van Sonsbeek; 2011; Micro simulations on the effects of ageing-related policy measures: The social affairs department of the Netherlands Ageing and Pensions Model; International Journal of Microsimulation; 4(1); 72-99.
doi: 10.34196/ijm.00046
- Article
- Figures and data
- Jump to
Figures
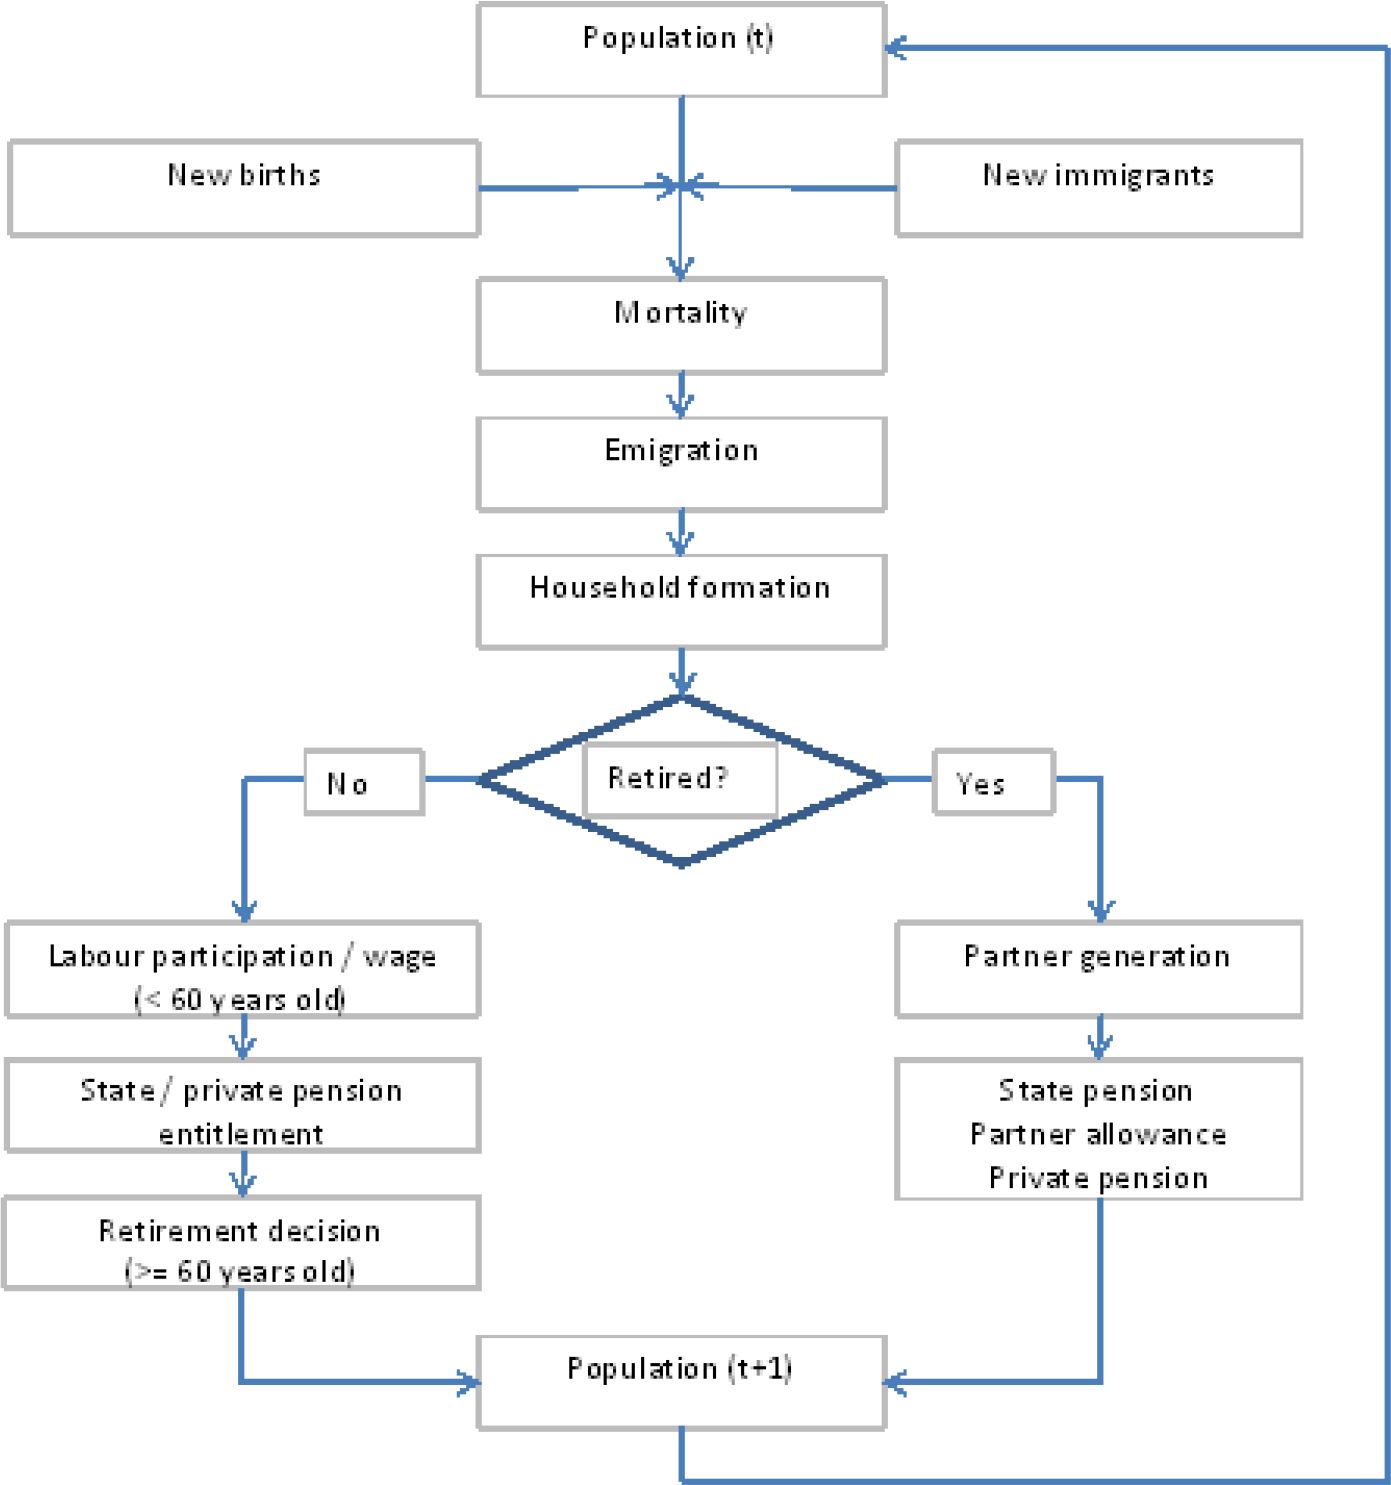
Figure 1

SADNAP model flow diagram.
Figure 2
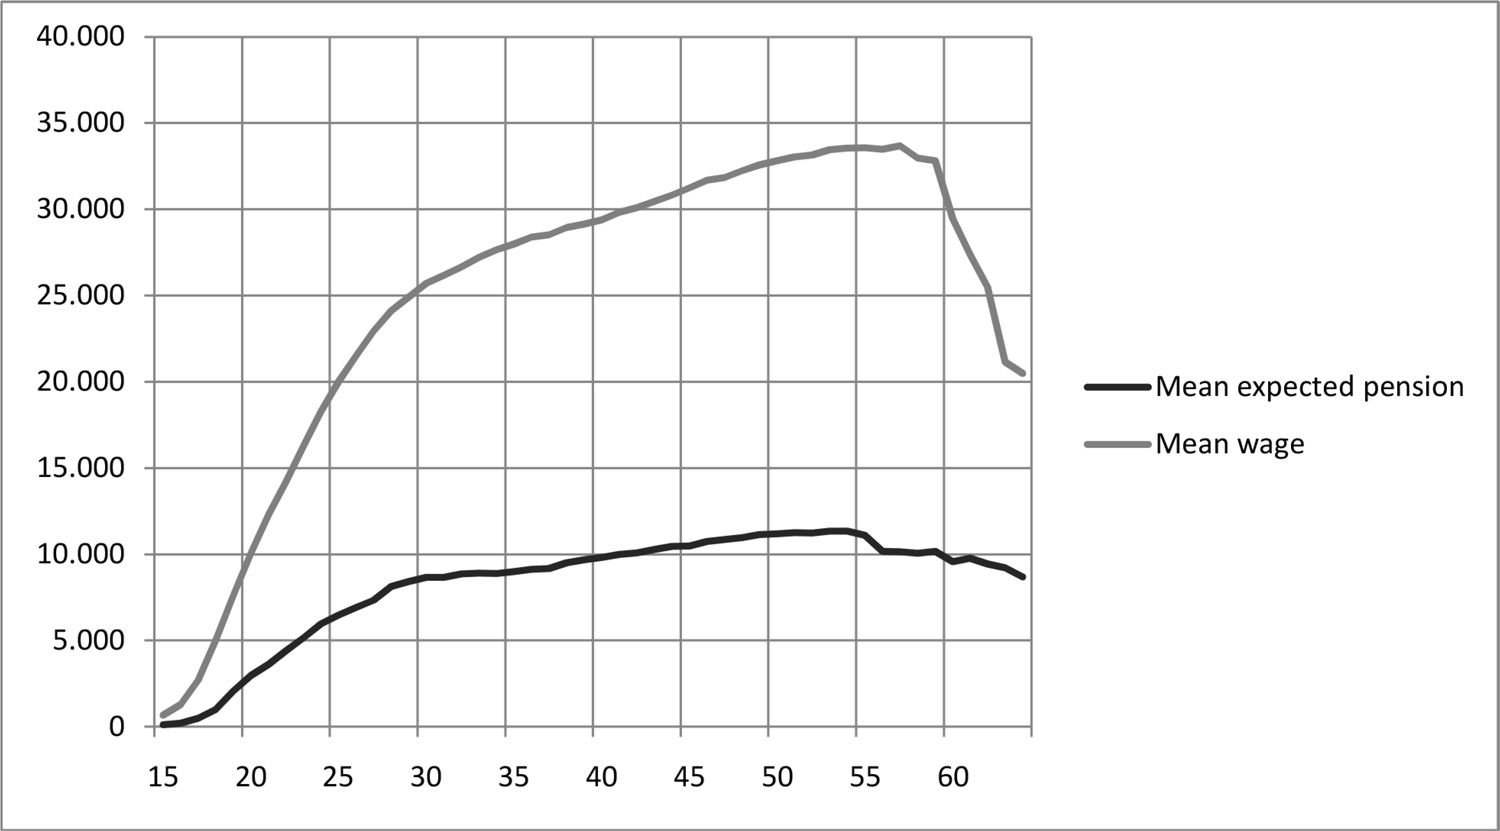
Average wage and expected second-pillar pension by age.
Figure 3
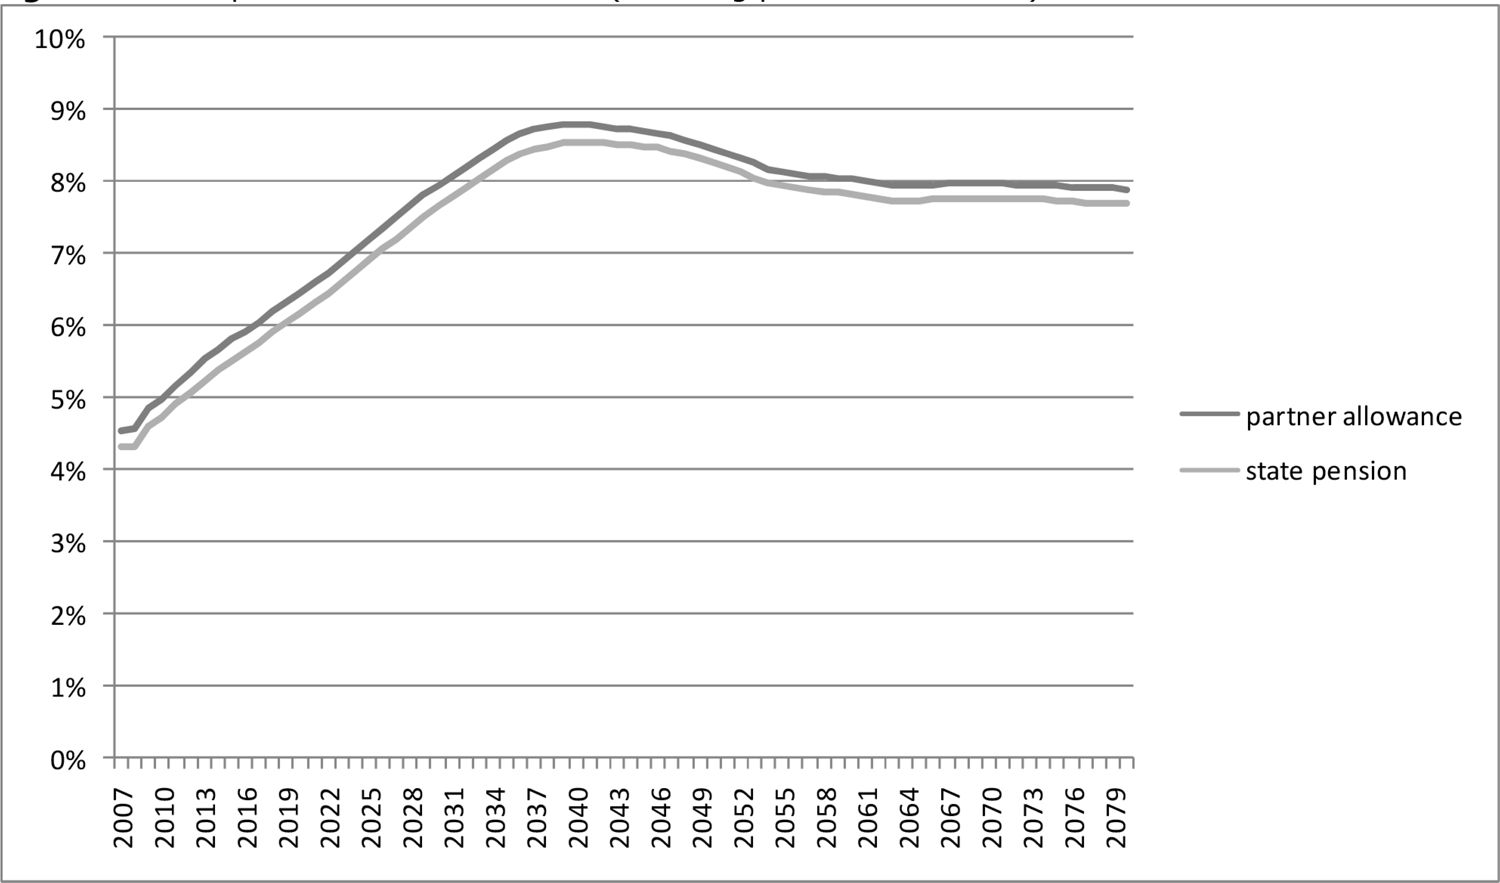
State pension cost as % of GDP (including partner allowances) 2009–2080.
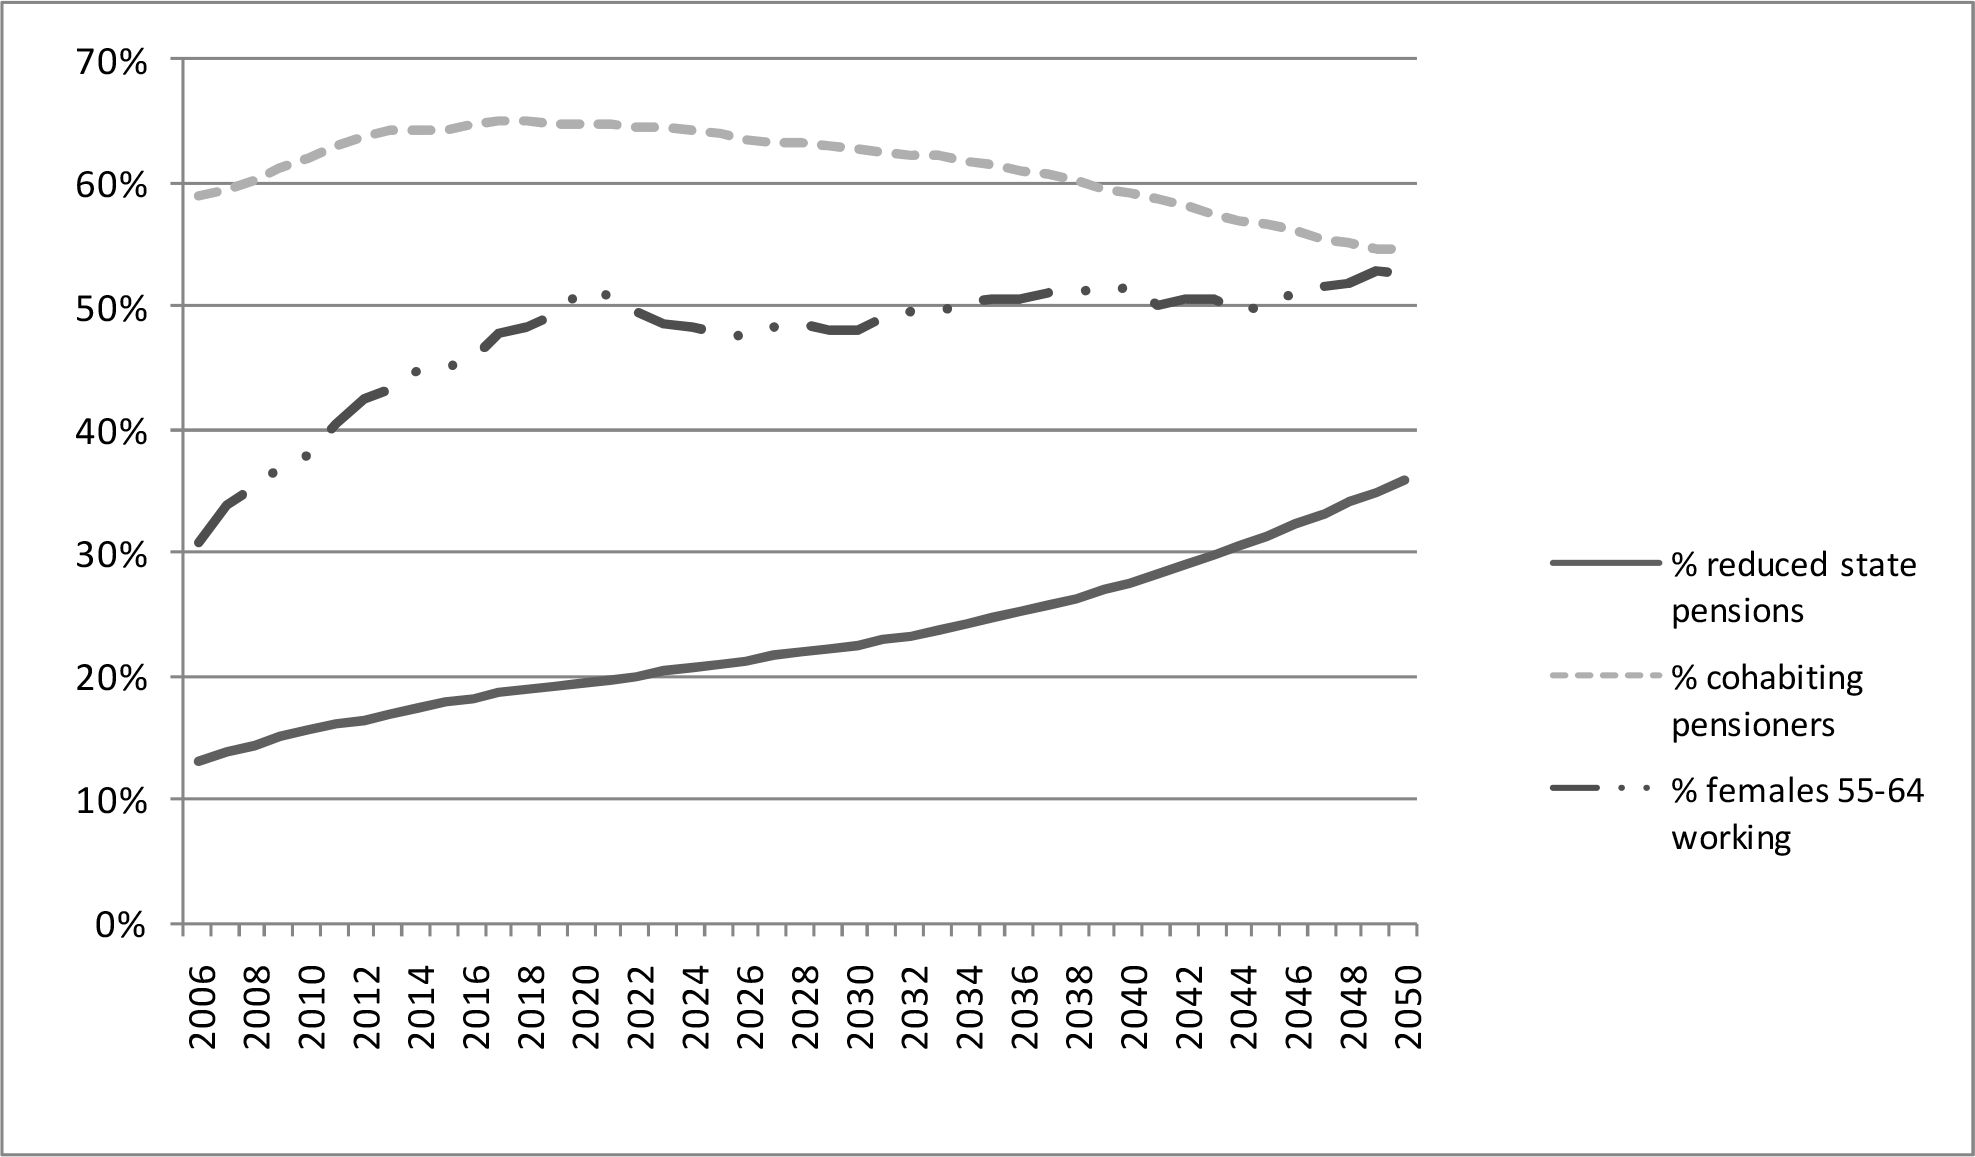
Figure 4

Changes in composition of pensioners population (2006-2050).
Figure 5
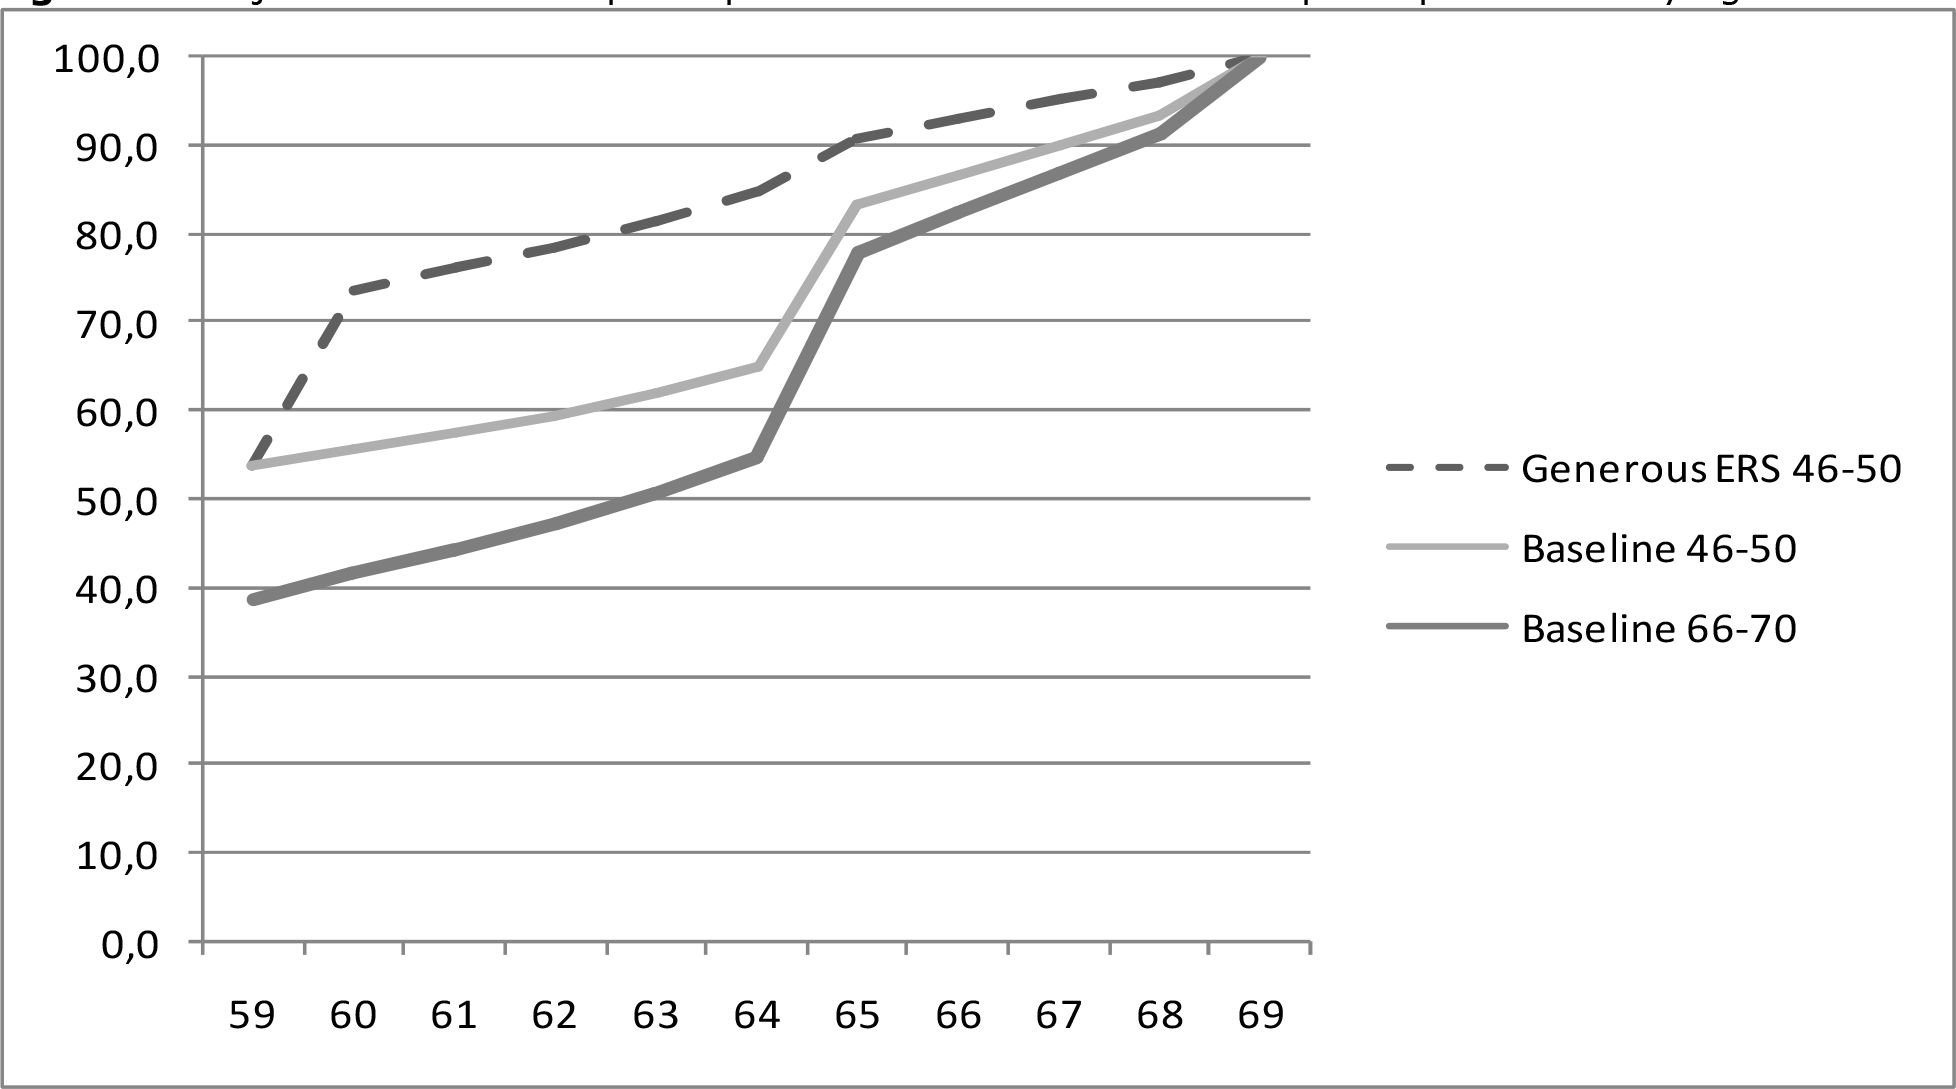

Projected rate of non-participation in the labour force non-participation rate by age.
Figure 6
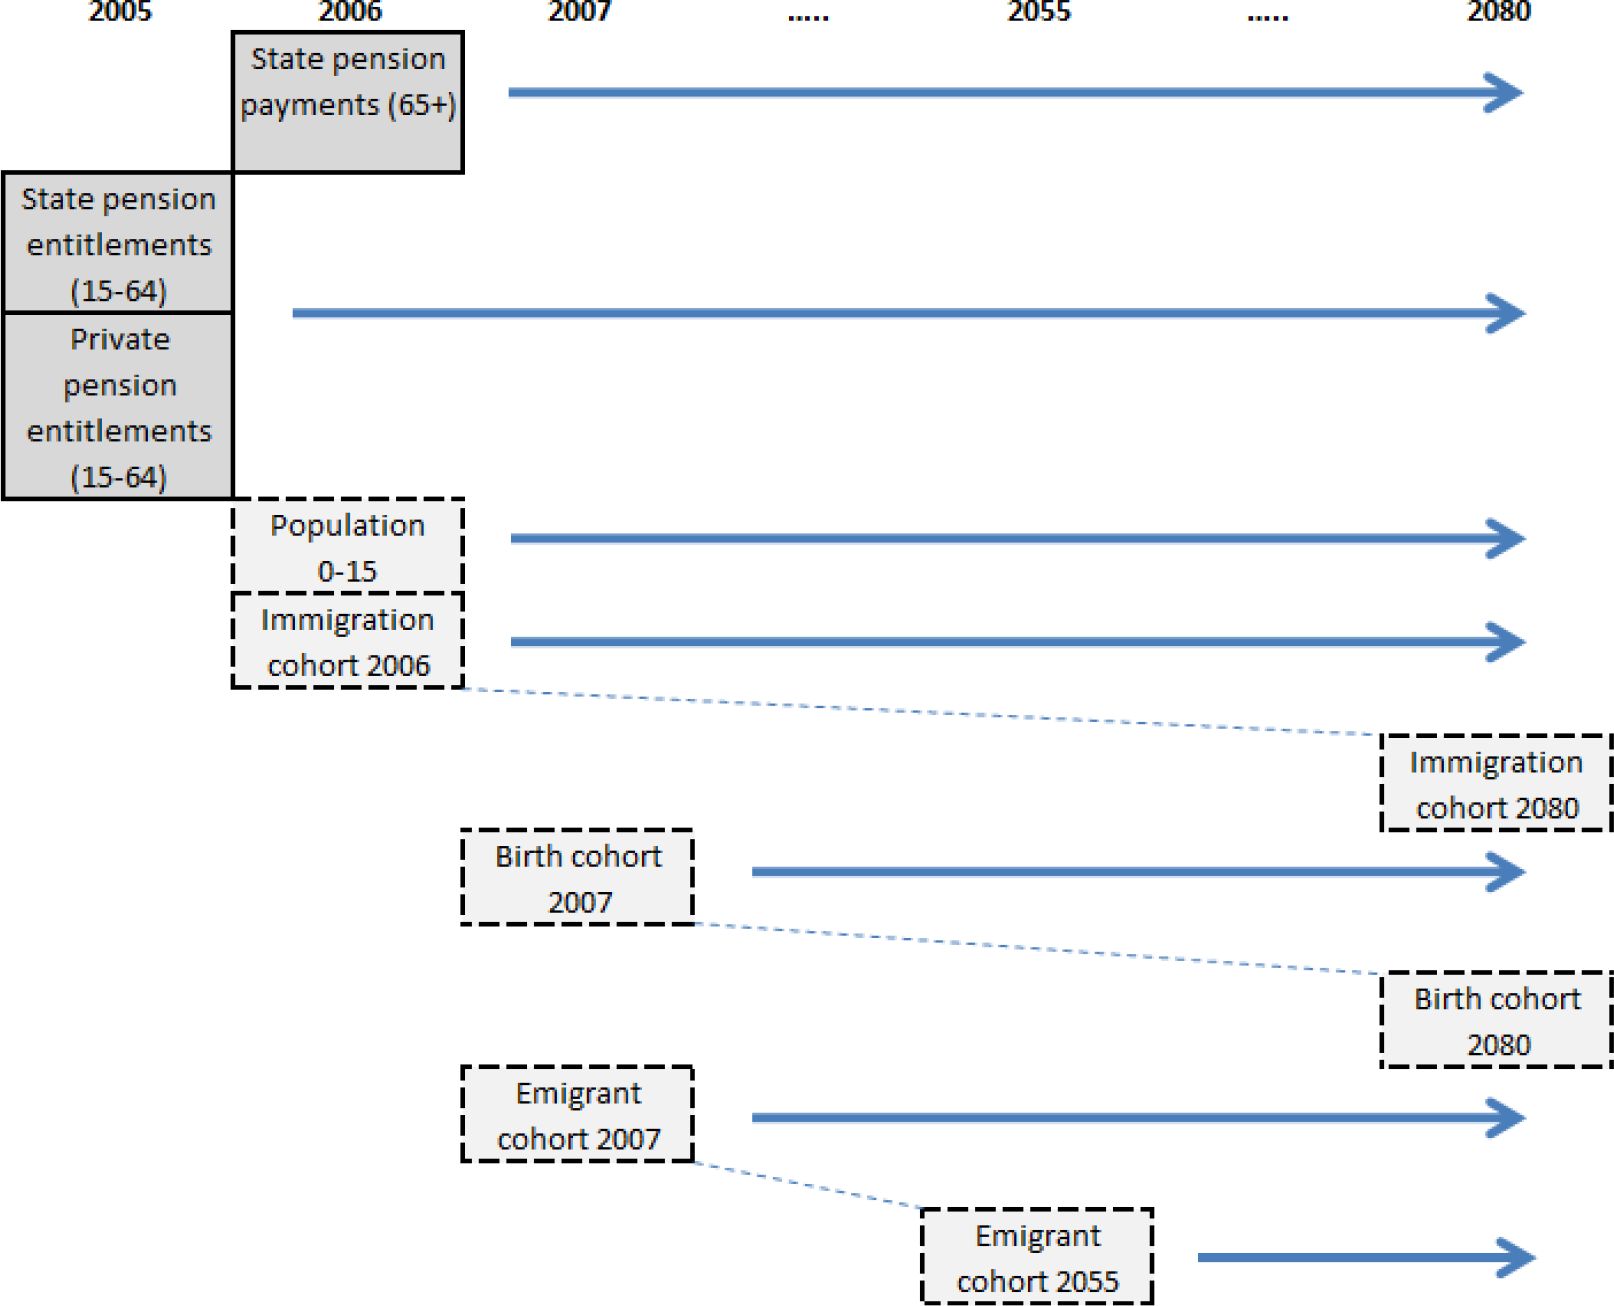

The simulation process of the population forecast.
Figure 7
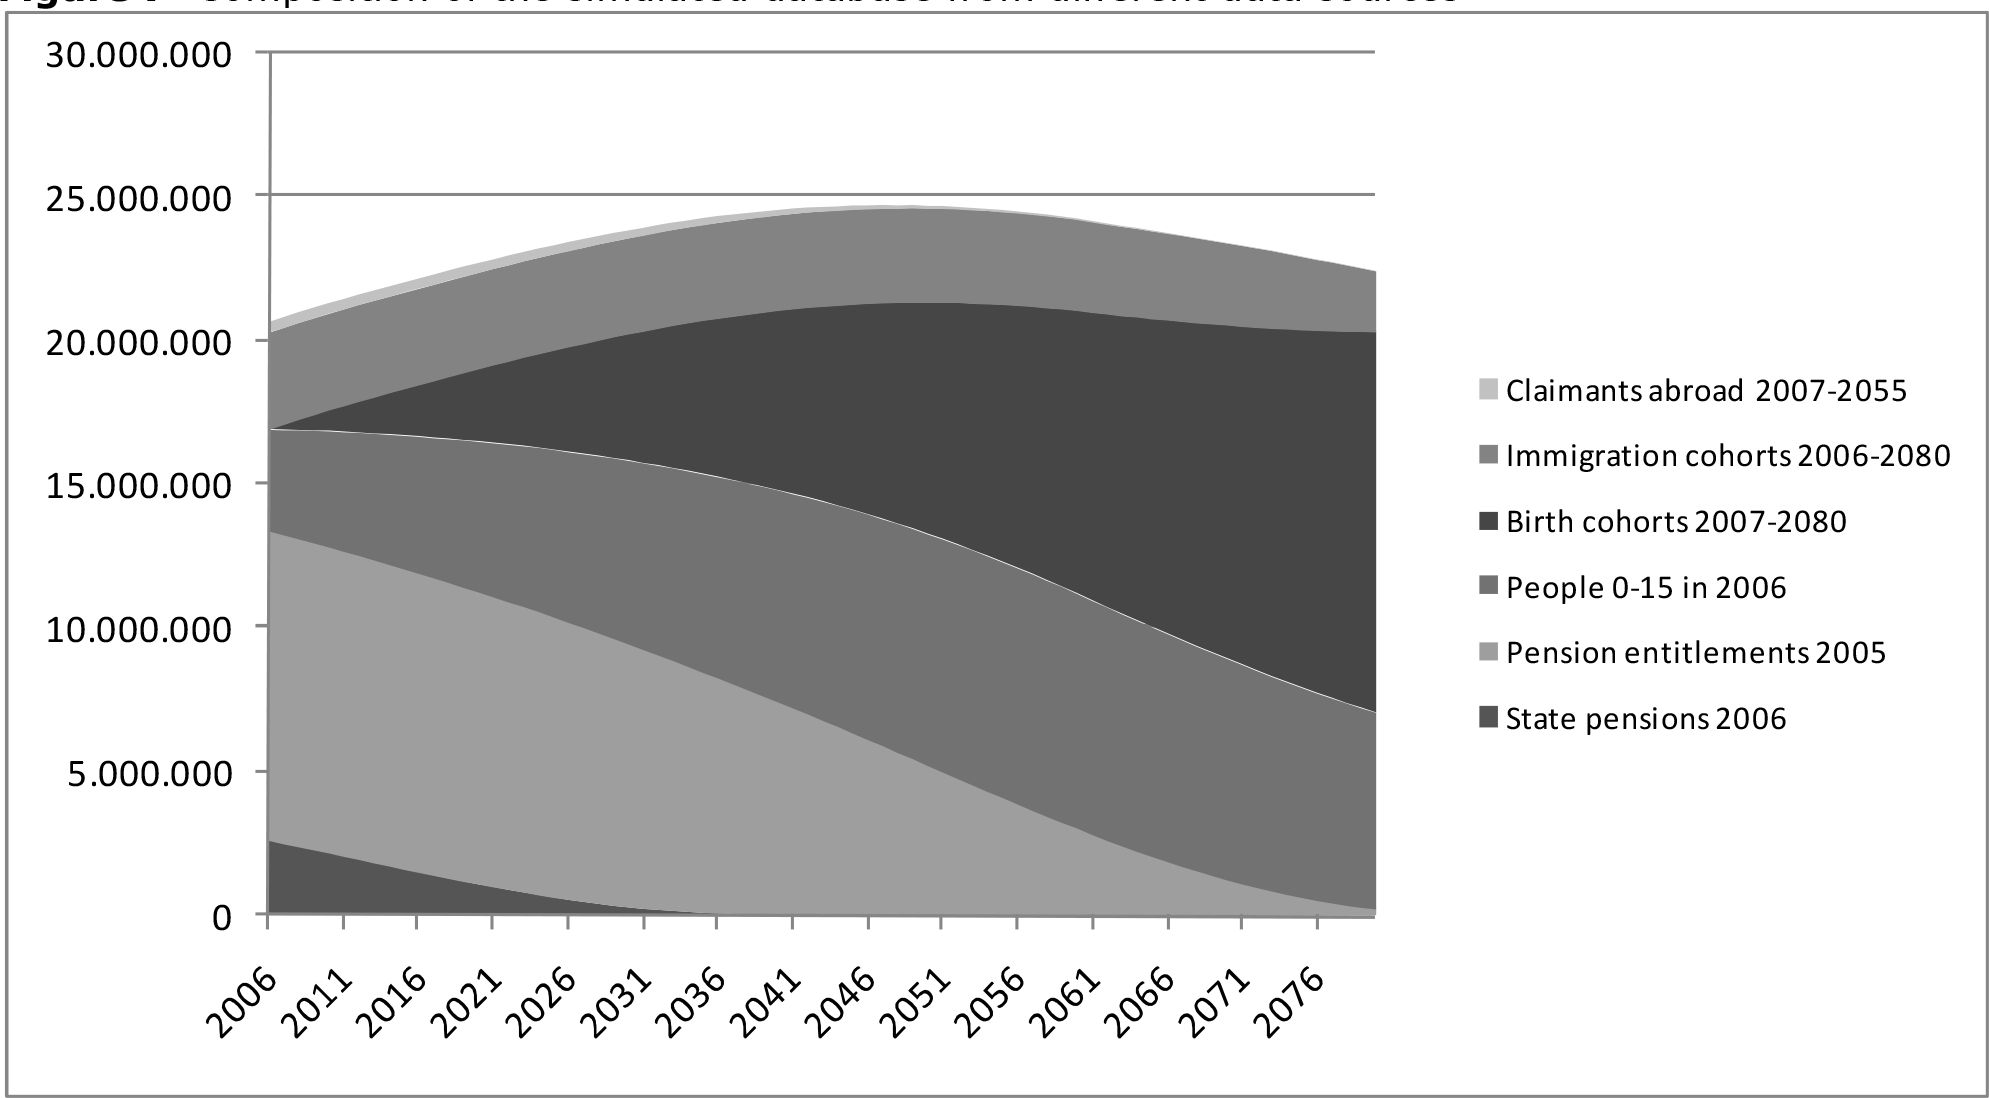

Composition of the simulated database from different data sources.
Figure 8

Composition of the 2005 population by age and participation category.
Tables
Table 1
Average life expectancies at 65 of the 2006–2045 pensioner cohorts.
| Subgroup | Average mortality age | Δ Average |
|---|---|---|
| By income | ||
| - 1st quintile | 83.5 | -2.5 |
| - 2nd quintile | 84.5 | -1.5 |
| - 3rd quintile | 85.6 | −0.4 |
| - 4th quintile | 86.8 | +0.8 |
| - 5th quintile | 88.5 | +2.5 |
| By gender | ||
| - Women | 86.9 | +0.9 |
| - Men | 85.1 | −0.9 |
| By household status | ||
| - Singles | 84.4 | −1.6 |
| - Cohabitants | 86.7 | +0.7 |
| By origin | ||
| - Natives | 86.6 | +0.6 |
| - Immigrants | 84.0 | −2.0 |
| Total | 86.0 |
Table 2
Option value parameters.
| Parameter | Mean value | Distribution |
|---|---|---|
| − κ (leisure preference) | 2.0 | U (1, 3) |
| − ρ (time preference) | 0.17 | 0 U(0, 0.05) U(0.05, 0.1) U(0.1, 0.2) U(0.2, 1.0) |
| − γ (risk aversion) | 0.7 | U(0.5, 0.9) |
| − τ (expected wage decrease after age 60) | 0.045 | U(0, 0.09) |
Table 3
Share of lifetime state pension income compared to share of state pension cohorts.
| Subgroup | Share of cohorts turning 65 | Share of lifetime pension costs | Ratio |
|---|---|---|---|
| By income | |||
| - 1st quintile | 19.4% | 15.4% | 0.79 |
| - 2nd quintile | 19.8% | 18.5% | 0.93 |
| - 3rd quintile | 20.0% | 19.4% | 0.97 |
| - 4th quintile | 20.3% | 21.8% | 1.08 |
| - 5th quintile | 20.5% | 24.9% | 1.21 |
| By gender | |||
| - Women | 49.4% | 52.6% | 1.06 |
| - Men | 50.6% | 47.4% | 0.94 |
| By household status | |||
| - Singles | 30.6% | 34.0% | 1.11 |
| - Cohabitants | 69.4% | 66.0% | 0.95 |
| By origin | |||
| - Natives | 73.5% | 82.4% | 1.12 |
| - Immigrants | 26.5% | 17.6% | 0.66 |
Table 4
Characteristics of retirees by retirement age (birth cohorts 1946–1970).
| Retirement age | Share of population retiring | Time preference | Leisure preference | Risk aversion | Wage decrease | Share of disability |
|---|---|---|---|---|---|---|
| ≤ 59 | 0.427 | |||||
| 60 | 0.029 | 0.26 | 2.15 | 0.70 | 0.046 | 0.14 |
| 61 | 0.025 | 0.21 | 2.07 | 0.70 | 0.046 | 0.16 |
| 62 | 0.027 | 0.20 | 2.04 | 0.70 | 0.046 | 0.17 |
| 63 | 0.035 | 0.21 | 2.04 | 0.70 | 0.047 | 0.14 |
| 64 | 0.036 | 0.21 | 2.07 | 0.70 | 0.048 | 0.18 |
| 65 | 0.217 | 0.20 | 2.05 | 0.69 | 0.046 | 0.03 |
| 66 | 0.043 | 0.14 | 1.97 | 0.70 | 0.046 | 0.14 |
| 67 | 0.042 | 0.13 | 1.97 | 0.71 | 0.046 | 0.15 |
| 68 | 0.040 | 0.12 | 1.94 | 0.71 | 0.045 | 0.14 |
| 69 | 0.080 | 0.08 | 1.81 | 0.73 | 0.039 | 0.06 |
Table 5
Overview of key SADNAP results compared to other models.
| Indicator | Year | SADNAP estimate | Comparable estimate | By |
|---|---|---|---|---|
| Grey pressure | 2040 | 49% | 49% | CBS |
| State pension expenses | 2040 | 9.6% | 8.8% | CPB based on 2004 population projection, would be 9.9% based on 2008 population projection |
| Number of state pensions | 2024 | 4.132 mln | 4.125 mln | SVB 2009–2024 projection |
| Expected replacement rate when retiring | All | 0.73 | 0.73 0.64 | CBS Euwals, de Mooij, van Vuuren (2009) |
| Gini coefficient | 2040 | 0.29 | 0.23 | Knoef et al. on household income (SADNAP estimate on individual income) |
| Retirement age | 2007 | 61.9 | 61.7 | Adviescommissie Arbeidparticipatie (2008) |
| Retirement age increase (compared to generous ERS) | 2015 | 2.5 | 4 / 0 2 – 2.5 | De Vos and Kapteyn for men / women Euwals, de Mooij, van Vuuren (2009) |
Table 6
Some characteristics of the two main data sources on state pensions.
| SVB file 2006 (65+) | CBS entitlement file 2005 (15-64) | |||
|---|---|---|---|---|
| Number | % | Number | % | |
| Gender | ||||
| - Male | 1,130,506 | 43.5 | 5,563,649 | 50.5 |
| - Female | 1,469,568 | 56.5 | 5,458,248 | 49.5 |
| Origin | ||||
| - Native6 | 9,656,948 | 87.6 | ||
| - Immigrant (1st gen) | 1,364,949 | 12.4 | ||
| Household status | ||||
| - Single | 2,667,713 | 24.2 | ||
| - Cohabiting | 8,337,017 | 75.8 | ||
| State pension entitlement | ||||
| - Complete | 2,200,342 | 84.6 | 9,443,153 | 85.7 |
| - Reduced | 399,802 | 15.4 | 1,572,768 | 14.3 |
| Country of residence | ||||
| - Netherlands | 2,364,891 | 91.0 | ||
| - Abroad | 235,183 | 9.0 | ||
| Total | 2,600,074 | 100.0 | 11,021,897 | 100.0 |
Table 7
Some characteristics of the main data source on company pensions.
| State pension entitlements | Private pension entitlements | |||
|---|---|---|---|---|
| Number | % | Number | % | |
| Gender | ||||
| - Male | 5,563,649 | 50.5 | 3,151,280 | 54.2 |
| - Female | 5,458,248 | 49.5 | 2,664,918 | 45.8 |
| Origin | ||||
| - Native | 9,656,948 | 87.6 | 5,288,526 | 90.9 |
| - Immigrant (1st gen) | 1,364,949 | 12.4 | 527,672 | 9.1 |
| Household status | ||||
| - Single | 2,667,713 | 24.2 | 1,325,328 | 22.8 |
| - Cohabiting | 8,337,017 | 75.8 | 4,484,873 | 77.2 |
| State pension entitlement | ||||
| - Complete | 9,443,153 | 85.7 | 5,074,905 | 87.3 |
| - Reduced | 1,572,768 | 14.3 | 739,206 | 12.7 |
| Participation status | ||||
| - Study | 1,207,782 | 11.0 | 128,824 | 2.2 |
| - Work | 6,916,620 | 62.9 | 4,474,776 | 76.9 |
| - Benefit | 1,320,852 | 12.0 | 644,887 | 11.1 |
| - None | 1,217,069 | 11.1 | 318,848 | 5.5 |
| - (Early) retired | 342,141 | 3.1 | 246,483 | 4.2 |
| Total | 11,021,897 | 100.0 | 5,816,198 | 100.0 |
Table 8
Expected private pension by main subgroups.
| Wage (mean) | Expected private pension (mean) | Expected replacement rate (median) | |
|---|---|---|---|
| Age-category | |||
| - 15-19 | € 12,546 | € 3,740 | 1.283 |
| - 20-24 | € 20,605 | € 7,005 | 0.857 |
| - 25-29 | € 25,580 | € 9,128 | 0.779 |
| - 30-34 | € 28,623 | € 10,445 | 0.754 |
| - 35-39 | € 30,294 | € 11,323 | 0.747 |
| - 40-44 | € 31,855 | € 12,194 | 0.729 |
| - 45-49 | € 33,582 | € 13,020 | 0.702 |
| - 50-54 | € 34,911 | € 13,668 | 0.675 |
| - 55-59 | € 36,016 | € 12,460 | 0.638 |
| - 60-64 | € 36,594 | € 10,335 | 0.575 |
| Gender | |||
| - Male | € 37,892 | € 13,965 | 0.644 |
| - Female | € 21,984 | € 8,275 | 0.839 |
| Origin | |||
| - Native | € 31,008 | € 11,714 | 0.743 |
| - Immigrant | € 27,282 | € 7,791 | 0.607 |
| Household status | |||
| - Single | € 28,989 | € 9,952 | 0.761 |
| - Cohabiting | € 31,147 | € 11,767 | 0.725 |
| State pension entitlement | |||
| - Complete | € 30,536 | € 11,628 | 0.751 |
| - Reduced | € 32,062 | € 9,484 | 0.576 |
| All | € 30,703 | € 11,394 | 0.732 |
Table 9
presents an overview of the macro data sources used.
| Age | Gender | Ethnicity | Household status | Participatio n status | Income | |
|---|---|---|---|---|---|---|
| Birth cohorts | n/a | E | E | n/a | n/a | n/a |
| Immigrant cohorts | E | E | E | - | - | - |
| Mortality rates | E | E | I | I | - | I |
| Emigration rates | E | E | E | - | - | - |
| Cohabiting rates | E | E | - | n/a | - | - |
| Participation rates | E | E | - | - | n/a | - |
| Benefit rates | E | E | - | - | E | - |
Download links
A two-part list of links to download the article, or parts of the article, in various formats.