Microsimulation of indirect taxes
Cite this article
as: A. Decoster, J. Loughrey, C. O'Donoghue, D. Verwerft; 2011; Microsimulation of indirect taxes; International Journal of Microsimulation; 4(2); 41-56.
doi: 10.34196/ijm.00052
- Article
- Figures and data
- Jump to
Figures
Figure 1
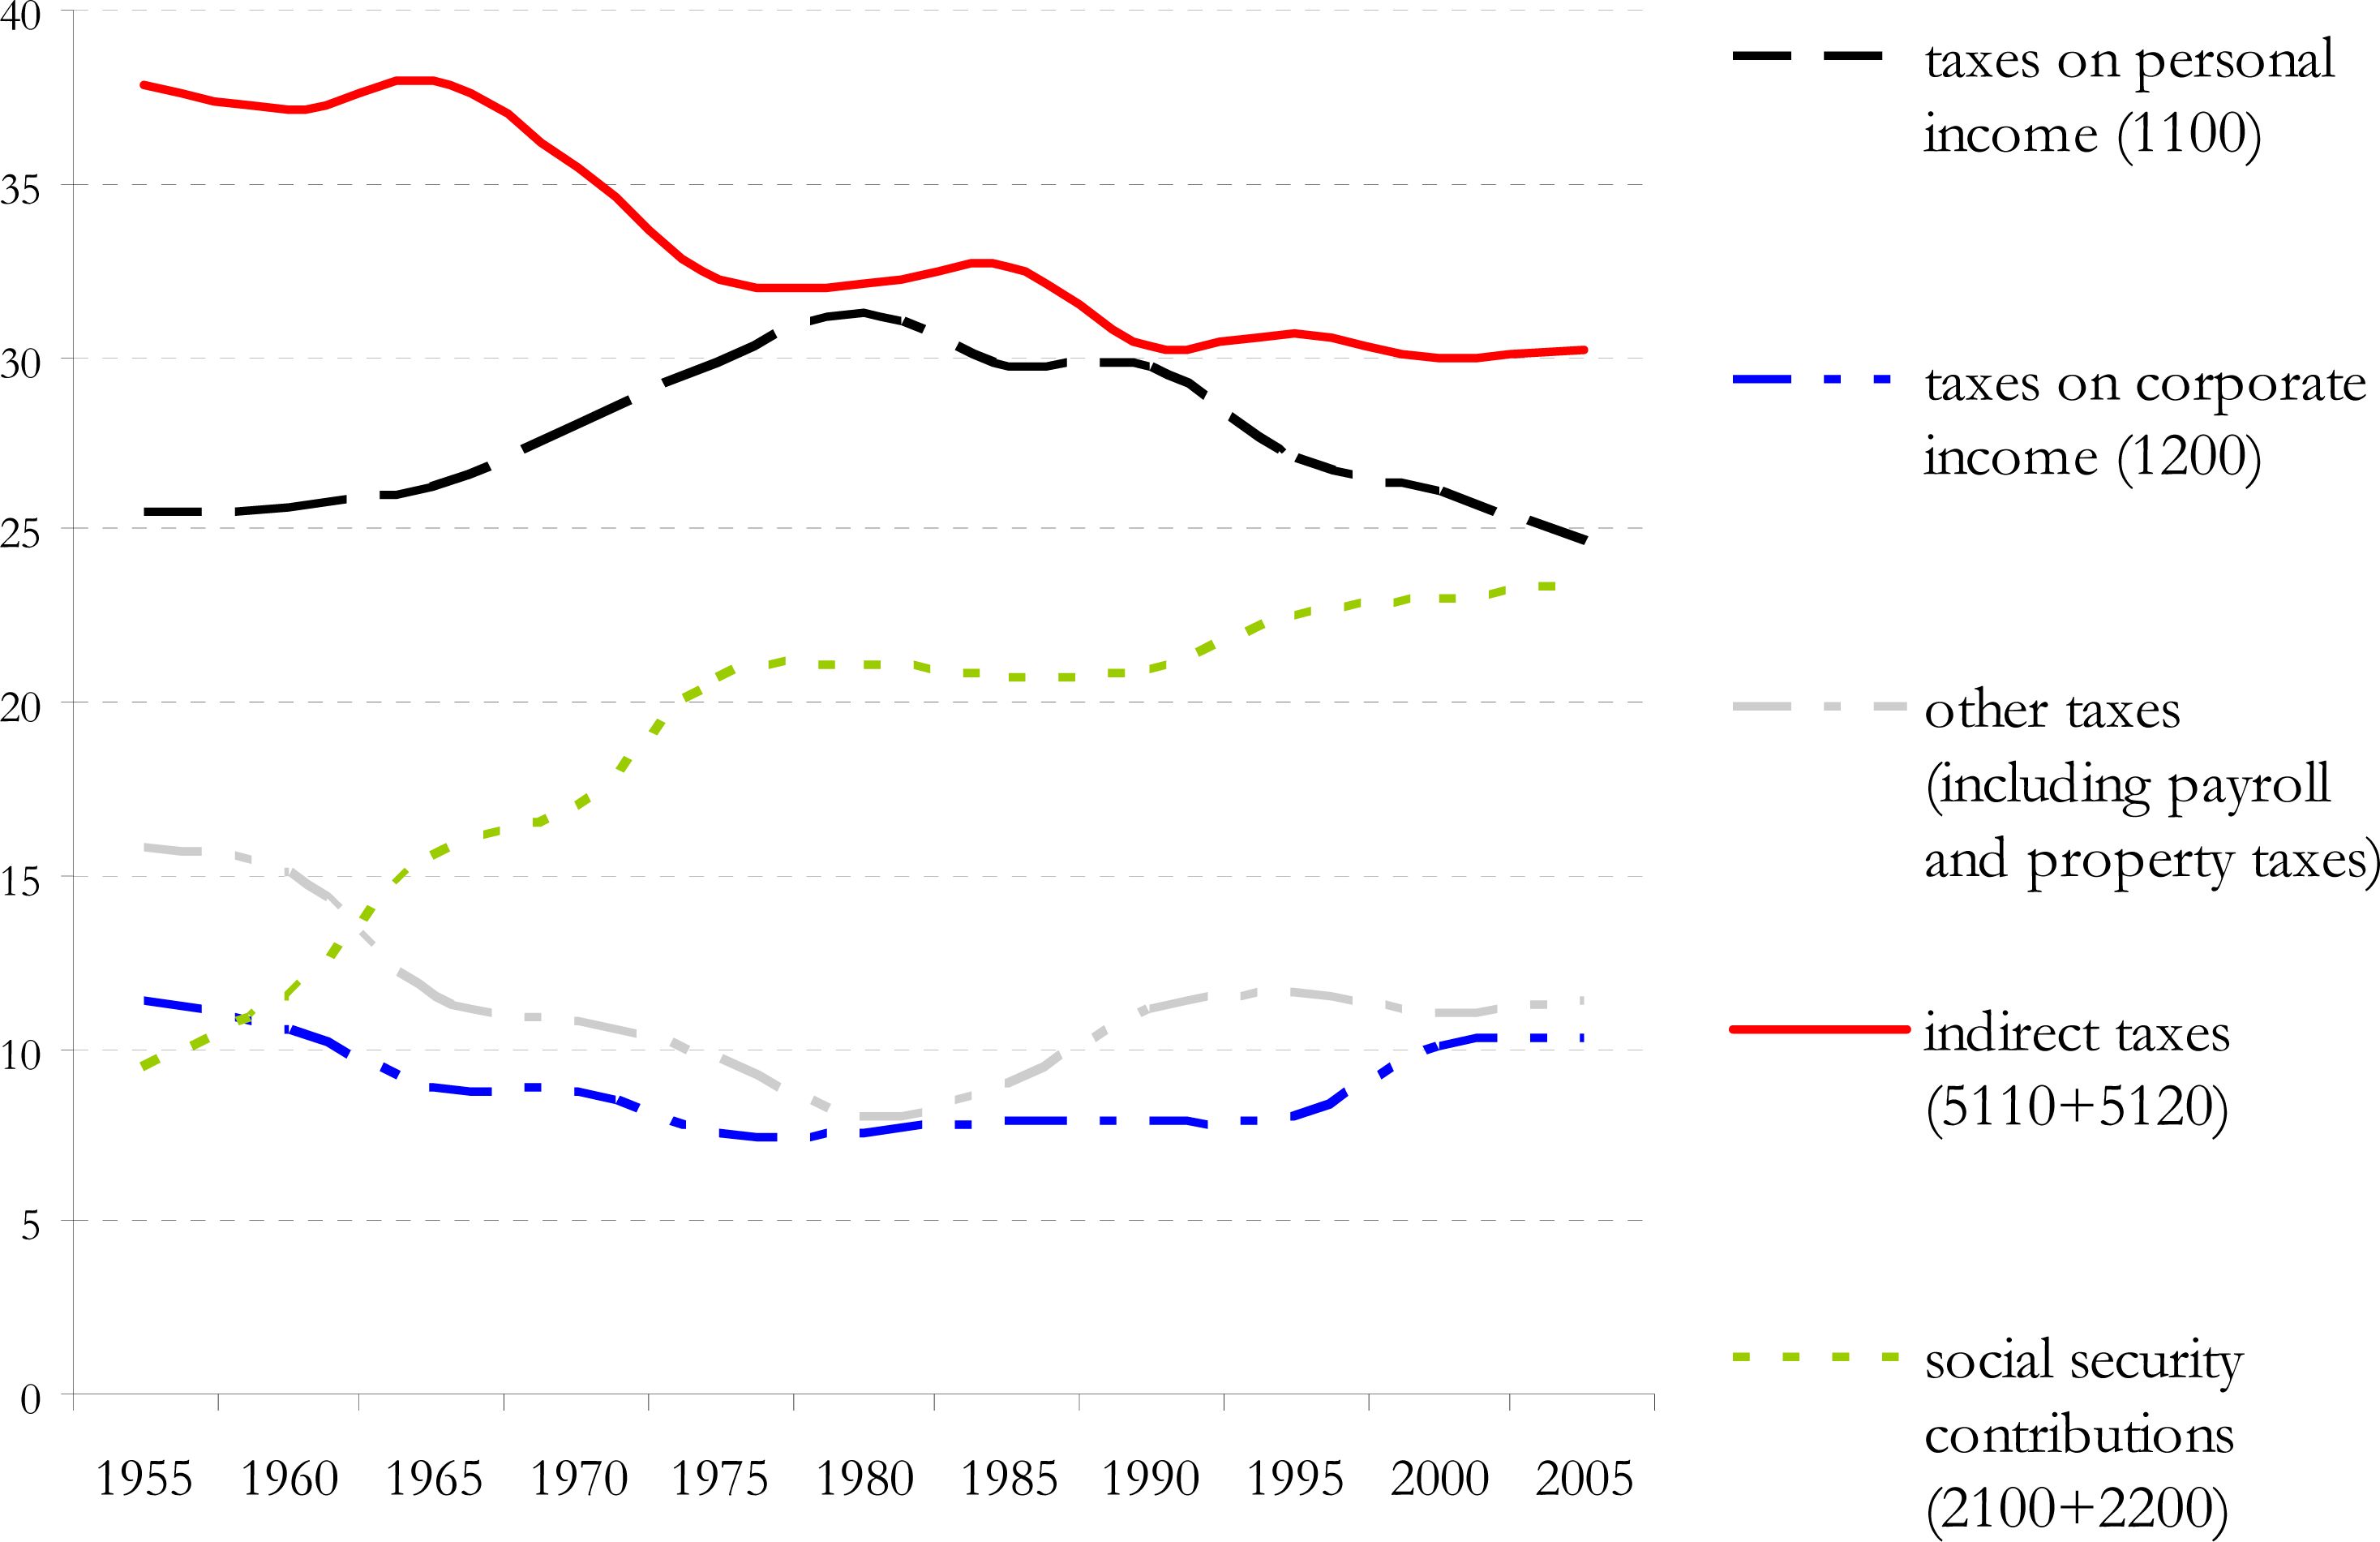
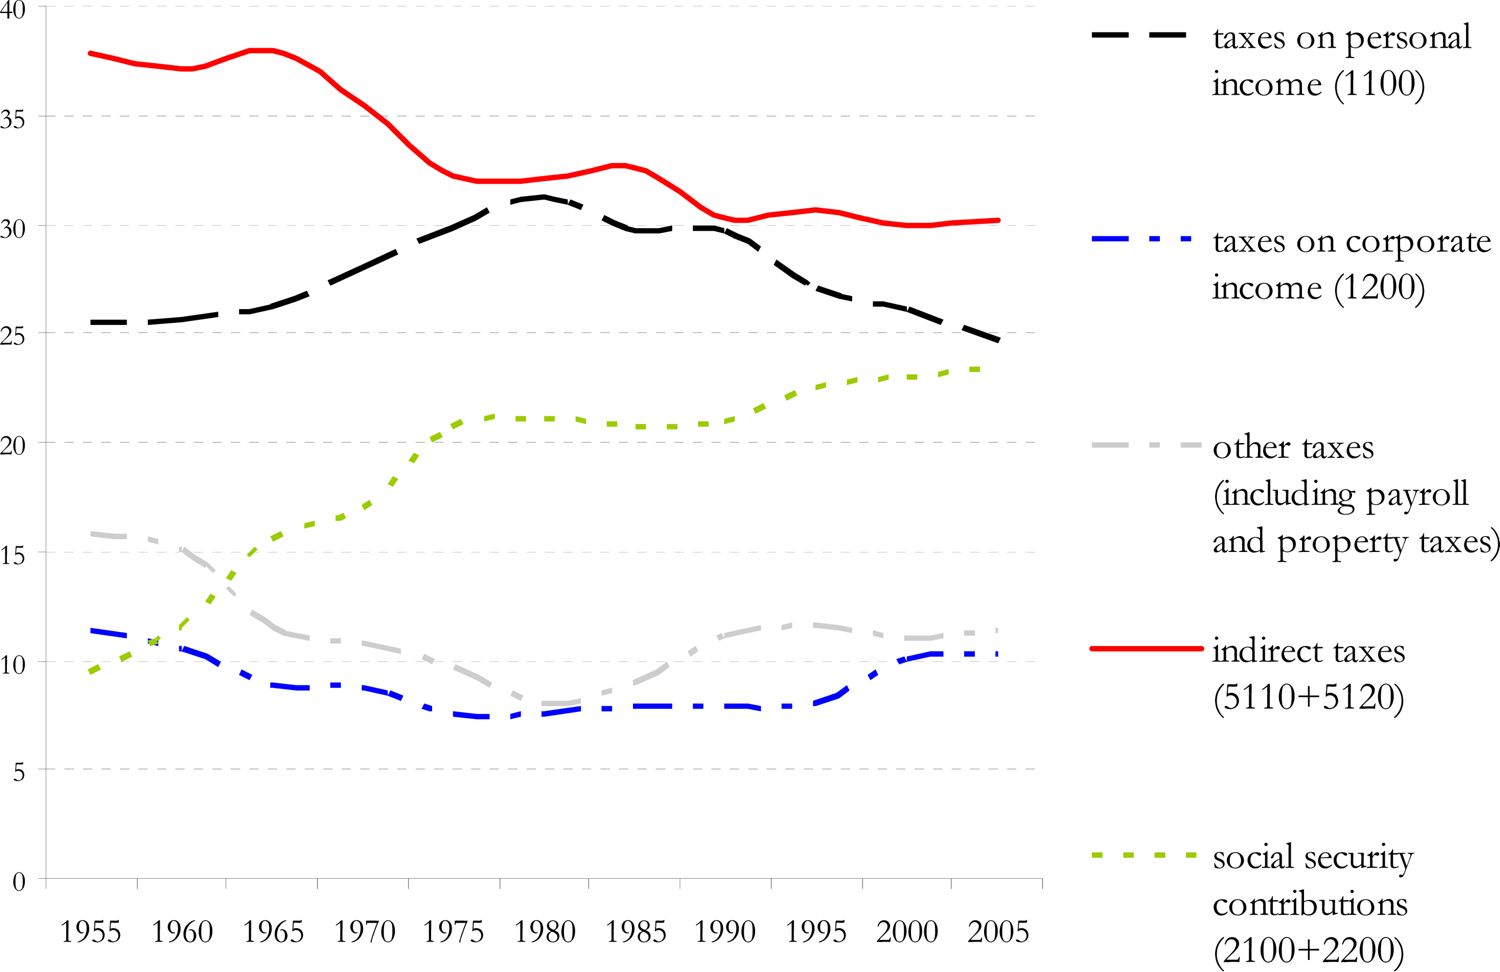
Share of different components of government revenue OECD 1955–2005.
Figure 2
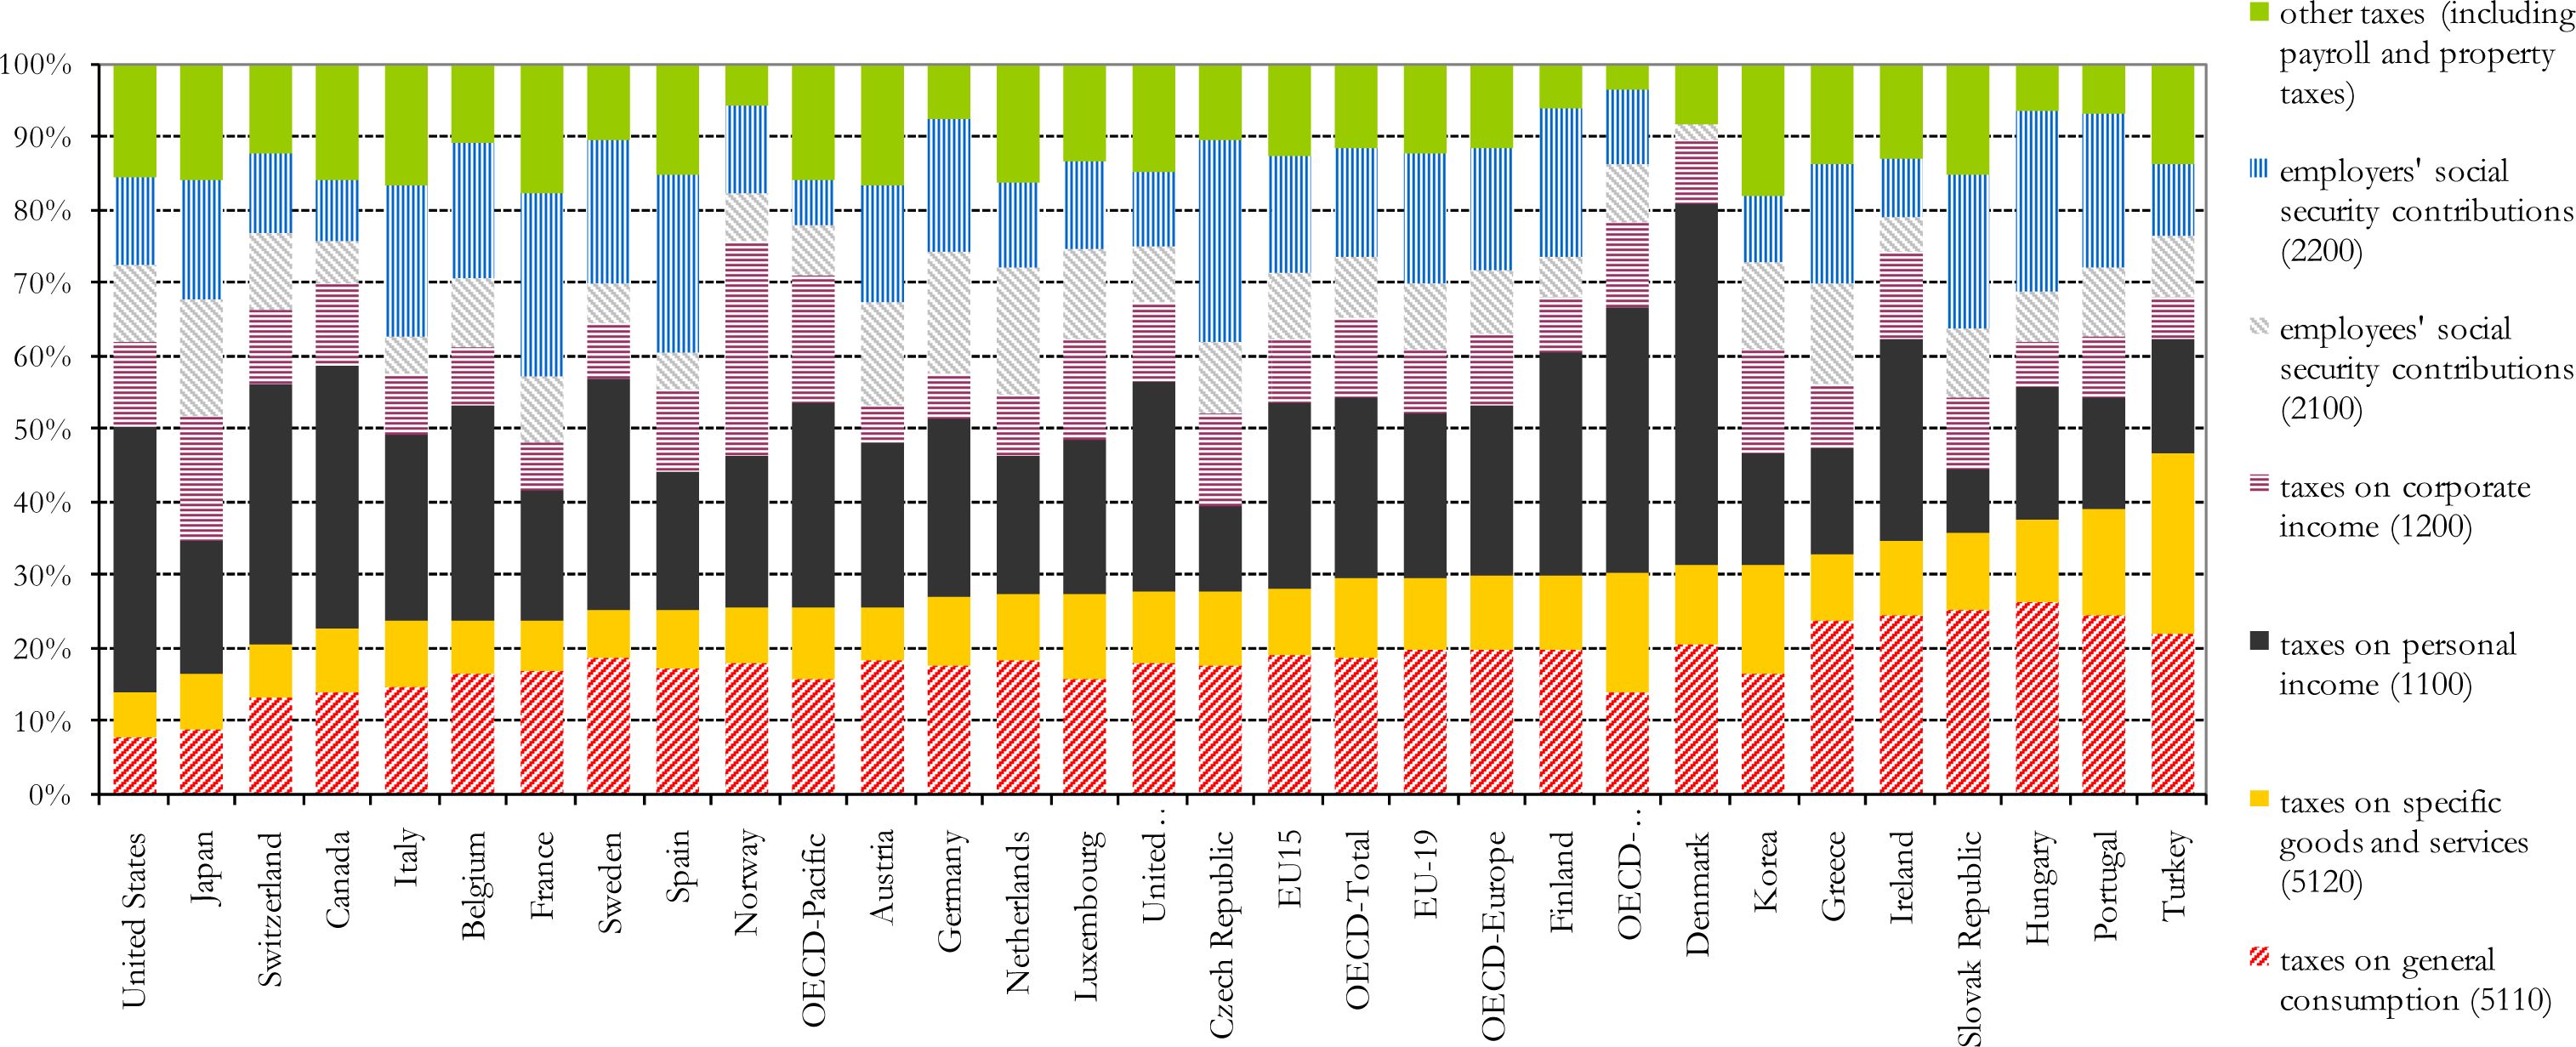
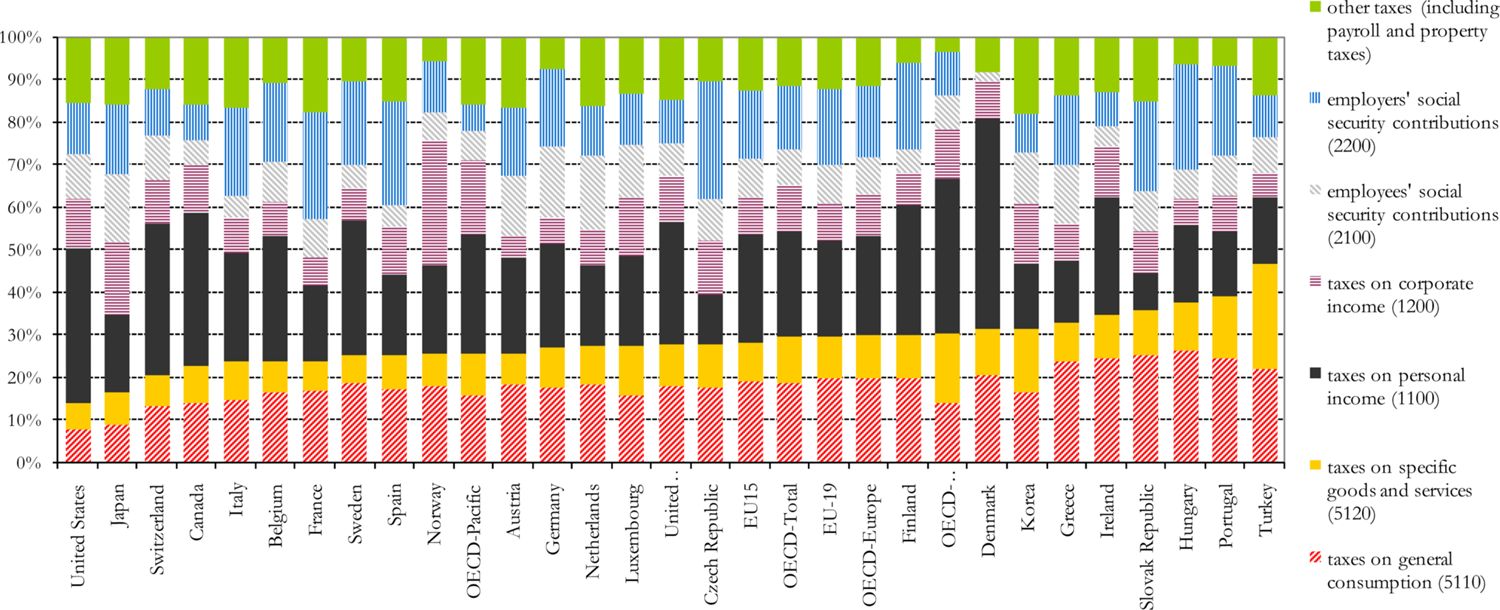
Share of different components of government revenue – oecd 2005.
Figure 3

QQ-plot for disposable income quantiles in budget dataset (dib) versus quantiles in income dataset (dii), Belgium (Euros per year).
Tables
Table 1
Expenditure datasets and income datasets for the four countries.
| Country | budget survey | # of households | income survey | # of households | policy year indirect taxes |
|---|---|---|---|---|---|
| BE | Household Budget Survey 2003 | 3,550 | EU-SILC 2004 | 5,275 | 2003 |
| HU | Household Budget Survey 2005 | 8,710 | EU-SILC 2005 | 6,924 | 2005 |
| IE | Household Budget Survey 1999 | 7,644 | Living In Ireland 2000 | 3,644 | 2001 |
| UK | Family Expenditures Survey 2003/2004 | 7,048 | Family Resources Survey 2003/2004 | 28,768 | 2003 |
Table 2
VAT-structure and expenditure shares per vat-category; excise rates and shares for the 3 most important excise good categories.
| Country and policy year | VAT | Excise | ||||||
|---|---|---|---|---|---|---|---|---|
| standar d rate 18–25% | not taxed or exempte d | reduced rate 1 4–6% | reduced rate 2 8–15% | Alcohol | Tobacco | Private transpor t | ||
| BE-2003 | Rates | 21 | 0 | 6 | 12 | 43.9 | 162.9 | 34.7 |
| Shares | 41.9 | 37.9 | 19.8 | 0.4 | 1.7 | 1.3 | 8.9 | |
| HU-2005 | Rates | 25 | 0 | 5 | 15 | 64.3 | 273.0 | 79.0 |
| Shares | 42.7 | 8.1 | 4.1 | 45.1 | 0.6 | 2.6 | 4.1 | |
| IE-2001 | Rates | 20 | 0 | - | 12.5 | 26.6 | 300.0 | 75.4 |
| Shares | 36.2 | 42.0 | - | 21.8 | 4.5 | 3.4 | 5.3 | |
| UK-2003 | Rates | 17.5 | 0 | 5 | - | 89.7 | 414.7 | 58.8 |
| shares | 57.7 | 36.3 | 6.1 | - | 1.9 | 2.2 | 8.0 | |
Table 3
Average expenditures per consumption category in budget and EUROMOD dataset.
| Commodity | expenditures in €, BE | expenditures in €, HU | expenditures in €, IE | expenditures in GBP, UK | ||||
|---|---|---|---|---|---|---|---|---|
| Budget Survey | EUROMOD | Budget Survey | EUROMOD | Budget Survey | EUROMOD | Budget Survey | EUROMOD | |
| food, non-alcoholic beverages | 4,183 | 4,050 | 1,813 | 1,675 | 4,620 | 8,215 | 2,617 | 2,121 |
| alcoholic beverages | 466 | 400 | 82 | 36 | 1,663 | 1,513 | 325 | 296 |
| tobacco | 275 | 279 | 191 | 170 | 644 | 1,098 | 280 | 321 |
| clothing and footwear | 1,395 | 1,284 | 442 | 380 | 1,848 | 1,493 | 1,183 | 916 |
| home fuels and electricity | 1,321 | 1,284 | 831 | 844 | 1,128 | 1,987 | 623 | 590 |
| rents | 1,418 | 1,560 | 59 | 62 | 681 | 913 | 691 | 543 |
| household services | 1,268 | 1,157 | 666 | 685 | 1,230 | 1,365 | 999 | 818 |
| health | 1,608 | 1,507 | 245 | 323 | 582 | 391 | 174 | 144 |
| private transport | 2,660 | 2,214 | 590 | 325 | 1,394 | 1,808 | 1,814 | 1,413 |
| public transport | 161 | 158 | 185 | 148 | 513 | 534 | 292 | 242 |
| communication | 803 | 758 | 460 | 437 | 739 | 1,223 | 551 | 457 |
| recreation and culture | 2,058 | 1,752 | 390 | 384 | 1,931 | 2,171 | 1,760 | 1,472 |
| education | 207 | 141 | 76 | 76 | 405 | 368 | 529 | 248 |
| restaurants and hotels | 2344 | 1,972 | 246 | 153 | 1,695 | 1,652 | 2,105 | 1,746 |
| other goods and services | 2,491 | 2,175 | 471 | 466 | 4,869 | 3,917 | 1,408 | 1,210 |
| Durables | 2,671 | 2,372 | 656 | 658 | 5,306 | 3,384 | 3,405 | 3,212 |
| All | 25,330 | 23,062 | 7,645 | 7,056 | 29,248 | 32,032 | 18,754 | 15,748 |
Table 4
Revenue effects of the simulation.
| BE | HU | IE | UK | |||||
|---|---|---|---|---|---|---|---|---|
| baseline | simulation | baseline | simulation | baseline | simulation | baseline | simulation | |
| SIC employee | 17,490 | -3,900 | 2,777 | -693 | 168,875 | -33,902 | 42,283 | -9,713 |
| PIT | 35,500 | + 1,763 | 4,608 | +0 | 1136,416 | +0 | 164,813 | +0 |
| Indirect tax | 14,400 | + 2,309 | 4,300 | + 731 | 443,139 | 34,791 | 71,717 | + 10,655 |
| VAT rate | 21% | 26% | 25% | 34% | 20% | 23.5% | 17.5% | 21.5% |
Table 5
Decomposition of welfare change into total expenditure effect and price change – by decile.
| Decile equiv. non durable expend. | BE (EUR) | HU (EUR) | IR (EUR) | UK (EUR) | ||||||||
|---|---|---|---|---|---|---|---|---|---|---|---|---|
| Change nondur. exp. | Price effect | WG | Change nondur. exp. | Price effect | WG | Change nondur. Exp. | Price effect | WG | Change nondur. Exp. | Price effect | WG | |
| 1 | 43 | −193 | −150 | 22 | −70 | −47 | 0 | −59 | −58 | 9 | −50 | −42 |
| 2 | 79 | −262 | −183 | 34 | −90 | −56 | 38 | −152 | −114 | 39 | −99 | −60 |
| 3 | 159 | −308 | −149 | 57 | −105 | −48 | 108 | −202 | −94 | 90 | −134 | −44 |
| 4 | 237 | −366 | −129 | 82 | −124 | −41 | 213 | −277 | −64 | 134 | −168 | −34 |
| 5 | 389 | −417 | −28 | 112 | −139 | −27 | 321 | −313 | 8 | 196 | −200 | −4 |
| 6 | 482 | −455 | 26 | 141 | −157 | −16 | 364 | −328 | 36 | 278 | −233 | 45 |
| 7 | 614 | −509 | 105 | 192 | −183 | 9 | 390 | −338 | 52 | 360 | −269 | 91 |
| 8 | 735 | −557 | 178 | 231 | −205 | 26 | 483 | −403 | 80 | 473 | −316 | 158 |
| 9 | 837 | −607 | 230 | 310 | −237 | 73 | 523 | −399 | 124 | 620 | −376 | 245 |
| 10 | 1162 | −858 | 305 | 527 | −339 | 188 | 722 | −531 | 191 | 764 | −570 | 194 |
| Mean | 473 | −453 | 20 | 171 | −165 | 6 | 316 | −300 | 16 | 296 | −241 | 55 |
Table 6
Decomposition of welfare change into total expenditure effect and price change – by group.
| group | BE (EUR) | HU (EUR) | IE (EUR) | UK(GBP) | ||||||||
|---|---|---|---|---|---|---|---|---|---|---|---|---|
| Change nondur. exp. | Price effect | WG | Change nondur. exp. | Price effect | WG | Change nondur. exp. | Price effect | WG | Change nondur. Exp. | Price effect | WG | |
| poor | 55 | −367 | −312 | 30 | −90 | −60 | 4 | −22 | −18 | 17 | −177 | −160 |
| non poor | 554 | −470 | 84 | 197 | −178 | 18 | 329 | 305 | 24 | 362 | −257 | 106 |
| on income support | 0 | −277 | −277 | 0 | −106 | −106 | 0 | −24 | −24 | 0 | −232 | −232 |
| retired | 112 | −289 | −177 | 117 | −120 | −3 | 22 | −46 | 24 | 35 | −164 | −130 |
| un−employed | 54 | −323 | −269 | 35 | −107 | −72 | 2 | −7 | −5 | 16 | −148 | −133 |
| mean | 473 | −453 | 20 | 171 | −165 | 6 | 316 | −300 | 16 | 296 | −241 | 55 |
Table 7
Savings rate per decile.
| Deciles | BE | HU | IE | UK |
|---|---|---|---|---|
| 1 | −63.4 | −50.4 | −109.9 | −37.1 |
| 2 | −17.5 | −14.3 | −67.3 | 1.7 |
| 3 | −8.1 | −3.9 | −38.8 | 10.4 |
| 4 | −2.1 | 1.6 | −25.0 | 16.3 |
| 5 | 3.8 | 6.4 | −22.3 | 21.3 |
| 6 | 9.3 | 10.1 | −11.2 | 24.2 |
| 7 | 13.3 | 12.1 | −2.9 | 28.6 |
| 8 | 18.0 | 14.4 | 4.5 | 32.5 |
| 9 | 22.7 | 17.6 | 15.4 | 37.8 |
| 10 | 33.3 | 27.1 | 38.5 | 50.4 |
Table 8
Suits and Reynolds-Smolensky index for personal income and indirect taxes.
| Country | ||||||
|---|---|---|---|---|---|---|
| Belgium | 0.219 | −0.079 | 0.113 | 0.057 | −0.010 | 0.046 |
| Greece | 0.492 | −0.101 | 0.094 | 0.035 | −0.024 | 0.01 |
| Hungary | 0.424 | −0.086 | 0.144 | 0.056 | −0.015 | 0.041 |
| Ireland | 0.140 | −0.143 | 0.044 | 0.043 | −0.019 | 0.024 |
| UK | 0.200 | −0.120 | 0.092 | 0.038 | −0.011 | 0.026 |
-
Note: denotes the Suits index for tax component Y, the Reynolds-Smolensky index; the superscript PIT refers to Personal Income Taxes, IND to Indirect Taxation and TOT to Personal Income Taxes and Indirect taxation.
Download links
A two-part list of links to download the article, or parts of the article, in various formats.