Challenges and solutions in constructing a microsimulation model of the use and costs of medical services in Australia
- University of Canberra, Australia
- Department of Treasury, Langton Crescent, Australia
Abstract
This paper describes the development of a microsimulation model ‘HealthMod’ which simulates the use and costs of medical and related services by Australian families. Australia has a universal social insurance scheme known as ‘Medicare’ which provides all Australians with access to free or low-cost essential medical services. These services are provided primarily by general practitioners as well as specialist doctors but also include diagnostic and imaging services. Individuals may pay a direct out-of pocket contribution if fees charged for services are higher than the reimbursement schedule set by government. HealthMod is based on the Australian 2001 National Health Survey. This survey had a number of deficiencies in terms of modelling the national medical benefits scheme. The article outlines three major methodological steps that had to be taken in the model construction: the imputation of synthetic families, the imputation of short-term health conditions, and the annualisation of doctor visits and costs. Some preliminary results on the use of doctor services subsidised through Australia’s Medicare are presented.
1. Introduction
Like many developed countries, the Australian Government has concluded that the projected increase in health outlays – through population ageing, real increases in per capita expenditure and health inflation – over the next few decades is unaffordable (Commonwealth Department of Treasury 2002, 2007, 2010). Over the past decade, the growth rate in total health expenditure has far outstripped growth in Australia’s GDP (AIHW, 2007). In 2005–06, government funding on medical services was $Aus12.2bn, representing 22.2 per cent of total government recurrent expenditure on health. This expenditure was matched by funding from non-government sources of $3.3bn. Between 1998–99 and 2008–09, the average annual real growth in total recurrent expenditure on medical services in Australia was 3.5 percent (AIHW, 2010). By 2006, the contribution of government funding to total expenditure on medical services had fallen below 80 percent (AIHW, 2007).
Australian policy makers are facing difficult decisions about health funding, not only in terms of the level of funding but also the balance between government and consumer contributions to health costs and about taxes which fund public health outlays. They do not currently have adequate modelling tools to assist them make informed decisions. This paper describes the initial stages of developing a microsimulation model ‘HealthMod’ which simulates the use and costs of medical and related services by Australian families. Australia has a universal social insurance scheme known as ‘Medicare’ which provides all Australians with access to free or low-cost essential medical services. These services are provided primarily by general practitioners (GPs) working in primary care but also by specialist doctors and include pathology, diagnostic and imaging services. HealthMod simulates the services listed on the Medicare Benefits Schedule (MBS). HealthMod has the capacity to assess the likely distributional impact of possible policy changes and their revenue or expenditure implications for Government as well as individuals and families.
HealthMod is based on the Australian Bureau of Statistics (ABS) 2001 National Health Survey (2001 NHS). The 2001 NHS contains information about the health of Australians, including the presence of long-term health conditions, health risk factors and health service usage, along with a range of demographic and socio-economic information. However, the 2001 survey had a number of major deficiencies in terms of modelling Australia’s Medicare scheme. So, whilst the 2001 NHS was chosen as the starting point for the basefile of HealthMod due to its rich health data, it was evident that supplementation of these data was required. This paper outlines three major methodological steps that had to be taken in the model’s construction: the imputation of synthetic families; the imputation of short-term health conditions; and the annualisation of doctor visits and costs. Before these technical aspects of the modelling are discussed, brief overviews of Medicare, the NHS and approaches to statistical matching are provided in the next section as background. Some preliminary results on the use of doctor services and the benefits (payments) provided through Medicare are presented as validation of the model construction undertaken to date.
2. Background
2.1 Medicare – Australia’s public health insurance scheme
Medicare is Australia’s compulsory universal public health insurance scheme. It provides free or subsidised health care services to all Australians while allowing individuals to choose private health services if they wish. Australians contribute to the funding of Medicare via a 1.5% levy on the taxable income of wage and salary earners. This is a minimum contribution with additional surcharges for ‘high’ income earners who do not have private health insurance coverage. Medicare currently provides medical benefit payments covering part or all of the cost to the patient of out-of-hospital medical services. Approximately 85 per cent of all medical services provided to Australians are funded by Medicare. Such services include:
visiting a general practitioner (GP) or specialist;
tests and examinations by doctors needed to treat illnesses, including X-rays and pathology tests;
eye tests performed by optometrists;
most surgical and other therapeutic procedures performed by doctors;
some surgical procedures performed by approved dentists;
some items associated with cleft lip and palate, as specified under a special scheme; and
some specified allied health services (Medicare Australia, 2006; Department of Health and Ageing, 2006).
In Australia, payment for medical and related services is based on a ‘fee for service’ funding model. The benefits individuals and families receive through Medicare are determined from a schedule of fees for service (representing a price deemed as standard for a particular medical service) set by the Australian Commonwealth Government. These are indexed each year with Medicare usually paying the full schedule fee for GP services and 85 per cent of the schedule fee for other out-of-hospital services. However, the fee charged by doctors for their services is not regulated and doctors may choose to charge patients more than the schedule fee. The difference between the total charge and the schedule fee is known as the ‘gap’ and is an out-of-pocket cost to the patient. If the service is charged at the schedule fee then it is effectively free to the patient.
‘Bulkbilling’ is an important aspect of the Australian Medicare scheme. If a doctor bulk-bills then the doctor directly charges Medicare for the service provided and they accept the schedule fee as full payment. Thus, a bulkbilled service incurs no out-of-pocket cost to the patient. Sometimes doctors will offer bulk-billing only to patients who are holders of government concession cards -individuals and families eligible for certain federal government pensions and allowances, senior citizens or people on low incomes. Over 75 per cent of visits to general practitioners in Australia are bulk-billed, although these rates vary greatly across regions.
Another key aspect of Australia’s Medicare scheme is the ‘safety net’. This is a MBS policy setting aimed at protecting individuals and families from high medical expenses incurred within a calendar year. If the safety net threshold is exceeded in a calendar year then the individual, or members of the family unit, start to receive additional rebates on any further services used.
There are two threshold levels; a general level which was set at $Aus1000 at 1 January 2006; and a concession level at $Aus500 for which eligibility is based on a combination of income and family size (www.medicareaustralia.gov.au). These are effective for both single persons and families.
From a modelling perspective, the MBS payment arrangements of scheduled fees, out-of-pocket gap payments and bulk-billing, and the Medicare safety-net provisions were the key policy elements that had to be captured in the construction of HealthMod. The way these aspects of Medicare operated meant that the modelling of the use and costs of medical services not only had to be at the level of the individual but also by family units.
The number of medical and related services subsidised and benefits paid under Medicare for the 2005–06 financial year are given in Table 1. As shown, the Australian Government outlaid nearly $Aus11bn on 247 million services, with Australians averaging 12 MBS doctor or medical related services each in 2005–06 and receiving over $Aus530 each in benefits paid.
Medicare subsidised medical services and benefits paid by MBS category (processed by Medicare Australia July 2005 to June 2006).
| MBS Category | No. Services (‘000,000) | Benefit ($m) | No. Services per 1,000 pop. | Benefit ($) per 1,000 pop. |
|---|---|---|---|---|
| 1 Professional Attendances | 1,260.5 | 5,266.0 | 6,118.3 | 255,602.7 |
| 2 Diagnostic Procedures and Investigations | 43.3 | 251.2 | 210.3 | 12,190.9 |
| 3 Therapeutic Procedures | 153.4 | 1,790.6 | 744.7 | 86,914.5 |
| 4 Oral and Maxillofacial Services (by Approved Dental Practitioners) | 0.7 | 8.5 | 3.6 | 414.4 |
| 5 Diagnostic Imaging Services | 149.2 | 1,609.4 | 724.3 | 78,118.7 |
| 6 Pathology Services | 828.9 | 1,641.8 | 4,023.3 | 79,693.0 |
| 7 Cleft Lip and Cleft Palate | 0.1 | 1.3 | 0.3 | 61.9 |
| 8 Miscellaneous Services | 37.5 | 407.4 | 181.9 | 19,776.4 |
| Total | 2,473.7 | 10,976.3 | 12,006.9 | 532,772.5 |
-
Source: Medicare Australia website @ www.medicareaustralia.gov.au
2.2 Australia’s national health surveys
The 2001 NHS was the third in a series of regular population surveys run by the ABS designed to obtain national benchmark information on a range of health-related issues and to enable the monitoring of trends in health over time (ABS, 2003). Information was collected on the health status of Australians, their use of health services and facilities, and health-related aspects of their lifestyle as well as on a range of demographic and socio-economic information. This included details of long-term medical conditions experienced by respondents and consultations with health professionals among other items. While the 2001 NHS covered urban and rural areas across all States and Territories of Australia, sparsely settled areas were excluded from the sample and usual residents of private dwellings only were covered (ABS, 2003). Overall, 26,863 persons from 17,918 private dwellings were included in the survey.
However, while the 2001 NHS followed earlier surveys, it represented the first of a redesigned national health survey that was to be conducted every triennium rather than five yearly. Following wide consultation with Government and other key stakeholders, several major changes were made to the NHS. The most important with respect to the construction of HealthMod were changes in the survey coverage of household members and in health topics.
In the 1989/90 and 1995 NHSs all persons in sampled dwellings were included in the surveys and only records from fully responding households were retained on the data files. This meant that results could be compiled at household, family and income unit level in addition to person level (ABS, 2004). In the 2001 NHS, the sampling design changed to a random sub-sample of persons in selected dwellings, leading to incomplete enumeration of household members. Only one adult (18 years of age and older), one child aged 7 to 17 years, and all children aged 0 to 6 years were surveyed (ABS, 2003). Complete enumeration only occurred in a minority of households, and by definition, only in single adult and single adult with young children households. The ABS argued that the 2001 approach enabled a greater spreading of the sample and reduced the effects of clustering of characteristics within households on final estimates (ABS, 2004).
In terms of health topics, information about recent (short-term) illness, defined as requiring action in the two weeks prior to interview, also was not collected except in relation to persons with long term asthma or diabetes. Rather, data collected on health conditions focussed on long-term conditions, in particular Australia’s national health priority areas (NHPAs). In 2001, Australia’s NHPAs were cardiovascular disease, cancer, injury, mental health, diabetes, and arthritis and musculoskeletal conditions. These contributed most to the burden of illness in Australia, and were regarded as having potential to respond to policy (ABS, 2003a). To enable the prevalence of all long-term conditions to be established, supplementary information was also collected on other long-term non-NHPA conditions. A long-term condition was defined as one reported by respondents as being a condition which they currently had and which had lasted or was expected to last for six months or more (ABS, 2003). The ABS (2003) reports that the health topics selected for inclusion in the 2001 NHS were those identified as being of highest priority and which could be appropriately addressed in an ABS household survey of this type. Overall, the ABS regarded the changes to the 2001 NHS design from that used previously better met the needs of key users, while maximising the reliability and validity of the data within cost and operational constraints (ABS, 2003a).
2.3 Statistical matching approach
As will be described shortly, the derivation of family structure in HealthMod was achieved through statistically matching records from two national surveys. Since this involves sample surveys (rather than administrative data or a census), the aim of the matching was to find the closest statistical match. Statistical matching is a procedure used to link two or more data files where each record from a file is matched with a record from a second file that generally does not represent the same unit, but does represent a similar unit. It is a method to bring together microdata that are not available from a single data source (Radner et al 1980, Rodgers, 1984; Cohen, 1991; Moriarty & Scheuren, 2001; Rassler, 2002). There are a number of processes available for statistically matching datasets and generating synthetic microdata. The method adopted in HealthMod was distance-based record linkage using the Mahalanobis distance function (McLachlan, 1999; Bedrick et al, 2000; Torra et al, 2006). This is distinct from two other commonly used approaches of iterative proportional fitting (Ballas & Clarke, 2000; Simpson and Tanner, 2004) and simulating annealing (Ballas et al, 2004; Ballas et al, 2007).
A distance function is used to assess the similarity (or divergence) of any pair of records based on either a common variable X or multiple features Xi. If there are more than one X variable to be used in the matching then these variables must assume some weight i.e. importance in the Mahalanobis distance function. These weights can be assigned subjectively, or can come from a regression or factor analysis. The Mahalanobis distance function was used as it accounts for unequal variances as well as correlations between the common variables. It takes the different scales of the common variables into consideration by dividing the individual differences by the standard deviation of each variable. Without this adjustment, some variables may be penalized purely due to the scale of the variable and not its importance in the matching process. Better performance of the distance function occurs if the linking X variables chosen are continuous or ordinal variables.
Statistical matching using a distance function approach had been trialed previously in the National Centre for Social and Economic Modelling’s (NATSEM) MediSim model of the Australian Pharmaceutical Benefits Scheme (Abello et al, 2008; Brown et al, 2004; ABS NATSEM Technical Working Group, 2004). This performed well in the construction of synthetic family units (Abello et al, 2008).
3. Methodological steps
The 2001 NHS has a number of limitations as a base dataset for a microsimulation model following changes in the survey design relative to previous surveys. Three key problems and the methods designed to overcome them are discussed below. First, as indicated above, the 2001 survey only partially enumerates households. The ABS therefore recommends that any analysis of the 2001 file be undertaken at the person level only (ABS, 2003). To model the different aspects of Medicare complete information about all family members, their combined health service use and their combined income/medical expenditure is required. Second, the survey has very limited coverage of recent illness. Analysis of the 1995 NHS indicates that around 70 per cent of general practitioner visits in Australia are prompted by short-term health problems. The lack of coverage of short-term illnesses is a major limitation since these conditions need to be adequately captured in the base file. Third, doctor usage is being modelled within HealthMod with health conditions as an explanatory variable. Hence, the annual picture of the presence of health conditions is also required. The 2001 NHS uses a two-week window for reporting the use of medical and related services. To model the impact of policy, such as the MBS safety net, an annual picture of doctor visits and use of other medical services such as diagnostic procedures, diagnostic imaging and pathology services is required. To address these issues, we produced an augmented dataset by creating synthetic families through statistical matching, imputing short-term conditions and annualising medical services covered under the MBS.
3.1 Generation of synthetic families through statistical mathching
In HealthMod, the records that were matched were from the basefile of NATSEM’s static microsimulation model of the Australian tax and transfer system STINMOD/01a and the 2001 NHS. STINMOD/01a is an uprated version of the ABS 1998–99 Household Expenditure Survey (HES) and includes imputed records for children (the 1998–99 HES contained information about family structure but an individual questionnaire was only completed for each usual resident within the household aged 15 years and over) (ABS, 2000). The HES-based STINMOD/01A contains around 18,000 person records and as previously stated the 2001 NHS around 27,000 person records.
STINMOD/01A was used as the donor file. STINMOD/01A includes family structure information as well as income and expenditure (including amount spent on medical care and health expenses) and demographic data. The statistical matching of 2001 NHS and STINMOD/01A allows the retention of the health information available on 2001 NHS, whilst borrowing the family structure from the HES and theoretically adding detailed information about family income and health expenditure.
Differences in sample size among the different surveys is not an issue as weighted duplications of records may be created so that the sample sizes in both datasets are equal (Taylor, Gomulka & Sutherland, 2000). The main difficulty encountered is the choice of weights in the merged file. The weights in either the NHS or STINMOD/01A could be selected — but the risk is that the statistical distribution and parameters of the variables merged from the other survey are not maintained. If constrained statistical matching is used, then the goal is to try to maintain the marginal distributions of the non-matched variables by minimising the difference in the weights of the records in the merged file to those of the two original surveys (Cohen, 1991).
Statistical matching performs ―better‖ with the use of well-selected common variables between the two datasets. This was limited by the common variables available and the strength of the correlation between the common variables and unconstrained variables. Between the 2001 NHS and STINMOD/01A, the common variables available were mainly demographic and included age, sex, concessional cardholder status, labour force status, number of usual residents in household and equivalised income decile.
However, statistical matching has an inherent assumption of conditional independence (CIA). It assumes that Y (e.g. the health variables on the NHS) and Z (e.g. the household income and medical expenditure variables on STINMOD/01A), given X (the common demographic variables) are independent. Cohen 1991 (p74) explains: “Records from two files are matched or not matched on the basis of the values of X (in file A and file B). Therefore, there is no additional information in the matched file about the relationship between X and Y and between X and Z that is not explained by the relationships between X and Y and between X and Z.” However, because all the variables are not observed together, this assumption cannot be tested (except if an auxiliary dataset containing all variables of interest was available). The confidence that can be felt about a match is highly dependent on the correlation of the common variables to the health variables on the NHS side and the income/expenditure variables on the STINMOD/01A side. Bringing across the detailed income and medical expenditure data from the STINMOD/01A file was problematic. Therefore the matching focussed on adding family structure. Using the family allocation from STINMOD/01A had less reliance on the assumption of conditional independence as it only borrowed from the common demographic variables and the analysis did not use joint distributions. Nevertheless the 2001 NHS did have income data that was available to the model although not as detailed as that contained in STINMOD/01A.
3.1.1 Methods
The statistical matching process involved two-stages:
Person records were subdivided into homogeneous cell groups based on the common variables; and
Persons belonging to the same group were matched together using the distance function.
The homogeneous groups ensure a required standard of matching is maintained, whilst the distance function tries to find the closest matching individuals from the two surveys who are in the same group. By using a conservative number of cell groups (less than approximately 100 cell groups as more tends to lead to algorithm failure), the distance function can be used to determine the relative importance of the common variables. From a practical point, the cell groups must be such that there is an adequate sample from both surveys in the cell group for the second stage to work.
The distance function to select closest matches within the homogeneous groups was:
where
i relates to person records,
j relates to the matching variable, and
k relates to the cell group.
is the variance of the jth matching variable from STIN MOD/01A
axj is the user defined relative importance, or weight given to each matching variable.
A constrained matching process using linear programming techniques in SAS was used to match records in the two datasets. This minimized the distance function and was subject to the constraint that the weights attached to the matched file preserve the weights of the separate files. A requirement of this approach was that the sum of the STINMOD/01A weights and NHS weights were the same. Consequently, the files were weighted to match the NHS, so whilst marginal distributions for the NHS were preserved, marginal distributions were not be preserved for the STINMOD/01A HES variables.
To align the two surveys for matching the following adjustments were required:
Add records representing children in the STINMOD/01A to create a person level file. This was based on household composition data.
Impute children’s self-assessed health status on the 2001 NHS by assuming that their status is the same as the highest level of the other household members.
Impute concession-card holder status onto STINMOD/01A by assuming that any household with one person holding a concession card holder, also has the rest of the household having concession card holders.
Equivalent income deciles (for income units) were created on STINMOD/0 1a using the OECD method for equivalising income, i.e.
(2)Impute equivalent income decile on 2001 NHS where income decile was in ―not stated‖ category. Missing income deciles were estimated using polytomous logistic regression with personal income, number of persons in household, age, post-school qualifications and employment status as the predictors.
Number of usual residents in household capped at six or more (since the 2001 NHS caps household size at 6 or more).
The variables used to create homogeneous groups in the final version of the HealthMod statistical matching were: income unit type (4 categories); age group (2 categories); concessional card status (2 categories); gender (2 categories); equivalent income deciles (3 categories). The matching variables used in the distance function and the relative importance weight they were given were: age (1); number of usual residents in household (0.5); equivalised income decile (1); income unit income decile (5); number of adults in household (0.5); employment status (1); and marital status (0.3). In this matching scheme more demographic variables were added to the distance function to try and improve the alignment of income on the matched file.
3.1.2 Results
Tables 2–5 illustrate the closeness of the match for key family variables, as measured by the STINMOD/01A-NHS cross-tabulation percentage distribution. As Table 2 shows the results for age are very reasonable with few records in STINMOD/01A being matched to NHS records where age category was more than one cell from the diagonal. The correlation for this variable was very strong at 0.93. The matched file also performs well in terms of equivalent income deciles (Table 3) with a 0.94 correlation between the matched value for income quintile (in NHS records) and the actual value (from STINMOD/01A).
The matching does not perform as well in linking records for the number of residents in the household (Table 4) with a lower correlation of 0.75. However, most of the matched values are still within one category of the actual category (Table 4). In terms of income unit type, mismatching only occurs for lone person and ‘other’ income unit types (Table 5). These two categories were combined in the creation of the homogeneous groups.
Closeness of match – age group (percentage distribution).
| Age Group (years) – STINMOD /01A | Age Group (years) – NHS | |||||||||||||||
|---|---|---|---|---|---|---|---|---|---|---|---|---|---|---|---|---|
| 0–4 | 5–9 | 10–14 | 15–19 | 20–24 | 25–29 | 30–34 | 35–39 | 40–44 | 45–49 | 50–54 | 55–59 | 60–64 | 65–69 | 70–74 | 75+ | |
| 0–4 | 79.0 | 18.6 | 2.4 | . | . | . | . | . | . | . | . | . | . | . | . | . |
| 5–9 | 14.4 | 65.4 | 20.1 | . | . | . | . | . | . | . | . | . | . | . | . | . |
| 10–14 | 4.6 | 17.7 | 77.7 | . | . | . | . | . | . | . | . | . | . | . | . | . |
| 15–19 | . | . | . | 69.7 | 13.4 | 7.7 | 5.2 | 0.8 | 0.8 | 0.4 | 1.1 | 0.8 | 0.1 | 0.1 | . | . |
| 20–24 | . | . | . | 26.2 | 28.1 | 18.0 | 8.1 | 5.2 | 6.7 | 3.3 | 1.0 | 1.9 | 1.0 | 0.3 | 0.1 | . |
| 25–29 | . | . | . | 7.1 | 15.2 | 32.8 | 22.0 | 5.7 | 3.8 | 5.1 | 3.3 | 1.5 | 2.6 | 0.8 | 0.2 | . |
| 30–34 | . | . | . | 2.1 | 6.6 | 9.1 | 40.6 | 21.2 | 6.2 | 6.4 | 3.8 | 1.2 | 0.8 | 0.8 | 0.6 | 0.6 |
| 35–39 | . | . | . | 1.2 | 2.7 | 5.8 | 6.7 | 45.0 | 19.4 | 7.6 | 5.0 | 2.6 | 1.3 | 0.9 | 0.6 | 1.0 |
| 40–44 | . | . | . | 0.9 | 1.9 | 3.5 | 5.3 | 10.6 | 43.6 | 15.3 | 10.1 | 3.1 | 2.1 | 1.5 | 1.4 | 0.5 |
| 45–49 | . | . | . | 0.9 | 1.2 | 1.6 | 1.7 | 4.6 | 14.2 | 38.2 | 20.4 | 7.4 | 2.6 | 3.1 | 2.4 | 1.7 |
| 50–54 | . | . | . | 0.1 | 1.0 | 0.8 | 1.0 | 2.8 | 5.8 | 11.9 | 32.4 | 30.4 | 7.5 | 2.4 | 1.1 | 2.9 |
| 55–59 | . | . | . | . | 0.4 | 0.3 | 1 | 1.0 | 2 | 4.7 | 8.6 | 31.8 | 36.1 | 6.4 | 2.8 | 4.8 |
| 60–64 | . | . | . | . | 0 | . | 0.0 | 0.2 | 0.5 | 1.5 | 2.3 | 5.4 | 39.0 | 41.8 | 5.0 | 4.2 |
| 65–69 | . | . | . | . | . | . | 0.1 | 0.2 | 0.3 | 0.5 | 1.0 | 2.3 | 6.2 | 31.7 | 50.3 | 7.4 |
| 70–74 | . | . | . | . | 0.1 | 0.1 | . | 0.1 | 0.2 | 1 | 1.7 | 3.6 | 3.2 | 3.3 | 37.5 | 49.3 |
| 75+ | . | . | . | . | . | . | . | 0.0 | 0.3 | 0.0 | 0.9 | 1.4 | 3.2 | 1.5 | 3.2 | 89.2 |
| All | 9.1 | 8.5 | 6.6 | 6.5 | 4.7 | 5.8 | 7.1 | 8.0 | 7.9 | 6.8 | 6.1 | 5.3 | 4.8 | 3.9 | 3.8 | 5.3 |
Closeness of match – equivalent income deciles (percentage distribution).
| Equivalent income decile – STINMOD/01A | Equivalent Income decile – NHS | |||||||||
|---|---|---|---|---|---|---|---|---|---|---|
| 1 | 2 | 3 | 4 | 5 | 6 | 7 | 8 | 9 | 10 | |
| 1 | 69.9 | 16.4 | 13.3 | 0 | 0.1 | 0.1 | 0.2 | . | . | . |
| 2 | 20.5 | 46.3 | 33 | . | . | 0.1 | 0.1 | . | . | . |
| 3 | 7.1 | 24.9 | 67.5 | . | . | 0.3 | 0.3 | . | . | . |
| 4 | . | . | . | 39.4 | 22.6 | 28.4 | 9.6 | . | . | . |
| 5 | . | . | . | 19.1 | 29.1 | 23.7 | 28.0 | . | . | . |
| 6 | . | . | . | 12.3 | 20.3 | 37.4 | 30.0 | . | . | . |
| 7 | . | . | . | 2.4 | 9.7 | 18.0 | 69.9 | . | . | . |
| 8 | . | . | . | . | . | . | . | 67.7 | 30.3 | 1.9 |
| 9 | . | . | . | . | . | . | . | 18.6 | 47.3 | 34.1 |
| 10 | . | . | . | . | . | . | . | 12.3 | 23.6 | 64.1 |
Closeness of match – number of persons in household (percentage distribution).
| Number of persons in household – STINMOD/01A | Number of persons in household – NHS | |||||
|---|---|---|---|---|---|---|
| 1 | 2 | 3 | 4 | 5 | 6+ | |
| 1 | 67.0 | 14.9 | 8.0 | 4.4 | 3.0 | 2.6 |
| 2 | 10.0 | 75.8 | 9.7 | 3.3 | 0.9 | 0.3 |
| 3 | 3.4 | 16.5 | 54.1 | 23.2 | 2.5 | 0.3 |
| 4 | 1.8 | 1.4 | 17.1 | 61.2 | 14.9 | 3.7 |
| 5 | 1.5 | 0.9 | 2.6 | 35.1 | 44.6 | 15.4 |
| 6+ | 9.1 12.8 | 1.3 26.6 | 2.4 18.2 | 7.5 25 | 29.4 11.7 | 50.2 |
| All | 12.8 | 26.6 | 18.2 | 25 | 11.7 | 5.7 |
Closeness of match – income unit type (percentage distribution).
| Income Unit Type -STINMOD/01A | Income Unit Type – NHS | ||||
|---|---|---|---|---|---|
| Lone person | Couple | Couple with kids | Single with kids | Other | |
| Lone person | 69.7 | . | . | . | 30.3 |
| Couple | . | 100 | . | . | . |
| Couple with kids | . | . | 100 | . | . |
| Single with kids | . | . | . | 100 | . |
| Other | 55.2 | . | . | . | 44.8 |
| All | 18 | 7.1 | 23.1 | 42.4 | 9.4 |
4. Imputation of short-term health conditions
A key building block for constructing HealthMod was linking medical service use to persons’ health conditions.
The importance of short-term health conditions in the imputation of doctors’ visits is illustrated in the 1995 National Health Survey (NHS) data where, of those health conditions leading to a doctor’s visit, 78 per cent were of a recent (only) nature (i.e. it was not due to a long standing condition). The 2003–04 annual survey of activities undertaken in general practice showed that, whilst not as large a proportion, health problems of a non-chronic nature accounted for 65.3 per cent of problems treated by a GP (Britt et al, 2004). Consequently, the inclusion of short-term conditions in the model was essential.
Short-term health conditions had to be imputed onto the HealthMod basefile since the last national health survey to include questions about all conditions was the 1995 NHS. Consequently, the 1995 NHS has been used as the basis for informing the imputation of short-term health conditions onto the HealthMod basefile. The ABS definition of a short-term health condition is any health condition that lasted for less than 6 months or was not likely to last for six months. Conversely, a long-term health condition is any health condition that has lasted for longer than 6 months or was likely to last for more than 6 months. The information about health conditions is self-reported and any inaccuracy caused by this must be kept in mind. In addition, in 1995 information was only collected about health conditions present in the two weeks prior to interview.
4.1 Health condition groups
Health conditions identified in the national health surveys could be classified into over 100 different categories. This number stretches the effectiveness of monte carlo simulation methods available for the imputation. A higher level condition grouping, based on 26 groups, was therefore developed.
Not all of these groups included a short-term component. If the health condition group was predominantly long-term in nature – defined as more than 95 per cent of the cases were long term in nature – then these as well as conditions that were rare (prevalence of less than 1 per cent) were excluded in the short-term health conditions imputation process. It was felt that the exclusion of these conditions from the imputation would not lead to a significant loss of information or accuracy in the model. Table 6 shows that the condition groups of arthritis, asthma, diabetes, other eye and adnexa and disability not elsewhere classified (nec) are all predominately long-term health conditions and the prevalence of the health condition groups of visual disturbances, pregnancy complications and childbirth and congenital conditions were less than 1%. Table 6 also shows that injury and poisoning, infectious disease, signs and symptoms, skin and subcutaneous diseases groups have significant proportions that are short-term in nature. The inclusion of these health condition groups was therefore essential in the imputation process.
Prevalence and long-term characteristics of health condition groups, 1995.
| Health Name | Condition | Group | Prevalence per 100 population | Prevalence as a LTC per 100 population | % LTC (either only or with acute bouts) |
|---|---|---|---|---|---|
| 1 | arthritis | 14.72 | 14.58 | 99.05 | |
| 2 | asthma | 11.30 | 11.09 | 98.10 | |
| 3 | diabetes | 2.47 | 2.45 | 99.15 | |
| 4 | heart and circulatory | 21.42 | 20.02 | 93.45 | |
| 5 | mental health | 5.80 | 4.00 | 69.04 | |
| 6 | cancer | 2.10 | 1.78 | 84.58 | |
| 7 | injury and poisoning | 6.39 | 0.60 | 9.43 | |
| 8 | other muscular | 17.01 | 12.48 | 73.36 | |
| 9 | other endocrine | 10.47 | 7.81 | 74.66 | |
| 10 | respiratory | 32.26 | 23.12 | 71.66 | |
| 11 | visual disturbances | 0.27 | 0.19 | 72.43 | |
| 12 | other eye and adnexa | 49.71 | 48.87 | 98.31 | |
| 13 | ear and mastoid | 12.48 | 11.36 | 91.09 | |
| 14 | nervous system | 3.50 | 2.65 | 75.81 | |
| 15 | infectious disease | 3.73 | 1.03 | 27.66 | |
| 16 | digestive | 10.56 | 7.66 | 72.60 | |
| 17 | dental | 5.06 | 0.12 | 2.44 | |
| 18 | genito-urinary | 6.38 | 3.60 | 56.34 | |
| 19 | skin and subcutaneous | 9.87 | 3.80 | 38.45 | |
| 20 | blood diseases | 2.05 | 1.67 | 81.67 | |
| 21 | pregancy and childbirth | 0.88 | 0.15 | 17.05 | |
| 22 | sign and symptoms | 24.24 | 7.30 | 30.12 | |
| 23 | preventative | 31.92 | 0.02 | 0.06 | |
| 24 | congential | 0.37 | 0.34 | 90.04 | |
| 25 | disability nec | 1.16 | 1.12 | 96.55 | |
| 26 | unspecified symptoms | 4.03 | 2.56 | 63.52 | |
-
Note: LTC = Long Term Condition; NEC = not elsewhere classified.
-
Source: ABS 1995 NHS.
There also was a need to separately include an imputation of pregnant women in the model. These women were highly likely to visit a doctor, and regularly so, during their pregnancy. Pregnancy also has significant implications with regard to the use of imaging, pathology, hospital and pharmaceutical services for women in the 18–45 year age group. Most pregnant women were likely to have at least one hospital visit, use imaging services and were highly unlikely to be taking most prescription medications.
The prevalence of short-term health conditions had to be uprated to give a representation of the 2001 world. The age-sex specific rates of change in the prevalence of the long-term elements of the different conditions between 1995 and 2001 were calculated, and in the absence of any other information, these rates of change were used to up-rate the prevalence of the short-term conditions.
4.2 Predictors of having a short-term health condition
Variables that would be good predictors of the likelihood of having various short-term health conditions were investigated using logistic regression modelling and the data from the 1995 NHS. The results of this analysis are presented in Table 7. The variables examined included age, sex, equivalent income decile, self-assessed health status, marital status, income unit type, education, labour force status, concession card holder and government benefit recipient.
Likelihood of having a short-term health condition.
| Variable | Crude Odds Ratio | Comment on crude odds ratio | Odds Ratio (adjusted for age and sex) | Odds ratio (adjusted for age, sex and SAHS) |
|---|---|---|---|---|
| Age group (treated as a continuous variable) | 1.129 | Significant, appears to have close to linear relationship | ||
| Sex 1 Male vs 2 Female | 0.60 | Significant | ||
| Equivalent Income decile | Significant as a group but non linear | |||
| 0 NA | 0.759 | 0.753 | 0.707 | |
| 1 1st decile | 0.630 | 0.742 | 0.661 | |
| 2 | 0.881 | 0.844 | 0.693 | |
| 3 | 1.078 | 0.948 | 0.767 | |
| 4 | 0.988 | 0.963 | 0.837 | |
| 5 | 0.769 | 0.863 | 0.777 | |
| 6 | 0.675 | 0.747 | 0.682 | |
| 7 | 0.713 | 0.810 | 0.752 | |
| 8 | 0.812 | 0.894 | 0.846 | |
| 9 | 0.810 | 0.858 | 0.827 | |
| 10 10th decile | 1 | 1 | 1 | |
| Self Assessed Health Status | Significant as a group | |||
| 0 NA | 0.040 | 0.113 | ||
| 1Excellent | 0.056 | 0.081 | ||
| 2 | 0.082 | 0.116 | ||
| 3 | 0.111 | 0.146 | ||
| 4 | 0.264 | 0.307 | ||
| 5 Poor | 1 | 1 | ||
| Marital Status | Significant as a group | |||
| 1 Married | 2.122 | 0.911 | 0.977 | |
| 2 de facto | 1.759 | 1.081 | 1.100 | |
| 3 separated | 2.186 | 0.992 | 0.986 | |
| 4 divorced | 2.697 | 1.040 | 1.084 | |
| 5 widowed | 6.316 | 1.258 | 1.259 | |
| 6 never married | 1 | 1 | 1 | |
| Income unit type | ||||
| 1 Married with dep kids | 0.467 | 0.509 | 0.522 | |
| 2 Married without dep kids | 1.208 | 0.677 | 0.672 | |
| 3 Single parent with dep kids | 0.447 | 0.509 | 0.507 | |
| 4 Single | 0.749 | 0.569 | 0.555 | |
| 5 Out of scope | 0.707 | 0.641 | 0.623 | |
| 9 Incomplete unit | 1 | 1 | 1 | |
| Education | Significant | |||
| 0 Not have higher | 1 | 1 | 1 | |
| qualification | 1.46 | 0.877 | 0.80 | |
| 1 Has higher qualification | ||||
| Labour force status | Significant as a group | |||
| 0 NA | 0.639 | 0.977 | 1.528 | |
| 1 Unemployed | 0.769 | 0.819 | 0.955 | |
| 2 Employed | 0.580 | 0.712 | 0.698 | |
| 3 Not in labour force | 1 | 1 | 1 | |
| Concession card holder (under 1995 rules) | Significant as a group | |||
| 0 NA | 0.630 | 1.245 | 0.080 | |
| 1 Covered | 2.525 | 1.744 | 1.494 | |
| 2 Not covered | 1.241 | 1.176 | 1.203 | |
| 3 Don’t Know | 1 | 1 | 1 | |
| Government benefit recipient 1 Yes vs 2 No | 2.522 | Significant | 1.406 | 1.110 |
-
Source: ABS 1995 NHS.
A monte carlo process of random allocation was used in selecting the records to have short-term health conditions, The probabilities were based on the person’s age, gender and self-assessed health status.
As Table 7 shows there was a significant, near linear relationship between whether a person had a short-term health condition and their age and a significant difference in the likelihood of having short-term health condition between the sexes (Table 7). After adjusting for age and sex, the next most important predictor was self-assessed health status. Equivalent income was not a significant predictor of having a short-term health condition after adjusting for age, sex and self- assessed health status. While the other variables in Table 7 were significant predictors of having a short-term health condition, little additional explanatory power was gained by including them in the regression model.
To annualise short-term health conditions, a fortnightly imputation of conditions was carried out 26 times to represent the full year.
4.3 Validation
Three aspects of the imputation of short term conditions were considered in validation: the replication of the target condition prevalence in the model; the replication of the age-sex distribution of those with the various conditions and the replication of the distribution of the number of conditions experienced by a person. In general, the model slightly underestimated the prevalence of short-term health conditions. In terms of comparing the demographic profile of those who were allocated to have various conditions to the demographic profile of the 1995 NHS, only two condition groups (injury and poisoning, and preventative) did not perform reasonably well based on a mean cell absolute difference of less than 5 (to summarise these results the absolute mean error for each level in the variable was summed to give the sum of absolute difference and the average cell absolute difference across the variable levels was calculated). These two conditions appear to have undergone the most change in the five years between 1995 and 2001. The distribution of the number of short-term health conditions experienced per person in a two week period was very similar between the 1995 NHS and the HealthMod imputation (Figure 1). However, the number of persons without a short-term health condition was 28.8 per cent in HealthMod compared with 21.3 per cent in 1995 NHS data.
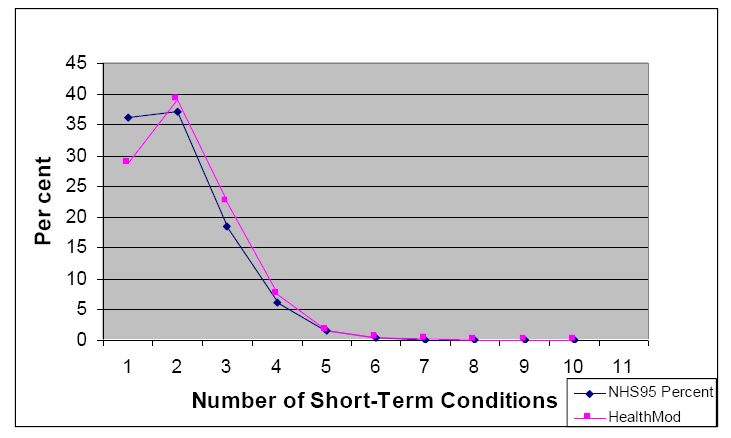
Distribution of number of short term health conditions per person.
Data source: HealthMod; ABS 1995 NHS.
5. Imputation of doctor visits
The imputation of doctor services is a key aspect of the modelling of Medicare. These services dominate both the services used and the overall cost of the MBS. A summary of the methodology for imputing visits to doctors and their costs within a two-week window is as follows:
Determine the probability of a person having a doctor’s visit based on the health condition/s they had, as well as their income, age group and sex. Monte carlo simulation is used to allocate whether a record had a doctor’s visit in a two week time period. Seasonality was imposed by scaling the probabilities of having a doctor’s visit based on the monthly fluctuations in administrative data from Medicare Australia (averaged over 3 years 2001–2003).
Determine primary health condition leading to a doctor’s visit. A cumulative probability distribution was created based on the conditions allocated to the person and the likelihood of having that health condition. A monte carlo simulation was used to allocate which condition the person had that was the primary reason for a doctor’s visit in the two week window.
Determine the distribution of the number of doctor visits amongst those who had a doctor’s visit (from 1 to 10), based on the condition that was the primary reason of a doctor’s visit in the last two weeks, income group, age group and sex of the record (from 1995 NHS).
Allocate the doctor visits to being a GP or specialist using a logistic regression model where age, income, self-assessed health status and number of long-term health conditions were the predictor variables. This model was determined from the 2001 NHS.
Allocate doctor visits to a broad type of service (BTOS) category based on GP/other, age and sex. Probabilities are determined from Medicare Australia data.
Allocate the doctor visits to either bulk billed or not, based on GP/other, BTOS, age and sex (each year was individually constrained as there was a trend of decreasing bulk billing in some of the key BTOS categories)
Align number of services for each BTOS category stimulated in HealthMod against Medicare Australia administrative data.
Cost services, allocating an average cost based on the age and sex of the persons as well BTOS, if the service was bulk billed or not, and if the service was provided by a GP or not. The total annual cost is the sum of the costs.
Align costs for each BTOS category stimulated in HealthMod against Medicare Australia administrative data.
Repeat the steps 26 times to annualise doctor visits.
The imputation of two types of services was problematic: obstetric visits and radiotherapy and therapeutic nuclear medicine. These services can only be allocated to records with a particular condition. Consequently, more care was required in the allocation to the correct type of record and also ensuring the correct numbers of people across the year were receiving the service so that the average number of services per person was within reasonable tolerances.
The allocation of radiotherapy and nuclear medicine services was limited to those patients with cancer. All these services were deemed to have been provided by a specialist medical practitioner since 99 per cent of these services in Australia are provided by a specialist.
The allocation of obstetric visits was carried out as a separate process to the general allocation of doctor services. The first stage in the allocation of obstetric visits was to identify women who gave birth in 2001 and 2002. The two years are required as some women who were pregnant in 2001 would not have given birth until 2002. The target was to have approximately 242,000 confinements in 2001. This was based on the number of registered births (246,400) then factoring for the number of pregnancies that result in multiple births. The age of the woman was used to condition the probability of being pregnant, as was information obtained from the 2001 NHS about their reproductive history (e.g. hysterectomies, infertility etc) to determine women in reproductive age group who could not be pregnant as well as women who had responded in the 2001 NHS such that it was clear they were pregnant during 2001.
Having allocated confinements, this information was used to determine when women were pregnant. It was assumed that women were pregnant for the 8 months prior to the month of birth as well as in the month they gave birth. Premature births were not modelled (about 8 per cent of births in Australia are pre-term). Women receiving specific obstetric services through the MBS were then allocated.
The initial allocation used the assumption that women who have concessional cards are more likely to use either hospital services, midwives or visit a general practitioner. Obstetric services were then allocated based on the number of months in the year the woman was pregnant for and also the stage of her pregnancy (i.e. women in the last months of their pregnancy received more services than women in their first trimester). The number of confinements resulting in a multiple birth is around 1.5 per cent in Australia. Additional use of services related to multiple births was not modelled.
5.1 Model results
Overall, the model estimated that in any two week window approximately 4.57 million (24 per cent) Australians visited a doctor. This was within 2 per cent of the number enumerated in the 2001 NHS (4.63m). Approximately 3.53 million people were estimated to have had only one visit to a doctor (approximately 77 per cent of those who had a visit to a doctor) (Table 8). Less than 1 per cent of those that visited a doctor were estimated to have 5 or more visits in a fortnight. The distribution of the number of doctor visits per person was very similar to that reported in the 1995 NHS which included visits for both short- and long-term illnesses. The model performed equally well when the number of doctor visits was examined by age and gender. The main reason allocated for the last visit to a doctor was preventative (1.02 million, 22.5 per cent), followed by respiratory conditions (0.66m; 14.6 per cent) and other musculoskeletal conditions (0.48m; 10.7 per cent) (Table 9). In total, the model estimated that 142 million doctor services were supplied in 2001, over-estimating the administrative record of MBS services by 5 per cent. Of these services 68 percent were un-referred attendances to a general practitioner and a further 15 per cent were for specialist services (Table 10). HealthMod performed relatively well in estimating both these broad types of services.
Distribution of frequency of a doctor’s visit, 2001.
| Frequency of Doctor’s Visit | HealthMod | No.% | NHS95 | No.% | Absolute Difference | % Diff. |
|---|---|---|---|---|---|---|
| 1 | 3,533,937 | 77.35 | 3,231,795 | 76.83 | 302,142 | 9.35 |
| 2 | 828,385 | 18.13 | 732,739 | 17.42 | 95,646 | 13.05 |
| 3 | 142,938 | 3.13 | 144,020 | 3.42 | 1,082 | 0.75 |
| 4 | 49,542 | 1.08 | 60,825 | 1.45 | 11,283 | 18.55 |
| 5 | 9,593 | 0.21 | 17,051 | 0.41 | 7,458 | 43.74 |
| 6 | 748 | 0.02 | 7,735 | 0.18 | 6,987 | 90.33 |
| 7 | 2,201 | 0.05 | 5,620 | 0.13 | 3,419 | 60.83 |
| 8 | 0 | 0.00 | 281 | 0.01 | 281 | 100.00 |
| 9 and over | 1,213 | 0.03 | 6,507 | 0.15 | 5,294 | 81.36 |
Primary reasons for a doctor’s visit, 2001.
| Condition Group Name | HealthMod | NHS95 | Absolute Difference | % Diff. | |||
|---|---|---|---|---|---|---|---|
| No. | % | No. | % | ||||
| 1 | Arthritis | 83,102 | 1.8 | 80,294 | 1.92 | 2,808 | 3 |
| 2 | Asthma | 92,614 | 2.0 | 85,203 | 2.04 | 7,411 | 9 |
| 3 | Diabetes | 50,058 | 1.1 | 36,357 | 0.87 | 13,701 | 38 |
| 4 | Heart & Circulatory Dis. | 222,438 | 4.9 | 248,960 | 5.95 | 26,522 | 11 |
| 5 | Mental Health | 237,551 | 5.2 | 101,921 | 2.44 | 135,630 | 133 |
| 6 | Cancer | 47,680 | 1.0 | 67,662 | 1.62 | 19,982 | 30 |
| 7 | Injury and Poisoning | 404,858 | 8.9 | 230,795 | 5.52 | 174,063 | 75 |
| 8 | Other Musculoskeletal | 484,887 | 10.6 | 258,942 | 6.19 | 225,945 | 87 |
| 9 | Other endocrine | 82,916 | 1.8 | 68,879 | 1.65 | 14,037 | 20 |
| 10 | Respiratory | 661,795 | 14.5 | 713,950 | 17.07 | 52,155 | 7 |
| 12 | Eye and adnexa | 70,612 | 1.5 | 71,758 | 1.72 | 1,146 | 2 |
| 13 | Ear and mastoid | 114,307 | 2.5 | 128,297 | 3.07 | 13,990 | 11 |
| 14 | Nervous system | 99,963 | 2.2 | 47,965 | 1.15 | 51,998 | 108 |
| 15 | Infectious disease | 145,684 | 3.2 | 103,486 | 2.47 | 42,198 | 41 |
| 16 | Digestive | 125,438 | 2.7 | 151,064 | 3.61 | 25,626 | 17 |
| 18 | Genitor-urinary | 85,042 | 1.9 | 131,022 | 3.13 | 45,980 | 35 |
| 19 | Skin and subcutaneous | 200,967 | 4.4 | 233,831 | 5.59 | 32,864 | 14 |
| 20 | Blood disease | 11,717 | 0.3 | 14,214 | 0.34 | 2,497 | 18 |
| 21 | Pregnancy and childbirth | 40,170 | 0.9 | 76,677 | 1.83 | 36,507 | 48 |
| 22 | Signs and symptoms | 273,554 | 6.0 | 252,137 | 6.03 | 21,417 | 8 |
| 23 | Preventative | 1,024,505 | 22.4 | 1,041,530 | 24.9 | 17,025 | 2 |
| 24 | Congenital abnormality | 7,624 | 0.2 | 4,127 | 0.1 | 3,497 | 85 |
| 25 | Disability | 204 | 0.0 | 2,383 | 0.06 | 2,179 | 91 |
| 26 | Other | 872 | 0.0 | 31,047 | 0.74 | 30,175 | 97 |
Total doctor services, by broad type of service, 2001.
| BTOS | Name | Medicare Aust. | HealthMod | Absolute Difference | % Difference |
|---|---|---|---|---|---|
| 0101 | Un-referred attendances – GP | 91,952,523 | 95,998,090 | 4,045,567 | 4.4 |
| 0102 | Un-referred attendances -enhanced primary care | 323,056 | 503,860 | 180,804 | 56.0 |
| 0103 | Un-referred attendances – other | 8,059,031 | 9,321,414 | 1,262,383 | 15.7 |
| 0200 | Specialist attendances | 19,656,169 | 19,164,702 | 491,467 | −2.5 |
| 0300 | Obstetrics | 1,470,160 | 1,459,591 | 10,569 | −0.7 |
| 0400 | Anaesthetics | 2,140,921 | 1,979,525 | 161,396 | −7.5 |
| 0700 | Operations | 6,039,494 | 6,726,906 | 687,412 | 11.4 |
| 0800 | Assistance at operations | 279,281 | 309,925 | 30,644 | 11.0 |
| 1000 | Radiotherapy and therapeutic nuclear medicine | 642,033 | 599,165 | 42,868 | −6.7 |
| 1100 | Miscellaneous | 5,525,245 | 5,436,272 | 88,973 | −1.6 |
| Total | 134,617,753 | 141,499,450 | 6,881,697 | 5.1 |
5.2 Costing of doctor services
The initial step towards costing of doctor services was the allocation of whether the services were bulk-billed or not. The services that are bulk-billed have the same charge and benefit. Bulk-billing was randomly allocated based on the type of service and whether the service was provided by a general practitioner. For obstetric services the bulk-billing of services was also conditioned by the age of the woman.
Costing of obstetric doctor services was trialed to see if the methodology for attaching cost of services was appropriate. Obstetrics was chosen for this initial trial as it had one of the best outcomes with regard to validation of number of services provided and the number of people receiving these services (Table 10). Administrative data from Medicare Australia was used in the determination of costs of services. The average rates charged for the type of service based on whether it was provided by a GP or specialist, and whether the service was bulk-billed or not, were attached to the records of women who have used the service. The total charge to a record is simply the number of services multiplied by the average cost per service.
Data on the benefit received for services as supplied by Medicare Australia was the average across those that were and were not receiving the Medicare safety net. Thus, consideration needs to be given to possible adjustments to ensure that those on safety net receive more benefit and those not on safety net receive less benefit before the final benefit received by those that used the service is attributed.
Finally, out-of-pocket cost is then simply the difference between the rate charged and the benefit received.
The results from this process look reasonable with HealthMod producing estimates for total charges for obstetric service (excluding hospital services) within 10 per cent of the Medicare Australia expenditure target.
6. Conclusions
Microsimulation modelling of the health sector is exceptionally challenging, in part because of the complexity of the system but also because of the limitations with data availability and quality. Three main steps were taken to overcome limitations in the Australian 2001 NHS survey as the base file for HealthMod.
For the purposes of the HealthMod project, it was important to enhance the 2001 NHS confidentialised unit record file to include family structure. This allows the modelling of key policy issues, such as safety net thresholds, which are measured at the family level not the person level. To achieve this enhancement, statistical matching was used. The quality of the matching is dependent on the variables constrained in the matching process. These variables need to reflect the aim of the matching. For HealthMod, the emphasis was on trying to get family structure in terms of income unit type and income levels as close as possible to reported distributions. The statistical matching allowed the retention of the health information available on 2001 NHS whilst borrowing the family structure from another national survey. Overall, the synthetic families created through the statistical matching are of a sufficient quality to provide confidence in the income unit level analyses.
The results from the validation of short-term health conditions indicate that recent illness is being adequately represented on HealthMod in comparison to the earlier 1995 NHS. There are no alternative data sources to allow external benchmarking. Because the pattern of visits to a doctor are based on health conditions (both longterm and short-term), as well as socio-economic factors, it was important to ensure the imputation of short-term health conditions was reliable. This appears to have been achieved.
The estimates on doctor visits produced by HealthMod also satisfactorily approximate the distributions within the 1995 NHS as well as administrative data from Medicare Australia.
In conclusion, the application of the methods outlined above and use of complementary data sets have significantly improved the usefulness of the 2001 NHS as a basefile for HealthMod. This has enabled improved modelling of the Australian Medicare system, a key policy platform for ensuring all Australians have access to free or low cost health services.
References
-
1
Enhancing the Australian National Health Survey Data for Use in a Microsimulation Model of Pharmaceutical Drug Usage and CostJournal of Artificial Societies and Social Simulation.
-
2
Household Expenditure Survey, Australia, User Guide, 1998–1999Household Expenditure Survey, Australia, User Guide, 1998–1999, Catalogue No. 6527.0, Canberra.
-
3
National Health Survey: User’s Guide, 2001National Health Survey: User’s Guide, 2001, Catalogue No. 4363.0.55.001, Canberra.
-
4
Occasional Paper: Long-term Health Conditions – A Guide to Time Series Comparability from the National Health Survey, AustraliaOccasional Paper: Long-term Health Conditions – A Guide to Time Series Comparability from the National Health Survey, Australia, Catalogue No. 4816.0.55.001, Canberra.
-
5
Occasional Paper: Health Risk Factors – a Guide to Time Series Comparability from the National Health Survey, AustraliaOccasional Paper: Health Risk Factors – a Guide to Time Series Comparability from the National Health Survey, Australia, Catalogue No. 4826.0.55.001, Canberra.
-
6
Health expenditure Australia 2005–06Health expenditure Australia 2005–06, Health and Welfare Expenditure Series no. 30. Cat. no. HWE 37. AIHW, Canberra.
-
7
GIS and microsimulation for local labour market policy analysisComputers, environment and Urban Systems 24:305–330.
-
8
Using a spatial microsimulation decision support system for policy scenario analysisIn: JP. van Leeuwen, HJP Timmermans, editors. Recent Advances in Design and Decision Support Systems in Architecture and Urban Planning. The Netherlands: Kluwer Academic Publishers. pp. 177–191.
-
9
Building a spatial microsimulation-based planning support system for local policy analysisEnvironment and Planning A 39:2482–2499.
-
10
Australian Parliamentary Library Current Issues E-Brief @Medicare Background Brief, Australian Parliamentary Library Current Issues E-Brief @, www.aph.gov.au/library/intguide/SP/medicare.htm.
-
11
General Practice Activity in Australia 2003–04Canberra: Australian Institute of Health and Welfare.
-
12
Moving Towards an Improved MicroSimulation Model of the Australian Pharmaceutical Benefits SchemeAustralian Economic Review 37:41–61.
-
13
The Uses of Microsimulation Modelling, Review and RecommendationsStatistical matching and microsimulation models, The Uses of Microsimulation Modelling, Review and Recommendations, 1, National Academy Press, Washington.
-
14
http://www9.health.gov.au/mbs/Medicare Benefits Schedule.
- 15
- 16
-
17
Intergenerational Report 2010 Australia to 2050: future challenges Canberra, Commonwealth of AustraliaIntergenerational Report 2010 Australia to 2050: future challenges Canberra, Commonwealth of Australia.
- 18
-
19
Statistical Matching: Pitfalls of Current ProceduresStatistical Matching: Pitfalls of Current Procedures, in Proceedings of the, Annual Meeting of the American Statistical Association, August 5–9, 2001.
-
20
Report on Exact and Statistical Matching Techniques, Statistical Policy Working Paper 5, U.S. Government Printing OfficeReport on Exact and Statistical Matching Techniques, Statistical Policy Working Paper 5, U.S. Government Printing Office.
-
21
Statistical Matching: A Frequentist Theory, Practical Applications, and Alternative Bayesian ApproachesSpringer-Verlag.
-
22
An Evaluation of Statistical MatchingJournal of Business and Economic Statistics, 2, 1, January.
-
23
Combining sample and census data in small area estimates: Iterative proportional fitting with standard softwareThe Professional Geographer 57:222–234.
-
24
Creating Order out of Chaos? Identifying Homogeneous Groups of Households Across Multiple DatasetsPaper presented at the, 26th General Conference of the International Association for Research in Income and Wealth, Cracow, Poland, 27 August to 2 September.
-
25
Statistical Matching of the HES and NHS: An Exploration of Issues in the Use of Unconstrained and Constrained Approaches in Creating a Basefile for a Microsimulation Model of the Pharmaceutical Benefits Scheme. ABS Methodology Advisory Committee PaperStatistical Matching of the HES and NHS: An Exploration of Issues in the Use of Unconstrained and Constrained Approaches in Creating a Basefile for a Microsimulation Model of the Pharmaceutical Benefits Scheme. ABS Methodology Advisory Committee Paper, June.
-
26
Using Mahalanobis distance-based record linkage for disclosure risk assessment233–242, Privacy in Statistical Databases, LNCS 4302.
Article and author information
Author details
Acknowledgements
The construction of the current version of the HealthMod model was supported by an Australian Research Council linkage grant (no. LP0454275), a National Health and Medical Research Council Health Service Research Grant (Grant ID 334114) and by Industry Partners to the grant – Medicare Australia, the Productivity Commission, the Australian Bureau of Statistics, the Australian Institute of Health and Welfare, and the NSW Department of Health.
Publication history
- Version of Record published: December 31, 2011 (version 1)
Copyright
© 2011, Lymer et al.
This article is distributed under the terms of the Creative Commons Attribution License, which permits unrestricted use and redistribution provided that the original author and source are credited.