Challenges and solutions in constructing a microsimulation model of the use and costs of medical services in Australia
- University of Canberra, Australia
- Department of Treasury, Langton Crescent, Australia
Cite this article
as: S. Lymer, L. Brown, A. Harding, A. Payne; 2011; Challenges and solutions in constructing a microsimulation model of the use and costs of medical services in Australia; International Journal of Microsimulation; 4(3); 17-31.
doi: 10.34196/ijm.00057
- Article
- Figures and data
- Jump to
Figures
Figure 1
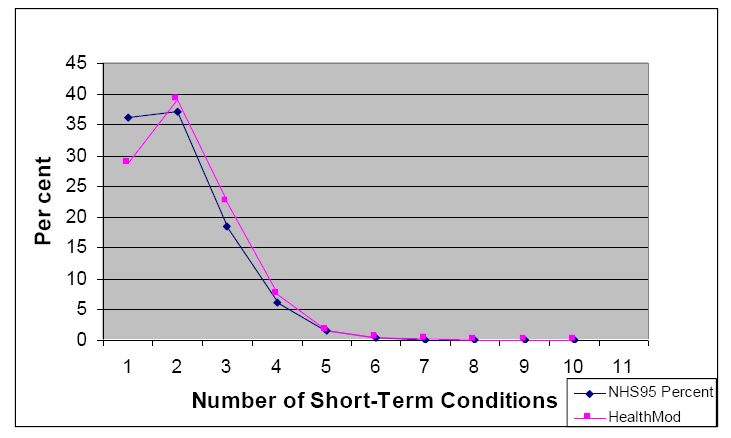
Distribution of number of short term health conditions per person.
Data source: HealthMod; ABS 1995 NHS.
Tables
Table 1
Medicare subsidised medical services and benefits paid by MBS category (processed by Medicare Australia July 2005 to June 2006).
| MBS Category | No. Services (‘000,000) | Benefit ($m) | No. Services per 1,000 pop. | Benefit ($) per 1,000 pop. |
|---|---|---|---|---|
| 1 Professional Attendances | 1,260.5 | 5,266.0 | 6,118.3 | 255,602.7 |
| 2 Diagnostic Procedures and Investigations | 43.3 | 251.2 | 210.3 | 12,190.9 |
| 3 Therapeutic Procedures | 153.4 | 1,790.6 | 744.7 | 86,914.5 |
| 4 Oral and Maxillofacial Services (by Approved Dental Practitioners) | 0.7 | 8.5 | 3.6 | 414.4 |
| 5 Diagnostic Imaging Services | 149.2 | 1,609.4 | 724.3 | 78,118.7 |
| 6 Pathology Services | 828.9 | 1,641.8 | 4,023.3 | 79,693.0 |
| 7 Cleft Lip and Cleft Palate | 0.1 | 1.3 | 0.3 | 61.9 |
| 8 Miscellaneous Services | 37.5 | 407.4 | 181.9 | 19,776.4 |
| Total | 2,473.7 | 10,976.3 | 12,006.9 | 532,772.5 |
-
Source: Medicare Australia website @ www.medicareaustralia.gov.au
Table 2
Closeness of match – age group (percentage distribution).
| Age Group (years) – STINMOD /01A | Age Group (years) – NHS | |||||||||||||||
|---|---|---|---|---|---|---|---|---|---|---|---|---|---|---|---|---|
| 0–4 | 5–9 | 10–14 | 15–19 | 20–24 | 25–29 | 30–34 | 35–39 | 40–44 | 45–49 | 50–54 | 55–59 | 60–64 | 65–69 | 70–74 | 75+ | |
| 0–4 | 79.0 | 18.6 | 2.4 | . | . | . | . | . | . | . | . | . | . | . | . | . |
| 5–9 | 14.4 | 65.4 | 20.1 | . | . | . | . | . | . | . | . | . | . | . | . | . |
| 10–14 | 4.6 | 17.7 | 77.7 | . | . | . | . | . | . | . | . | . | . | . | . | . |
| 15–19 | . | . | . | 69.7 | 13.4 | 7.7 | 5.2 | 0.8 | 0.8 | 0.4 | 1.1 | 0.8 | 0.1 | 0.1 | . | . |
| 20–24 | . | . | . | 26.2 | 28.1 | 18.0 | 8.1 | 5.2 | 6.7 | 3.3 | 1.0 | 1.9 | 1.0 | 0.3 | 0.1 | . |
| 25–29 | . | . | . | 7.1 | 15.2 | 32.8 | 22.0 | 5.7 | 3.8 | 5.1 | 3.3 | 1.5 | 2.6 | 0.8 | 0.2 | . |
| 30–34 | . | . | . | 2.1 | 6.6 | 9.1 | 40.6 | 21.2 | 6.2 | 6.4 | 3.8 | 1.2 | 0.8 | 0.8 | 0.6 | 0.6 |
| 35–39 | . | . | . | 1.2 | 2.7 | 5.8 | 6.7 | 45.0 | 19.4 | 7.6 | 5.0 | 2.6 | 1.3 | 0.9 | 0.6 | 1.0 |
| 40–44 | . | . | . | 0.9 | 1.9 | 3.5 | 5.3 | 10.6 | 43.6 | 15.3 | 10.1 | 3.1 | 2.1 | 1.5 | 1.4 | 0.5 |
| 45–49 | . | . | . | 0.9 | 1.2 | 1.6 | 1.7 | 4.6 | 14.2 | 38.2 | 20.4 | 7.4 | 2.6 | 3.1 | 2.4 | 1.7 |
| 50–54 | . | . | . | 0.1 | 1.0 | 0.8 | 1.0 | 2.8 | 5.8 | 11.9 | 32.4 | 30.4 | 7.5 | 2.4 | 1.1 | 2.9 |
| 55–59 | . | . | . | . | 0.4 | 0.3 | 1 | 1.0 | 2 | 4.7 | 8.6 | 31.8 | 36.1 | 6.4 | 2.8 | 4.8 |
| 60–64 | . | . | . | . | 0 | . | 0.0 | 0.2 | 0.5 | 1.5 | 2.3 | 5.4 | 39.0 | 41.8 | 5.0 | 4.2 |
| 65–69 | . | . | . | . | . | . | 0.1 | 0.2 | 0.3 | 0.5 | 1.0 | 2.3 | 6.2 | 31.7 | 50.3 | 7.4 |
| 70–74 | . | . | . | . | 0.1 | 0.1 | . | 0.1 | 0.2 | 1 | 1.7 | 3.6 | 3.2 | 3.3 | 37.5 | 49.3 |
| 75+ | . | . | . | . | . | . | . | 0.0 | 0.3 | 0.0 | 0.9 | 1.4 | 3.2 | 1.5 | 3.2 | 89.2 |
| All | 9.1 | 8.5 | 6.6 | 6.5 | 4.7 | 5.8 | 7.1 | 8.0 | 7.9 | 6.8 | 6.1 | 5.3 | 4.8 | 3.9 | 3.8 | 5.3 |
Table 3
Closeness of match – equivalent income deciles (percentage distribution).
| Equivalent income decile – STINMOD/01A | Equivalent Income decile – NHS | |||||||||
|---|---|---|---|---|---|---|---|---|---|---|
| 1 | 2 | 3 | 4 | 5 | 6 | 7 | 8 | 9 | 10 | |
| 1 | 69.9 | 16.4 | 13.3 | 0 | 0.1 | 0.1 | 0.2 | . | . | . |
| 2 | 20.5 | 46.3 | 33 | . | . | 0.1 | 0.1 | . | . | . |
| 3 | 7.1 | 24.9 | 67.5 | . | . | 0.3 | 0.3 | . | . | . |
| 4 | . | . | . | 39.4 | 22.6 | 28.4 | 9.6 | . | . | . |
| 5 | . | . | . | 19.1 | 29.1 | 23.7 | 28.0 | . | . | . |
| 6 | . | . | . | 12.3 | 20.3 | 37.4 | 30.0 | . | . | . |
| 7 | . | . | . | 2.4 | 9.7 | 18.0 | 69.9 | . | . | . |
| 8 | . | . | . | . | . | . | . | 67.7 | 30.3 | 1.9 |
| 9 | . | . | . | . | . | . | . | 18.6 | 47.3 | 34.1 |
| 10 | . | . | . | . | . | . | . | 12.3 | 23.6 | 64.1 |
Table 4
Closeness of match – number of persons in household (percentage distribution).
| Number of persons in household – STINMOD/01A | Number of persons in household – NHS | |||||
|---|---|---|---|---|---|---|
| 1 | 2 | 3 | 4 | 5 | 6+ | |
| 1 | 67.0 | 14.9 | 8.0 | 4.4 | 3.0 | 2.6 |
| 2 | 10.0 | 75.8 | 9.7 | 3.3 | 0.9 | 0.3 |
| 3 | 3.4 | 16.5 | 54.1 | 23.2 | 2.5 | 0.3 |
| 4 | 1.8 | 1.4 | 17.1 | 61.2 | 14.9 | 3.7 |
| 5 | 1.5 | 0.9 | 2.6 | 35.1 | 44.6 | 15.4 |
| 6+ | 9.1 12.8 | 1.3 26.6 | 2.4 18.2 | 7.5 25 | 29.4 11.7 | 50.2 |
| All | 12.8 | 26.6 | 18.2 | 25 | 11.7 | 5.7 |
Table 5
Closeness of match – income unit type (percentage distribution).
| Income Unit Type -STINMOD/01A | Income Unit Type – NHS | ||||
|---|---|---|---|---|---|
| Lone person | Couple | Couple with kids | Single with kids | Other | |
| Lone person | 69.7 | . | . | . | 30.3 |
| Couple | . | 100 | . | . | . |
| Couple with kids | . | . | 100 | . | . |
| Single with kids | . | . | . | 100 | . |
| Other | 55.2 | . | . | . | 44.8 |
| All | 18 | 7.1 | 23.1 | 42.4 | 9.4 |
Table 6
Prevalence and long-term characteristics of health condition groups, 1995.
| Health Name | Condition | Group | Prevalence per 100 population | Prevalence as a LTC per 100 population | % LTC (either only or with acute bouts) |
|---|---|---|---|---|---|
| 1 | arthritis | 14.72 | 14.58 | 99.05 | |
| 2 | asthma | 11.30 | 11.09 | 98.10 | |
| 3 | diabetes | 2.47 | 2.45 | 99.15 | |
| 4 | heart and circulatory | 21.42 | 20.02 | 93.45 | |
| 5 | mental health | 5.80 | 4.00 | 69.04 | |
| 6 | cancer | 2.10 | 1.78 | 84.58 | |
| 7 | injury and poisoning | 6.39 | 0.60 | 9.43 | |
| 8 | other muscular | 17.01 | 12.48 | 73.36 | |
| 9 | other endocrine | 10.47 | 7.81 | 74.66 | |
| 10 | respiratory | 32.26 | 23.12 | 71.66 | |
| 11 | visual disturbances | 0.27 | 0.19 | 72.43 | |
| 12 | other eye and adnexa | 49.71 | 48.87 | 98.31 | |
| 13 | ear and mastoid | 12.48 | 11.36 | 91.09 | |
| 14 | nervous system | 3.50 | 2.65 | 75.81 | |
| 15 | infectious disease | 3.73 | 1.03 | 27.66 | |
| 16 | digestive | 10.56 | 7.66 | 72.60 | |
| 17 | dental | 5.06 | 0.12 | 2.44 | |
| 18 | genito-urinary | 6.38 | 3.60 | 56.34 | |
| 19 | skin and subcutaneous | 9.87 | 3.80 | 38.45 | |
| 20 | blood diseases | 2.05 | 1.67 | 81.67 | |
| 21 | pregancy and childbirth | 0.88 | 0.15 | 17.05 | |
| 22 | sign and symptoms | 24.24 | 7.30 | 30.12 | |
| 23 | preventative | 31.92 | 0.02 | 0.06 | |
| 24 | congential | 0.37 | 0.34 | 90.04 | |
| 25 | disability nec | 1.16 | 1.12 | 96.55 | |
| 26 | unspecified symptoms | 4.03 | 2.56 | 63.52 | |
-
Note: LTC = Long Term Condition; NEC = not elsewhere classified.
-
Source: ABS 1995 NHS.
Table 7
Likelihood of having a short-term health condition.
| Variable | Crude Odds Ratio | Comment on crude odds ratio | Odds Ratio (adjusted for age and sex) | Odds ratio (adjusted for age, sex and SAHS) |
|---|---|---|---|---|
| Age group (treated as a continuous variable) | 1.129 | Significant, appears to have close to linear relationship | ||
| Sex 1 Male vs 2 Female | 0.60 | Significant | ||
| Equivalent Income decile | Significant as a group but non linear | |||
| 0 NA | 0.759 | 0.753 | 0.707 | |
| 1 1st decile | 0.630 | 0.742 | 0.661 | |
| 2 | 0.881 | 0.844 | 0.693 | |
| 3 | 1.078 | 0.948 | 0.767 | |
| 4 | 0.988 | 0.963 | 0.837 | |
| 5 | 0.769 | 0.863 | 0.777 | |
| 6 | 0.675 | 0.747 | 0.682 | |
| 7 | 0.713 | 0.810 | 0.752 | |
| 8 | 0.812 | 0.894 | 0.846 | |
| 9 | 0.810 | 0.858 | 0.827 | |
| 10 10th decile | 1 | 1 | 1 | |
| Self Assessed Health Status | Significant as a group | |||
| 0 NA | 0.040 | 0.113 | ||
| 1Excellent | 0.056 | 0.081 | ||
| 2 | 0.082 | 0.116 | ||
| 3 | 0.111 | 0.146 | ||
| 4 | 0.264 | 0.307 | ||
| 5 Poor | 1 | 1 | ||
| Marital Status | Significant as a group | |||
| 1 Married | 2.122 | 0.911 | 0.977 | |
| 2 de facto | 1.759 | 1.081 | 1.100 | |
| 3 separated | 2.186 | 0.992 | 0.986 | |
| 4 divorced | 2.697 | 1.040 | 1.084 | |
| 5 widowed | 6.316 | 1.258 | 1.259 | |
| 6 never married | 1 | 1 | 1 | |
| Income unit type | ||||
| 1 Married with dep kids | 0.467 | 0.509 | 0.522 | |
| 2 Married without dep kids | 1.208 | 0.677 | 0.672 | |
| 3 Single parent with dep kids | 0.447 | 0.509 | 0.507 | |
| 4 Single | 0.749 | 0.569 | 0.555 | |
| 5 Out of scope | 0.707 | 0.641 | 0.623 | |
| 9 Incomplete unit | 1 | 1 | 1 | |
| Education | Significant | |||
| 0 Not have higher | 1 | 1 | 1 | |
| qualification | 1.46 | 0.877 | 0.80 | |
| 1 Has higher qualification | ||||
| Labour force status | Significant as a group | |||
| 0 NA | 0.639 | 0.977 | 1.528 | |
| 1 Unemployed | 0.769 | 0.819 | 0.955 | |
| 2 Employed | 0.580 | 0.712 | 0.698 | |
| 3 Not in labour force | 1 | 1 | 1 | |
| Concession card holder (under 1995 rules) | Significant as a group | |||
| 0 NA | 0.630 | 1.245 | 0.080 | |
| 1 Covered | 2.525 | 1.744 | 1.494 | |
| 2 Not covered | 1.241 | 1.176 | 1.203 | |
| 3 Don’t Know | 1 | 1 | 1 | |
| Government benefit recipient 1 Yes vs 2 No | 2.522 | Significant | 1.406 | 1.110 |
-
Source: ABS 1995 NHS.
Table 8
Distribution of frequency of a doctor’s visit, 2001.
| Frequency of Doctor’s Visit | HealthMod | No.% | NHS95 | No.% | Absolute Difference | % Diff. |
|---|---|---|---|---|---|---|
| 1 | 3,533,937 | 77.35 | 3,231,795 | 76.83 | 302,142 | 9.35 |
| 2 | 828,385 | 18.13 | 732,739 | 17.42 | 95,646 | 13.05 |
| 3 | 142,938 | 3.13 | 144,020 | 3.42 | 1,082 | 0.75 |
| 4 | 49,542 | 1.08 | 60,825 | 1.45 | 11,283 | 18.55 |
| 5 | 9,593 | 0.21 | 17,051 | 0.41 | 7,458 | 43.74 |
| 6 | 748 | 0.02 | 7,735 | 0.18 | 6,987 | 90.33 |
| 7 | 2,201 | 0.05 | 5,620 | 0.13 | 3,419 | 60.83 |
| 8 | 0 | 0.00 | 281 | 0.01 | 281 | 100.00 |
| 9 and over | 1,213 | 0.03 | 6,507 | 0.15 | 5,294 | 81.36 |
Table 9
Primary reasons for a doctor’s visit, 2001.
| Condition Group Name | HealthMod | NHS95 | Absolute Difference | % Diff. | |||
|---|---|---|---|---|---|---|---|
| No. | % | No. | % | ||||
| 1 | Arthritis | 83,102 | 1.8 | 80,294 | 1.92 | 2,808 | 3 |
| 2 | Asthma | 92,614 | 2.0 | 85,203 | 2.04 | 7,411 | 9 |
| 3 | Diabetes | 50,058 | 1.1 | 36,357 | 0.87 | 13,701 | 38 |
| 4 | Heart & Circulatory Dis. | 222,438 | 4.9 | 248,960 | 5.95 | 26,522 | 11 |
| 5 | Mental Health | 237,551 | 5.2 | 101,921 | 2.44 | 135,630 | 133 |
| 6 | Cancer | 47,680 | 1.0 | 67,662 | 1.62 | 19,982 | 30 |
| 7 | Injury and Poisoning | 404,858 | 8.9 | 230,795 | 5.52 | 174,063 | 75 |
| 8 | Other Musculoskeletal | 484,887 | 10.6 | 258,942 | 6.19 | 225,945 | 87 |
| 9 | Other endocrine | 82,916 | 1.8 | 68,879 | 1.65 | 14,037 | 20 |
| 10 | Respiratory | 661,795 | 14.5 | 713,950 | 17.07 | 52,155 | 7 |
| 12 | Eye and adnexa | 70,612 | 1.5 | 71,758 | 1.72 | 1,146 | 2 |
| 13 | Ear and mastoid | 114,307 | 2.5 | 128,297 | 3.07 | 13,990 | 11 |
| 14 | Nervous system | 99,963 | 2.2 | 47,965 | 1.15 | 51,998 | 108 |
| 15 | Infectious disease | 145,684 | 3.2 | 103,486 | 2.47 | 42,198 | 41 |
| 16 | Digestive | 125,438 | 2.7 | 151,064 | 3.61 | 25,626 | 17 |
| 18 | Genitor-urinary | 85,042 | 1.9 | 131,022 | 3.13 | 45,980 | 35 |
| 19 | Skin and subcutaneous | 200,967 | 4.4 | 233,831 | 5.59 | 32,864 | 14 |
| 20 | Blood disease | 11,717 | 0.3 | 14,214 | 0.34 | 2,497 | 18 |
| 21 | Pregnancy and childbirth | 40,170 | 0.9 | 76,677 | 1.83 | 36,507 | 48 |
| 22 | Signs and symptoms | 273,554 | 6.0 | 252,137 | 6.03 | 21,417 | 8 |
| 23 | Preventative | 1,024,505 | 22.4 | 1,041,530 | 24.9 | 17,025 | 2 |
| 24 | Congenital abnormality | 7,624 | 0.2 | 4,127 | 0.1 | 3,497 | 85 |
| 25 | Disability | 204 | 0.0 | 2,383 | 0.06 | 2,179 | 91 |
| 26 | Other | 872 | 0.0 | 31,047 | 0.74 | 30,175 | 97 |
Table 10
Total doctor services, by broad type of service, 2001.
| BTOS | Name | Medicare Aust. | HealthMod | Absolute Difference | % Difference |
|---|---|---|---|---|---|
| 0101 | Un-referred attendances – GP | 91,952,523 | 95,998,090 | 4,045,567 | 4.4 |
| 0102 | Un-referred attendances -enhanced primary care | 323,056 | 503,860 | 180,804 | 56.0 |
| 0103 | Un-referred attendances – other | 8,059,031 | 9,321,414 | 1,262,383 | 15.7 |
| 0200 | Specialist attendances | 19,656,169 | 19,164,702 | 491,467 | −2.5 |
| 0300 | Obstetrics | 1,470,160 | 1,459,591 | 10,569 | −0.7 |
| 0400 | Anaesthetics | 2,140,921 | 1,979,525 | 161,396 | −7.5 |
| 0700 | Operations | 6,039,494 | 6,726,906 | 687,412 | 11.4 |
| 0800 | Assistance at operations | 279,281 | 309,925 | 30,644 | 11.0 |
| 1000 | Radiotherapy and therapeutic nuclear medicine | 642,033 | 599,165 | 42,868 | −6.7 |
| 1100 | Miscellaneous | 5,525,245 | 5,436,272 | 88,973 | −1.6 |
| Total | 134,617,753 | 141,499,450 | 6,881,697 | 5.1 |
Download links
A two-part list of links to download the article, or parts of the article, in various formats.