Projecting the impacts of illness on labour force participation: An application of Health&WealthMOD
- Northern Rivers University, Australia
- University of Canberra, Australia
Cite this article
as: D. Schofield, R. Shrestha, M. Passey, S. Fletcher, S. Kelly, R. Percival; 2011; Projecting the impacts of illness on labour force participation: An application of Health&WealthMOD; International Journal of Microsimulation; 4(3); 37-47.
doi: 10.34196/ijm.00059
- Article
- Figures and data
- Jump to
Figures
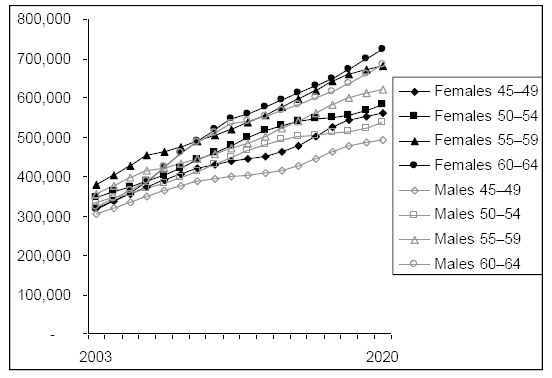
Figure 1

Number of people with chronic health conditions, 2003–2020.
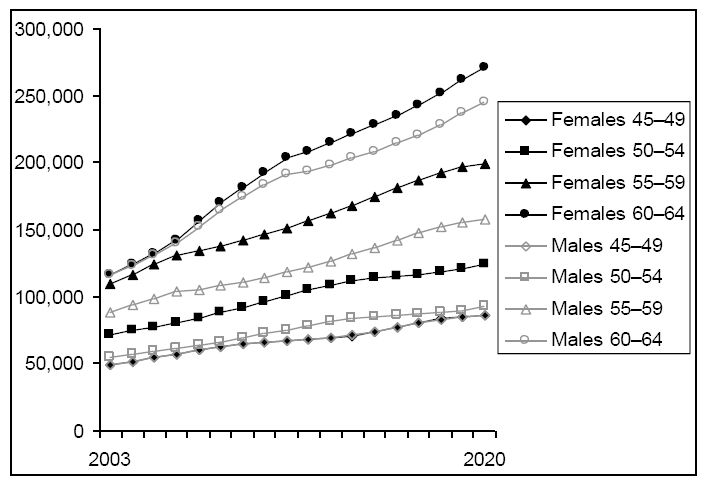
Figure 2

Number of people out of the labour force due to chronic health conditions.
Figure 3

Number of people aged 45–64 years out of the workforce due to chronic health conditions – base and sensitivity projections, Australia 2003–2020.
Tables
Table 1
Persons aged 45–64 years as percentage of working aged population aged 15–64 years by age group and sex.
| Sex | Age group | 2003 | 2010 | 2020 | 2030 | 2040 |
|---|---|---|---|---|---|---|
| Females | 45–49 | 11% | 11% | 11% | 11% | 11% |
| 50–54 | 10% | 10% | 10% | 10% | 11% | |
| 55–59 | 9% | 9% | 10% | 11% | 11% | |
| 60–64 | 6% | 9% | 10% | 10% | 10% | |
| Males | 45–49 | 10% | 11% | 10% | 11% | 11% |
| 50–54 | 10% | 10% | 10% | 10% | 11% | |
| 55–59 | 9% | 9% | 10% | 10% | 10% | |
| 60–64 | 7% | 9% | 9% | 10% | 10% | |
| Total persons | 45–64 | 35% | 39% | 40% | 41% | 42% |
-
Source: ABS population projections (Australian Bureau of Statistics, 2005)
Table 2
Number of people aged 45–64 with chronic health conditions by age and sex, Australia, 2003–2020.
| 2003 | 2010 | 2015 | 2020 | ||
|---|---|---|---|---|---|
| Females | 45–49 | 320,282 | 430,361 | 477,372 | 561,247 |
| 50–54 | 346,969 | 459,330 | 539,280 | 583,131 | |
| 55–59 | 378,388 | 505,277 | 597,730 | 681,067 | |
| 60–64 | 316,535 | 518,663 | 611,101 | 721,683 | |
| Total | 1,362,174 | 1,913,632 | 2,225,484 | 2,547,128 | |
| Males | 45–49 | 305,861 | 395,265 | 427,639 | 491,147 |
| 50–54 | 335,623 | 429,556 | 501,052 | 536,411 | |
| 55–59 | 355,338 | 455,978 | 540,327 | 621,625 | |
| 60–64 | 323,627 | 510,775 | 581,872 | 683,922 | |
| Total | 1,320,450 | 1,791,575 | 2,050,891 | 2,333,105 | |
| Persons | 45–49 | 626,143 | 825,626 | 905,012 | 1,052,394 |
| 50–54 | 682,592 | 888,886 | 1,040,333 | 1,119,543 | |
| 55–59 | 733,726 | 961,256 | 1,138,058 | 1,302,692 | |
| 60–64 | 640,162 | 1,029,439 | 1,192,973 | 1,405,605 | |
| Total | 2,682,623 | 3,705,207 | 4,276,375 | 4,880,233 |
Table 3
Percentage of persons aged 45–64 with chronic health conditions by age and sex, Australia, 2003–2020.
| 2003 | 2010 | 2015 | 2020 | ||
|---|---|---|---|---|---|
| Females | 45–49 | 45% | 55% | 63% | 70% |
| 50–54 | 53% | 63% | 69% | 76% | |
| 55–59 | 66% | 75% | 82% | 88% | |
| 60–64 | 74% | 84% | 92% | 99% | |
| Total | 58% | 68% | 76% | 83% | |
| Males | 45–49 | 44% | 51% | 57% | 62% |
| 50–54 | 51% | 60% | 65% | 71% | |
| 55–59 | 61% | 69% | 76% | 82% | |
| 60–64 | 74% | 83% | 90% | 97% | |
| Total | 56% | 65% | 71% | 77% | |
| Persons | 45–49 | 45% | 53% | 60% | 66% |
| 50–54 | 52% | 61% | 67% | 74% | |
| 55–59 | 64% | 72% | 79% | 85% | |
| 60–64 | 74% | 84% | 91% | 98% | |
| Total | 57% | 67% | 73% | 80% |
Table 4
Number of persons aged 45–64 years out of the labour force due to chronic health conditions by age and sex, Australia, 2003–2020.
| 2003 | 2010 | 2015 | 2020 | ||
|---|---|---|---|---|---|
| Females | 45–49 | 49,017 | 66,064 | 73,396 | 86,399 |
| 50–54 | 71,680 | 96,367 | 114,080 | 124,187 | |
| 55–59 | 109,338 | 146,996 | 174,574 | 199,578 | |
| 60–64 | 116,261 | 192,569 | 228,286 | 270,994 | |
| Total | 346,297 | 501,996 | 590,336 | 681,158 | |
| Males | 45–49 | 49,109 | 66,467 | 73,719 | 86,393 |
| 50–54 | 55,075 | 72,278 | 85,482 | 92,565 | |
| 55–59 | 88,041 | 114,448 | 136,624 | 158,164 | |
| 60–64 | 115,902 | 183,091 | 208,687 | 245,398 | |
| Total | 308,126 | 436,285 | 504,512 | 582,521 | |
| Persons | 45–49 | 98,126 | 132,532 | 147,115 | 172,792 |
| 50–54 | 126,755 | 168,645 | 199,561 | 216,752 | |
| 55–59 | 197,379 | 261,445 | 311,199 | 357,742 | |
| 60–64 | 232,163 | 375,660 | 436,973 | 516,393 | |
| Total | 654,423 | 938,281 | 1,094,848 | 1,263,679 |
Table 5
Percentage of persons aged 45–64 years out of the labour force due to chronic health conditions, by age and sex, Australia, 2003–2020.
| 2003 | 2010 | 2015 | 2020 | ||
|---|---|---|---|---|---|
| Females | 45–49 | 7% | 9% | 10% | 11% |
| 50–54 | 11% | 13% | 15% | 16% | |
| 55–59 | 19% | 22% | 24% | 26% | |
| 60–64 | 27% | 31% | 34% | 37% | |
| Total | 15% | 18% | 20% | 22% | |
| Males | 45–49 | 7% | 9% | 10% | 11% |
| 50–54 | 8% | 10% | 11% | 12% | |
| 55–59 | 15% | 17% | 19% | 21% | |
| 60–64 | 26% | 30% | 32% | 35% | |
| Total | 13% | 16% | 17% | 19% | |
| Persons | 45–49 | 7% | 9% | 10% | 11% |
| 50–54 | 10% | 12% | 13% | 14% | |
| 55–59 | 17% | 20% | 21% | 23% | |
| 60–64 | 27% | 31% | 33% | 36% | |
| Total | 14% | 17% | 19% | 21% |
Table 6
Sensitivity analysis of number of people out of the labour force due to chronic health conditions.
| Base projection | High pop growth | Low pop growth | Disease growth *0.5 | Disease growth *1.5 | |||||||
|---|---|---|---|---|---|---|---|---|---|---|---|
| 2003 | 2020 | 2003 | 2020 | 2003 | 2020 | 2003 | 2020 | 2003 | 2020 | ||
| Females | 45–49 | 49,017 | 86,399 | 49,048 | 88,756 | 48,970 | 83,752 | 49,017 | 71,143 | 49,017 | 101,654 |
| 50–54 | 71,680 | 124,187 | 71,718 | 126,657 | 71,624 | 121,441 | 71,680 | 103,680 | 71,680 | 144,693 | |
| 55–59 | 109,338 | 199,578 | 109,386 | 202,280 | 109,271 | 196,512 | 109,338 | 173,959 | 109,338 | 225,196 | |
| 60–64 | 116,261 | 270,994 | 116,309 | 273,598 | 116,194 | 267,888 | 116,261 | 233,856 | 116,261 | 308,133 | |
| Total | 346,297 | 681,158 | 346,461 | 691,290 | 346,059 | 669,594 | 346,297 | 582,639 | 346,297 | 779,676 | |
| Males | 45–49 | 49,109 | 86,393 | 49,149 | 89,061 | 49,049 | 83,406 | 49,109 | 71,314 | 49,109 | 101,473 |
| 50–54 | 55,075 | 92,565 | 55,112 | 94,757 | 55,022 | 90,093 | 55,075 | 78,108 | 55,075 | 107,023 | |
| 55–59 | 88,041 | 158,164 | 88,086 | 160,679 | 87,976 | 155,141 | 88,041 | 136,534 | 88,041 | 179,794 | |
| 60–64 | 115,902 | 245,398 | 115,950 | 247,858 | 115,832 | 241,897 | 115,902 | 215,733 | 115,902 | 275,063 | |
| Total | 308,126 | 582,521 | 308,296 | 592,355 | 307,879 | 570,537 | 308,126 | 501,689 | 308,126 | 663,353 | |
| Persons | 45–49 | 98,126 | 172,792 | 98,197 | 177,816 | 98,019 | 167,158 | 98,126 | 142,457 | 98,126 | 203,127 |
| 50–54 | 126,755 | 216,752 | 126,830 | 221,414 | 126,646 | 211,534 | 126,755 | 181,788 | 126,755 | 251,716 | |
| 55–59 | 197,379 | 357,742 | 197,472 | 362,959 | 197,247 | 351,653 | 197,379 | 310,493 | 197,379 | 404,990 | |
| 60–64 | 232,163 | 516,393 | 232,259 | 521,456 | 232,026 | 509,786 | 232,163 | 449,590 | 232,163 | 583,195 | |
| Total | 654,423 | 1,263,679 | 654,757 | 1,283,645 | 653,938 | 1,240,131 | 654,423 | 1,084,328 | 654,423 | 1,443,029 | |
Download links
A two-part list of links to download the article, or parts of the article, in various formats.