A more efficient sampling procedure, using loaded probabilities
- JR Cumpston Pty Ltd, Australia
Cite this article
as: J. Richard Cumpston; 2012; A more efficient sampling procedure, using loaded probabilities; International Journal of Microsimulation; 5(1); 21-30.
doi: 10.34196/ijm.00065
- Article
- Figures and data
- Jump to
Figures
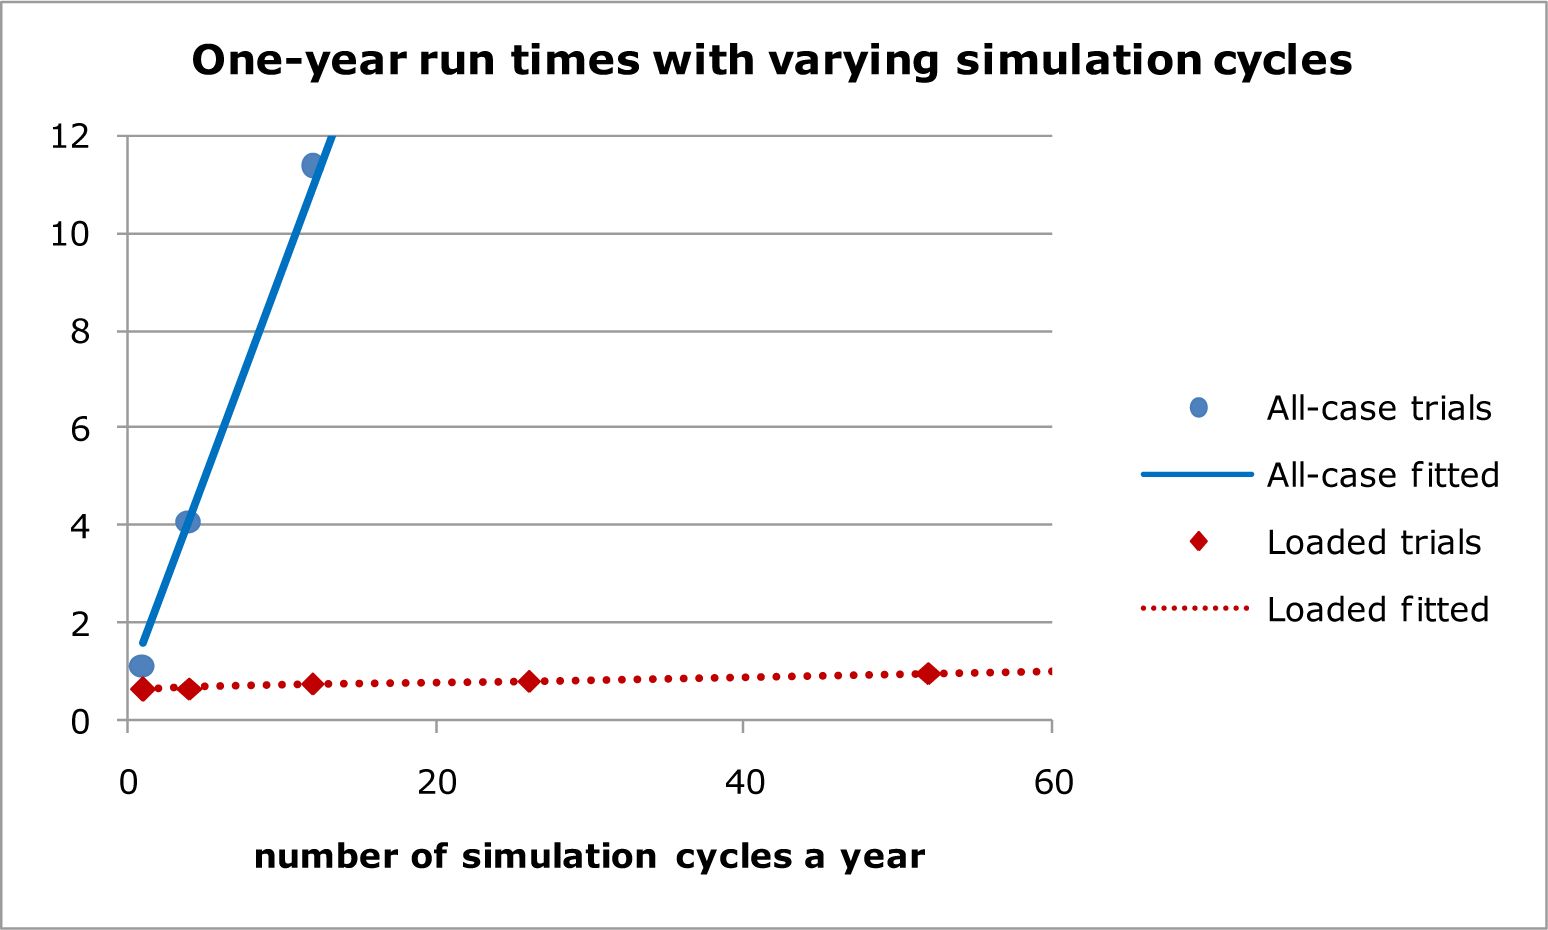
Figure 1
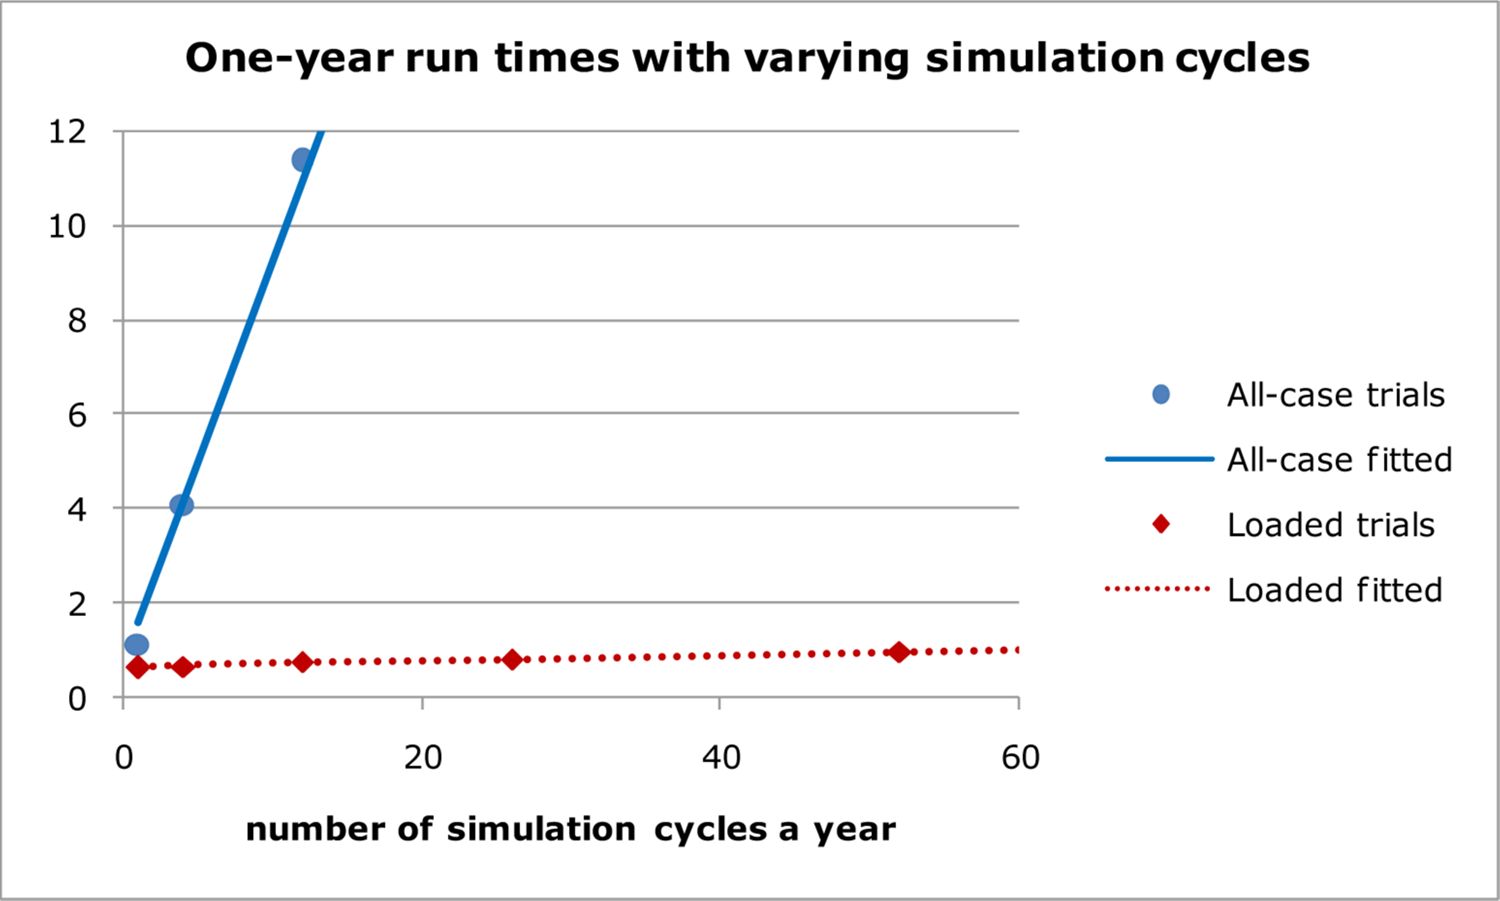
Run times with varying simulation cycles.
Figure 2
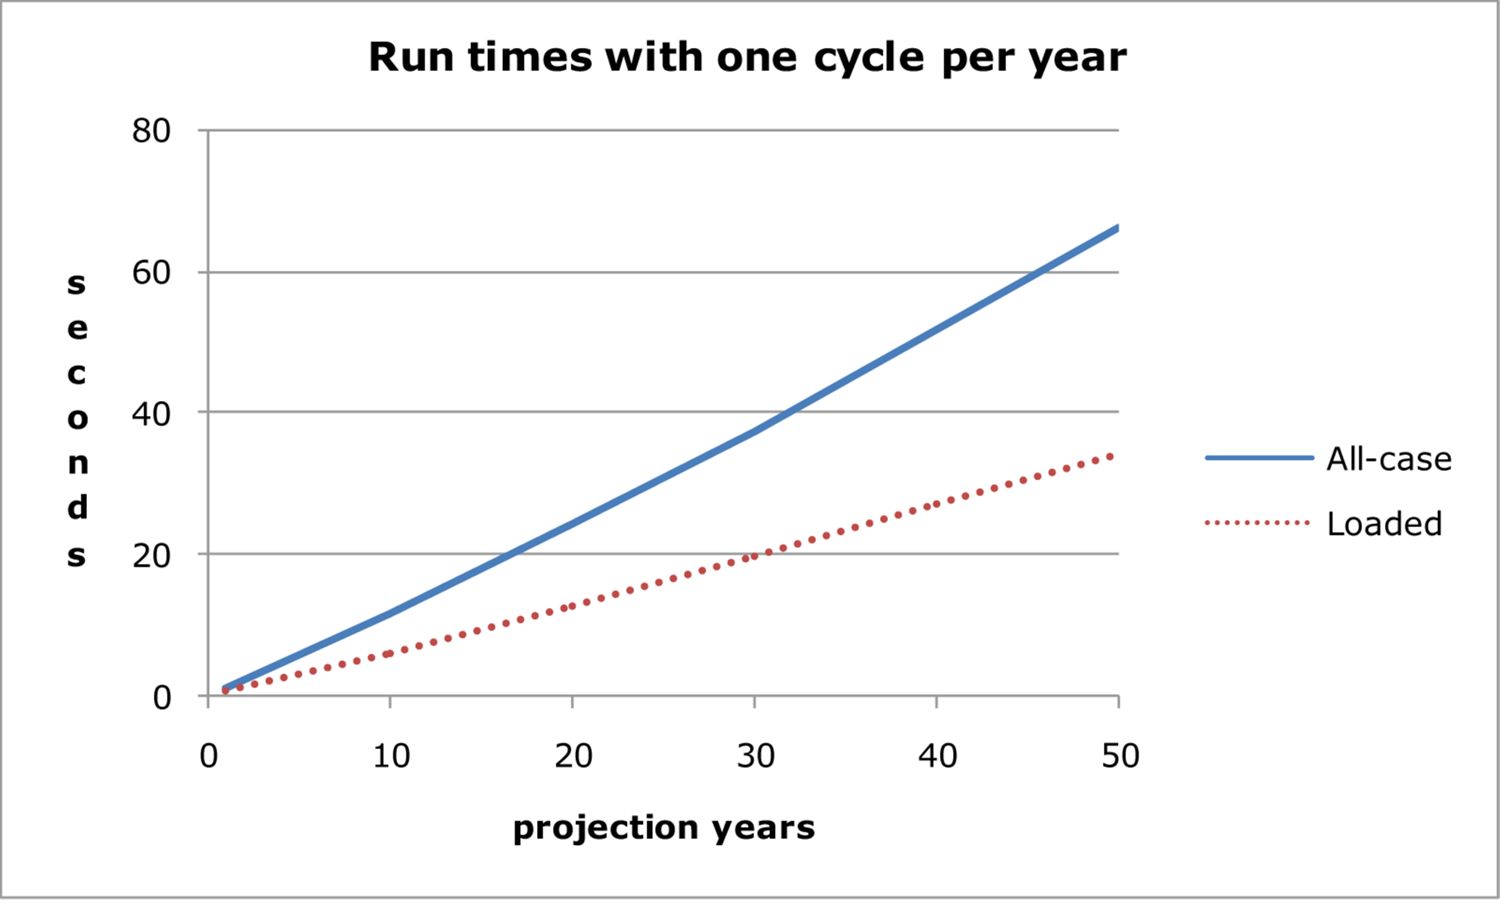
Run times with one cycle per year.
Tables
Table 1
Number of draws to give maximum loaded probability of 1.
| Number in pool | maximum | unloaded | probability | |||
|---|---|---|---|---|---|---|
| 0.01 | 0.02 | 0.05 | 0.1 | 0.2 | 0.5 | |
| 10 | 1 | 1 | 1 | 2 | 3 | 7 |
| 100 | 2 | 3 | 6 | 11 | 23 | 69 |
| 1,000 | 11 | 21 | 52 | 106 | 224 | 693 |
| 10,000 | 101 | 203 | 513 | 1,054 | 2,232 | 6,932 |
| 100,000 | 1,006 | 2,021 | 5,130 | 10,536 | 22,315 | 69,315 |
Table 2
Simulated event numbers with pools chosen to produce 500 events.
| Number low risk persons | Low risk rate | Number high risk persons | High risk rate | Expected number of events | Mean number from 10,000 trials | Standard deviation from 10,000 trials |
|---|---|---|---|---|---|---|
| 2,500 | 0.1 | 500 | 0.5 | 500 | 499.92 | .16 |
| 1,250 | 0.2 | 500 | 0.5 | 500 | 500.12 | .14 |
| 833 | 0.3 | 500 | 0.5 | 500 | 499.88 | .12 |
| 625 | 0.4 | 500 | 0.5 | 500 | 500.03 | .10 |
| 500 | 0.5 | 500 | 0.5 | 500 | 500.00 | .09 |
Table 3
Table Draws needed to simulate the deaths in a year 175,000 Australians.
| Age group | Persons in group | Average mortality rate | Expected deaths | Maximum mortality rate | Draws |
|---|---|---|---|---|---|
| 0- | 36,441 | 0.00040 | 14.5 | 0.00453 | 166 |
| 15- | 23,593 | 0.00060 | 14.1 | 0.00113 | 27 |
| 25- | 25,575 | 0.00087 | 22.1 | 0.00138 | 36 |
| 35- | 26,810 | 0.00123 | 33.0 | 0.00192 | 52 |
| 45- | 24,156 | 0.00237 | 57.2 | 0.00415 | 101 |
| 55- | 16,348 | 0.00642 | 104.9 | 0.01315 | 217 |
| 65- | 11,852 | 0.01826 | 216.4 | 0.03697 | 447 |
| 75- | 7,706 | 0.05051 | 389.3 | 0.10627 | 866 |
| 85- | 2,563 | 0.18238 | 467.4 | 0.48496 | 1701 |
| Total | 175,044 | 0.00754 | 1,319.0 | 3,613 |
Table 4
Areas, person types and age groups used to form pools.
| Area code | Area name | Person type code | Person type | Age code | Age group |
|---|---|---|---|---|---|
| 1 | NSW | 1 | Partner | 1 | 0–14 |
| 2 | Victoria | 2 | Lone parent | 2 | 15–24 |
| 3 | Queensland | 3 | Child | 3 | 25–34 |
| 4 | SA | 4 | Related person | 4 | 35–44 |
| 5 | WA | 5 | Unrelated person | 5 | 45–54 |
| 6 | Tasmania | 6 | Lone person | 6 | 55–54 |
| 7 | NT | 7 | Group member | 7 | 65–74 |
| 8 | ACT | 8 | Non-private resident | 8 | 75–84 |
| 9 | 85- |
Table 5
Mean run times in seconds to simulate 175,000 Australians for a year.
| Cycles per year | All-case trials seconds | All-case fitted seconds | Loaded trials seconds | Loaded fitted seconds | Loaded trials as % of all-case |
|---|---|---|---|---|---|
| 1 | 1.13 | 1.58 | 0.64 | 0.66 | 57% |
| 4 | 4.10 | 4.14 | 0.67 | 0.68 | 16% |
| 12 | 11.37 | 10.98 | 0.75 | 0.73 | 7% |
| 26 | 23.29 | 22.94 | 0.83 | 0.82 | 4% |
| 52 | 44.90 | 45.15 | 0.98 | 0.97 | 2% |
| 365 | 2.88 | 2.88 |
Table 6
Run times in seconds for projections up to 50 years.
| Projection years | All-case Yearly | Loaded Yearly | Loaded Weekly | Loaded as% of all case Yearly |
|---|---|---|---|---|
| 1 | 1.13 | 0.64 | 0.98 | 57% |
| 10 | 11.59 | 6.18 | 9.81 | 53% |
| 20 | 24.28 | 12.82 | 20.28 | 53% |
| 30 | 37.35 | 19.72 | 31.2 | 53% |
| 40 | 51.93 | 27.25 | 42.51 | 52% |
| 50 | 66.32 | 34.16 | 53.87 | 52% |
Table 7
Event totals from one-year projections, each event simulated separately (50 run averages).
| Event | Expected | Observed all-case yearly | Observed loaded yearly | Observed loaded weekly |
|---|---|---|---|---|
| Births | 2,170 | 2,179 | 2,183 | 2,208 |
| Deaths | 1,372 | 1,379 | 1,330 | 1,370 |
| Emigrants | 2,284 | 2,280 | 2,251 | 2,275 |
| Exits | 6,254 | 6,441 | 6,203 | 6,592 |
| Moves | 12,468 | 12,411 | 12,330 | 12,364 |
Table 8
Event totals from one-year projections, all events simulated together.
| Event | Expected | Observed all-case yearly | Observed loaded yearly | Observed loaded weekly |
|---|---|---|---|---|
| Births | 2,170 | 2,175 | 2,182 | 2,232 |
| Deaths | 1,372 | 1,375 | 1,335 | 1,375 |
| Emigrants | 2,284 | 2,282 | 2,263 | 2,304 |
| Exits | 6,254 | 6,333 | 6,075 | 6,611 |
| Moves | 12,468 | 13,418 | 13,210 | 12,826 |
Table 9
Table one-year projections, with events in normal & reverse order (50 run averages).
| Event | Yearly | Weekly | ||||
|---|---|---|---|---|---|---|
| normal order | reverse order | change in year | normal order | reverse order | change in year | |
| Births | 2,182 | 2,243 | 61 | 2,232 | 2,224 | -8 |
| Deaths | 1,335 | 1,331 | -4 | 1,375 | 1,378 | 3 |
| Emigrants | 2,263 | 2,308 | 45 | 2,304 | 2,311 | 7 |
| Exits | 6,075 | 6,540 | 465 | 6,611 | 6,615 | 4 |
| Moves | 13,210 | 12,323 | -887 | 12,826 | 12,819 | -7 |
Table 10
50-year projections with yearly cycles (10 run averages).
| Event/persons at end | All-case yearly mean | All-case yearly SD | Loaded yearly mean | Loaded yearly SD | Loaded as % of all-case |
|---|---|---|---|---|---|
| Births | 102,831 | 541 | 101,611 | 516 | 98.8% |
| Deaths | 92,205 | 127 | 91,924 | 130 | 99.7% |
| Emigrants | 123,775 | 186 | 123,024 | 232 | 99.4% |
| Exits | 355,304 | 891 | 347,052 | 746 | 97.7% |
| Moves | 797,511 | 1,716 | 778,254 | 937 | 97.6% |
| Persons at end | 226,755 | 488 | 226,566 | 504 | 99.9% |
Table 11
Standard deviations for one-year projections (based on 50 runs).
| Event | All-case Yearly | All-case Yearly | Loaded Yearly | Loaded Yearly | Loaded weekly | Loaded weekly |
|---|---|---|---|---|---|---|
| Expected | Observed | Expected | Observed | Expected | Observed | |
| Births | 43.8 | 38.6 | 43.6 | 38.7 | 43.5 | 52.8 |
| Deaths | 35.4 | 32.7 | 28.0 | 29.9 | 31.7 | 32.2 |
| Emigrants | 47.3 | 38.6 | 26.2 | 35.6 | 36.5 | 42.8 |
| Exits | 73.7 | 67.6 | 33.2 | 39.8 | 54.7 | 59.6 |
| Moves | 98.3 | 99.7 | 10.3 | 18.9 | 50.0 | 55.1 |
Table 12
Observed coefficients of variation for one-year projections (based on 50 runs).
| Event | All-case Yearly | Loaded yearly | Loaded weekly |
|---|---|---|---|
| Births | 0.018 | 0.018 | 0.024 |
| Deaths | 0.024 | 0.022 | 0.023 |
| Emigrants | 0.017 | *0.016 | 0.019 |
| Exits | 0.011 | 0.007 | 0.009 |
| Moves | 0.007 | 0.001 | 0.004 |
Download links
A two-part list of links to download the article, or parts of the article, in various formats.