A microsimulation approach to an optimal Swedish income tax
- Empirica, Högbergsgatan 50, Sweden
- School of Business, Economics and Law, University of Gothenburg, Department of Economics, Sweden
Cite this article
as: P. Ericson, L. Flood; 2012; A microsimulation approach to an optimal Swedish income tax; International Journal of Microsimulation; 5(2); 2-21.
doi: 10.34196/ijm.00069
- Article
- Figures and data
- Jump to
Figures
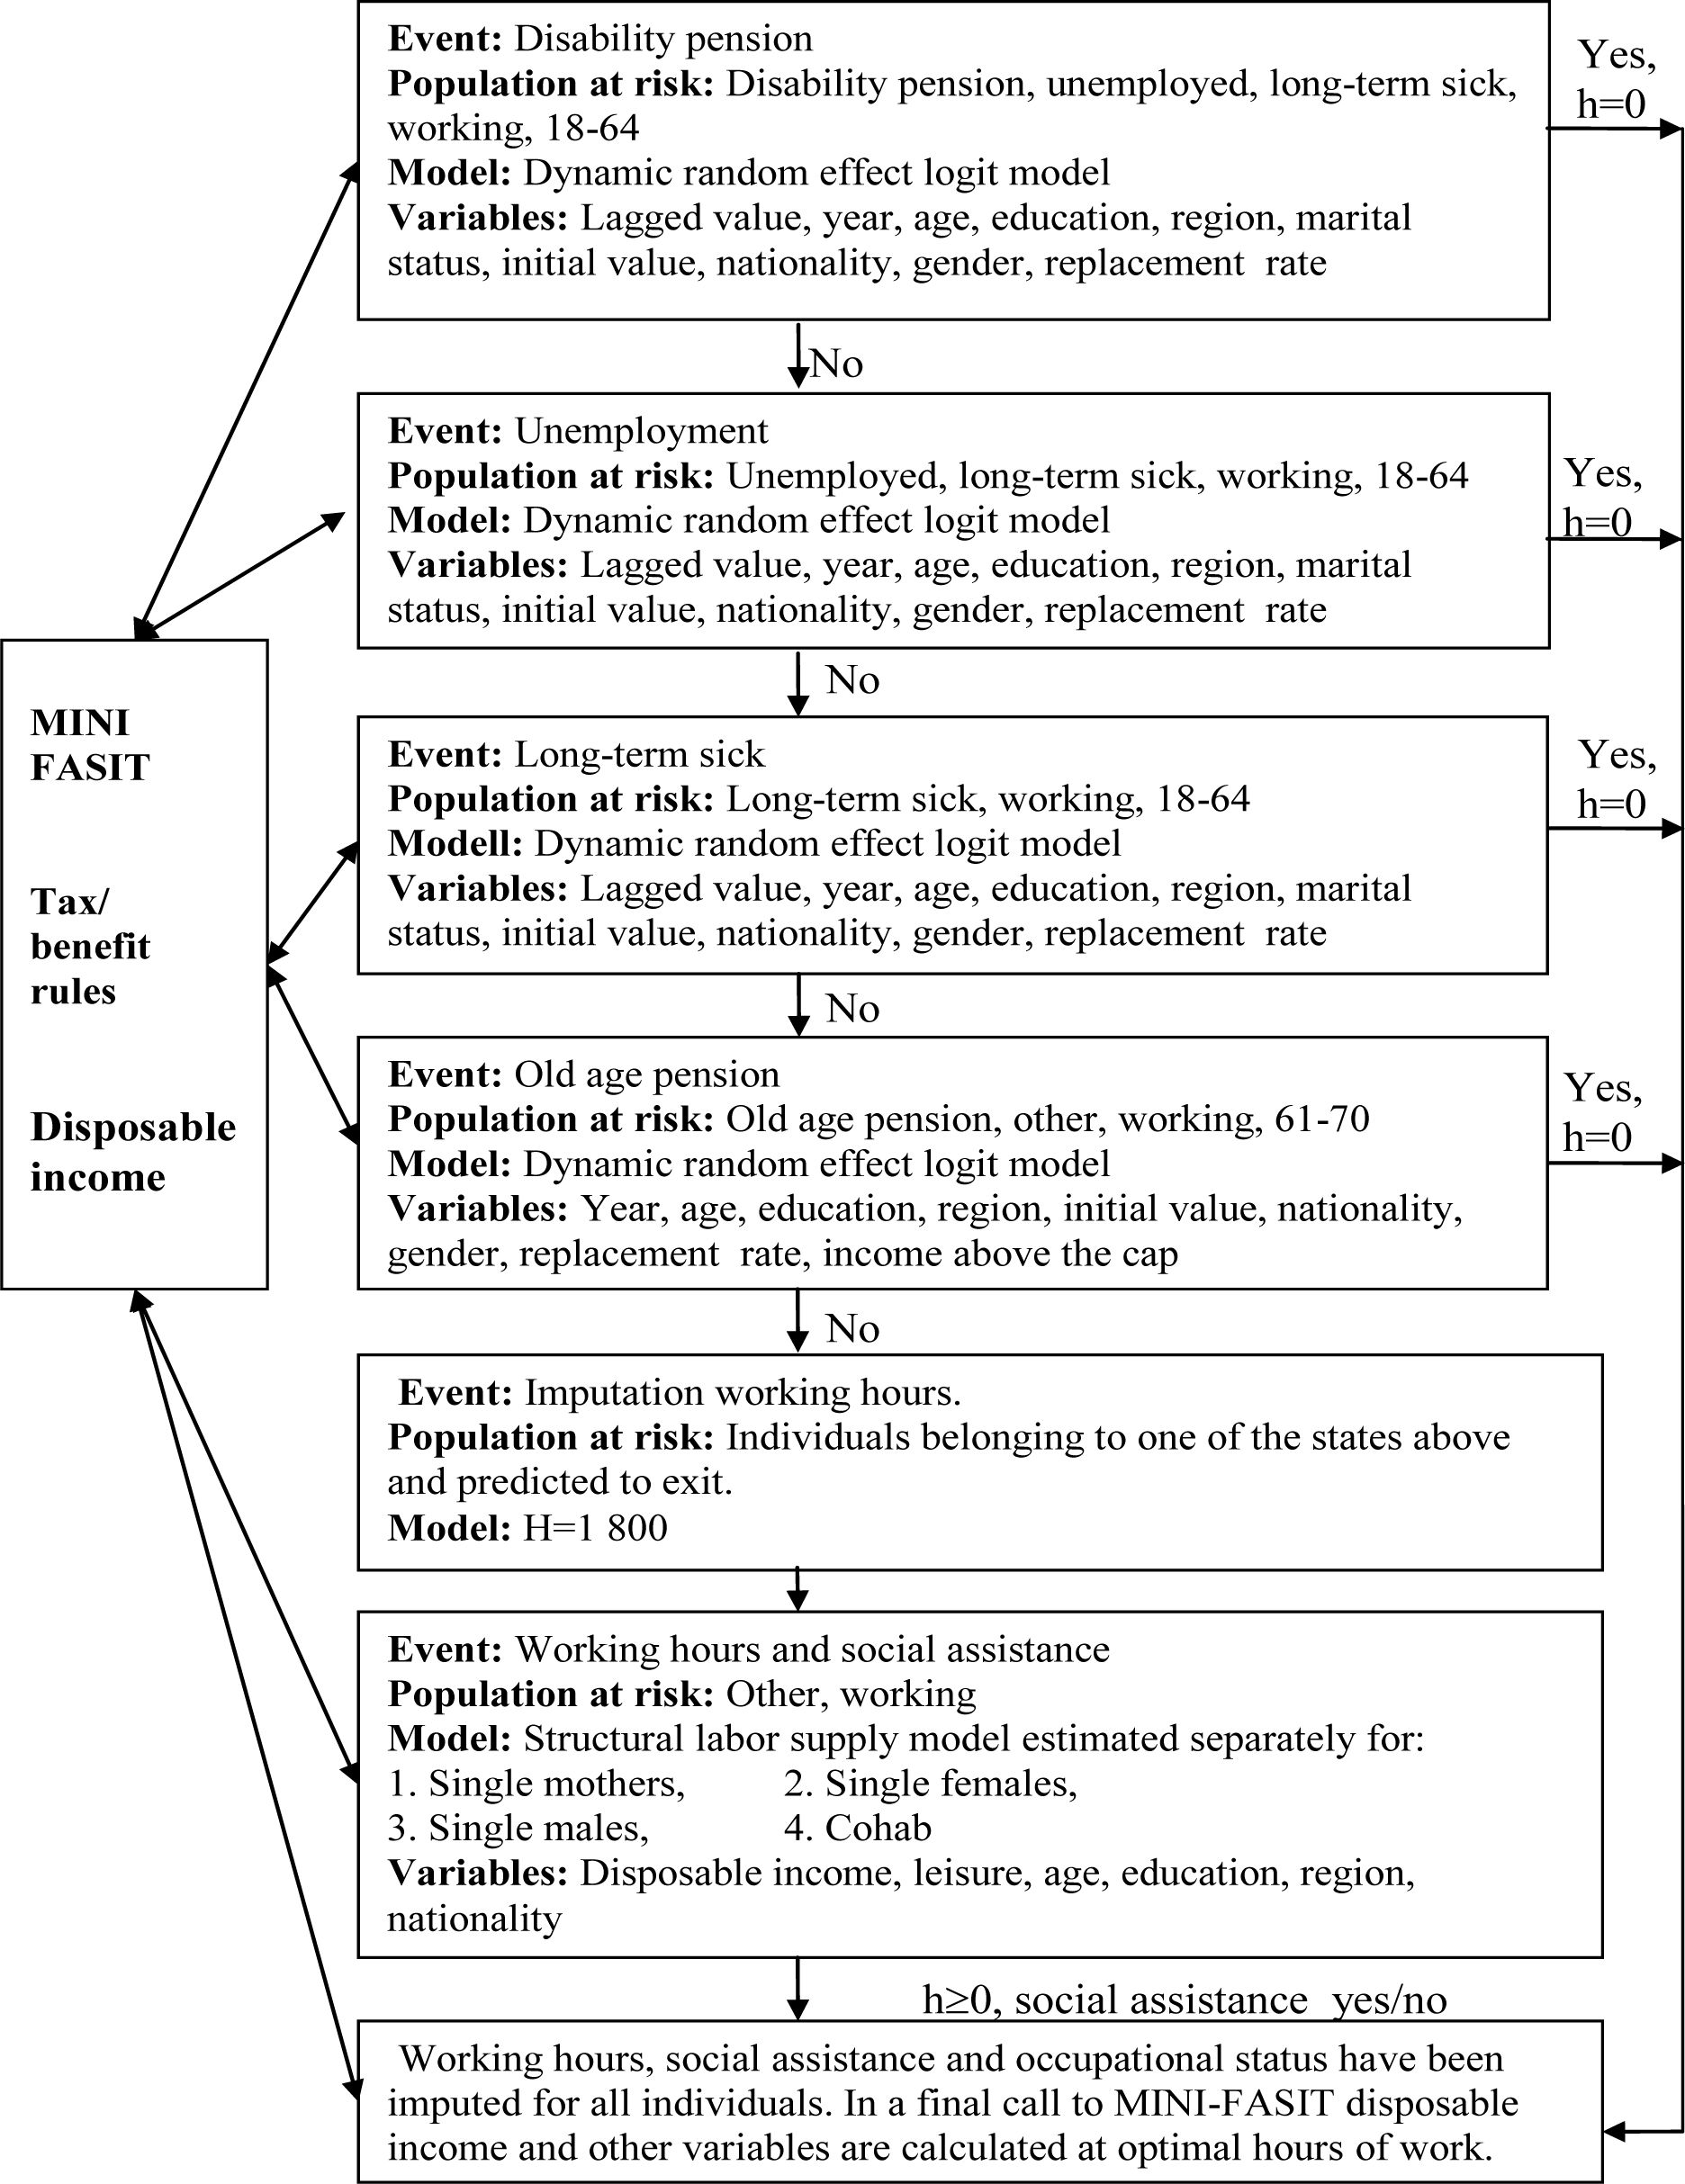
Figure 1

Structure of SWEtaxben.
Figure 2

The Swedish income tax in 2006.
Note: taxes are evaluated at an average municipal tax rate (31.44%). The axis on the left hand side shows marginal and average tax rates and the axis on the right hand side refers to the income distribution.
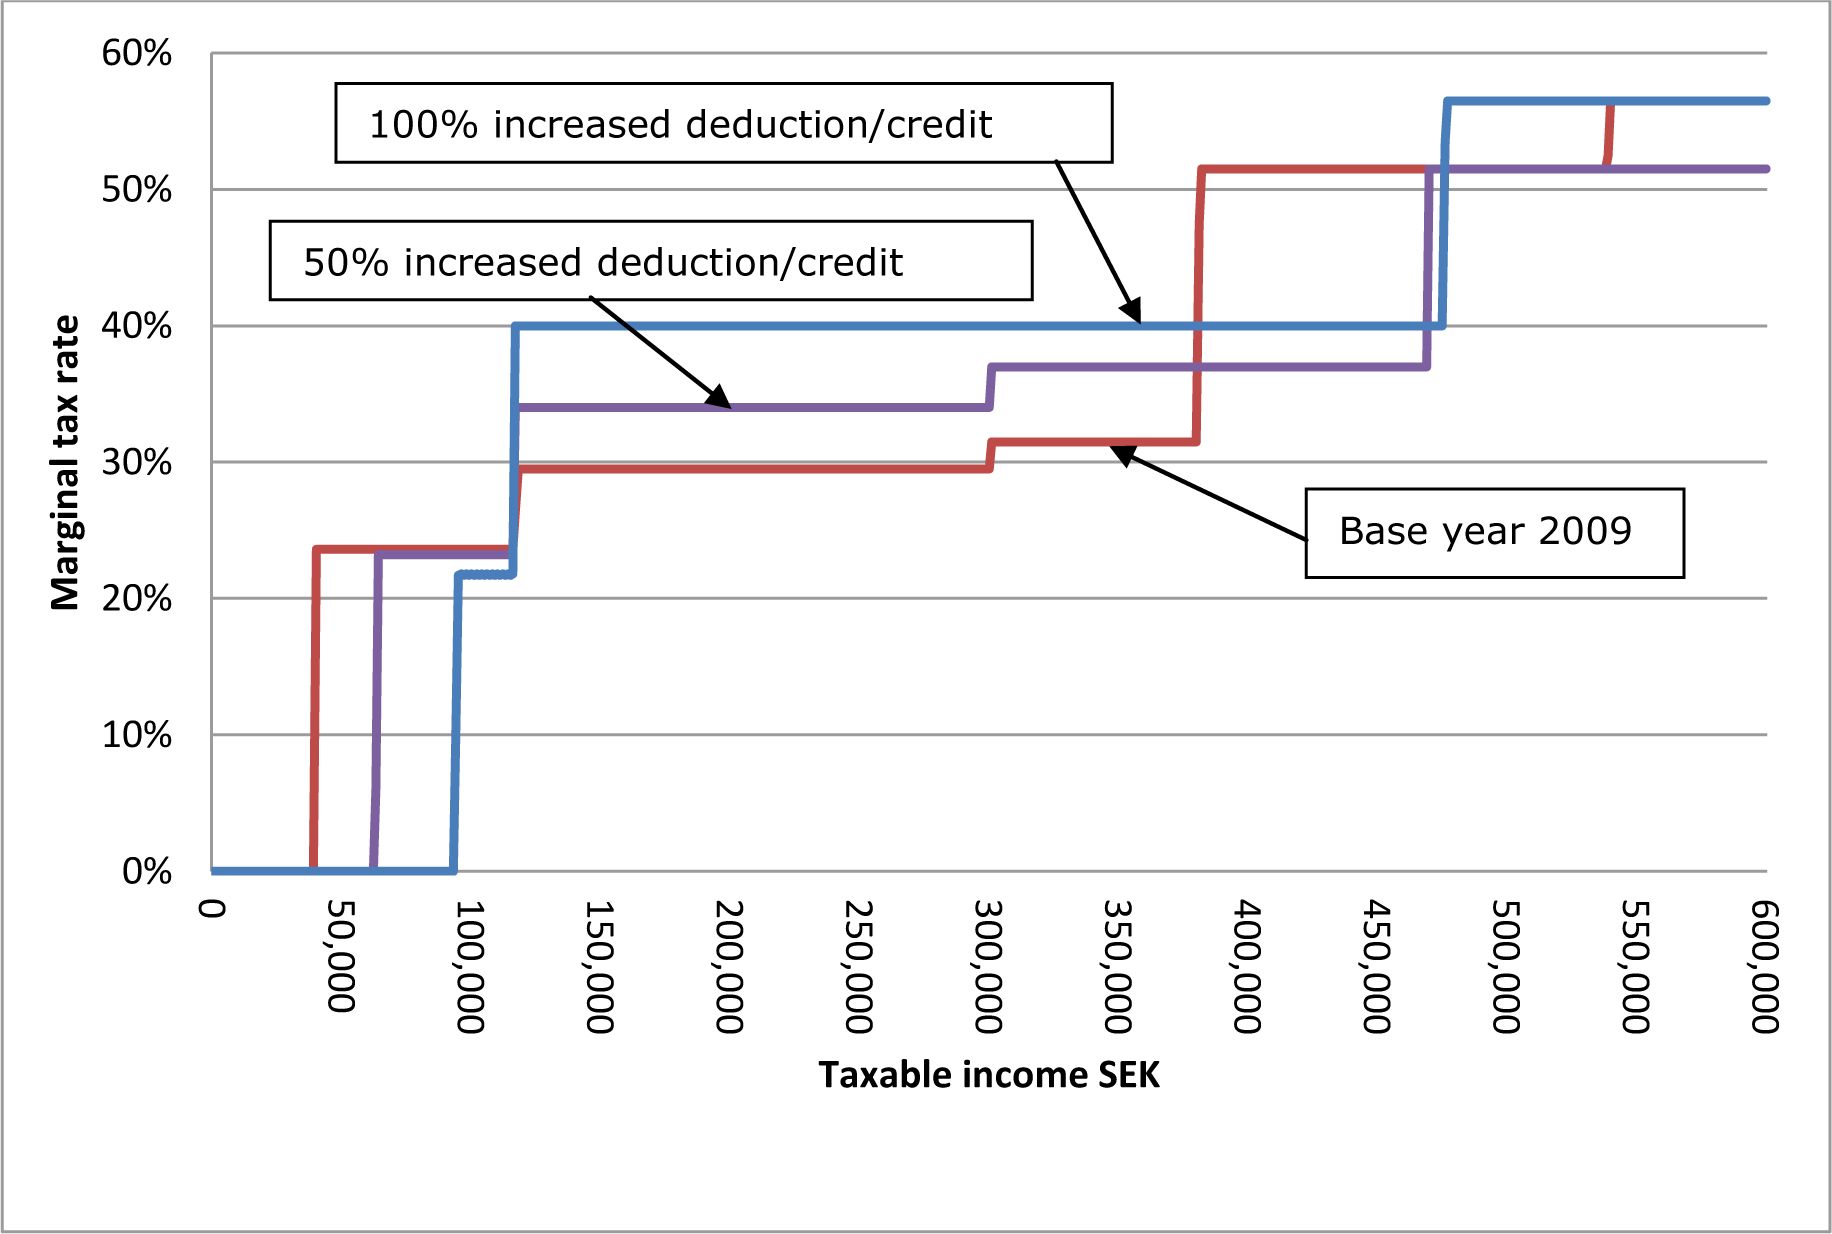
Figure 3
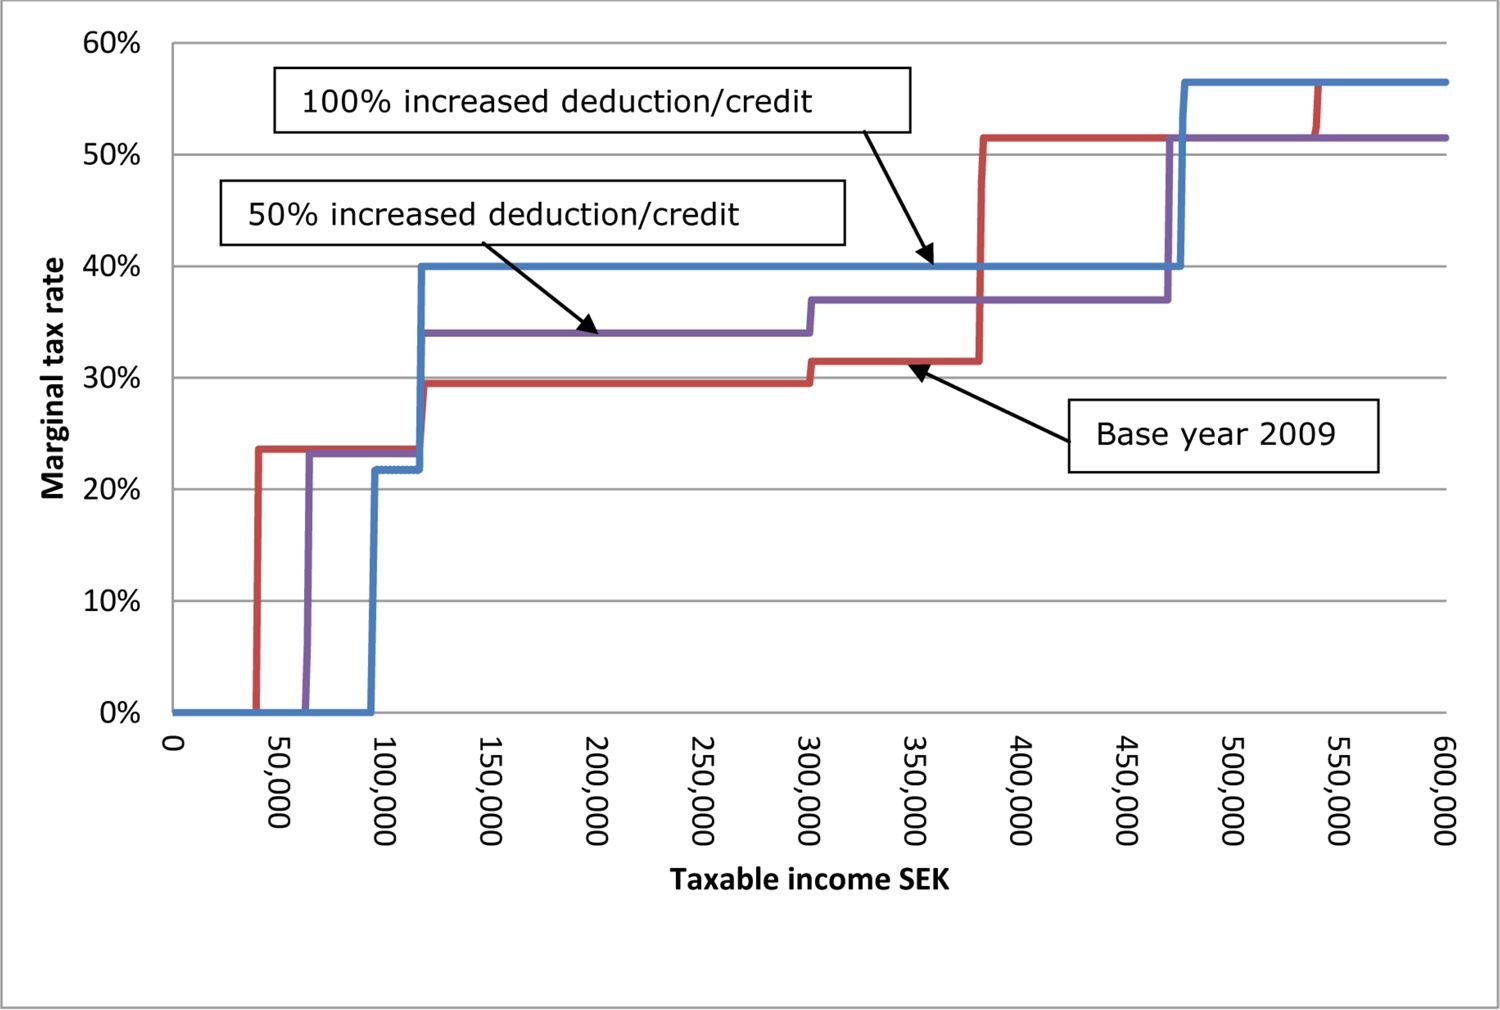
The optimal tax profiles compared to the base year 2009.
Tables
Table 1
Uncompensated wage elasticities by family type
| Household | Single mothers | Single | Single | ||
|---|---|---|---|---|---|
| Wage increase by 1% | Male | Female | Female | Female | Male |
| Male | 0.10 | −0.07 | 0.05 | ||
| Female | 0 | 0.16 | 0.21 | 0.38 |
Table 2
Distributional weight profiles of four different social welfare functions
| W1 (Bonferroni) | W2 (Gini) | W3 | W∞ (Utilitarian) | |
|---|---|---|---|---|
| p(.01)/p(.5) | 6.64 | 1.98 | 1.33 | 1 |
| p(.05)/p(.5) | 4.32 | 1.90 | 1.33 | 1 |
| p(.30)/p(.5) | 1.74 | 1.40 | 1.21 | 1 |
| p(.95)/p(.5) | 0.07 | 0.10 | 0.13 | 1 |
Table 3
Estimated parameters of the social welfare function
| Estimates | Standard Errors | |
|---|---|---|
| Log leisure, βl | 3.0985 | 0.0215 |
| Log leisure squared, βll | 0.3620 | 0.0151 |
| Log income, βC | 4.7262 | 0.0224 |
| Log income squared, βCC | −0.0616 | 0.0089 |
Table 4
Flat tax.
| Reform | Description | Hours | Participation | Budget | Disposable income | Labor income | Income tax | GINI | D9/D2 |
|---|---|---|---|---|---|---|---|---|---|
| 0 | Base 2006 | 0.00% | 0.00% | 0.00% | 0.00% | 0.00% | 0.00% | 0.0% | 2.34 |
| 1 | 20% | 4.78% | 1.55% | −10.28% | 17.35% | 4.88% | −30.93% | 8.2% | 2.84 |
| 2 | 21% | 4.60% | 1.44% | −9.13% | 15.99% | 4.72% | −27.99% | 8.3% | 2.81 |
| 3 | 22% | 4.41% | 1.34% | −7.98% | 14.62% | 4.55% | −25.07% | 8.5% | 2.77 |
| 4 | 23% | 4.18% | 1.21% | −6.86% | 13.23% | 4.36% | −22.16% | 8.6% | 2.74 |
| 5 | 24% | 3.95% | 1.09% | −5.75% | 11.86% | 4.16% | −19.26% | 8.8% | 2.70 |
| 6 | 25% | 3.69% | 0.95% | −4.66% | 10.47% | 3.95% | −16.39% | 9.0% | 2.67 |
| 7 | 26% | 3.43% | 0.82% | −3.57% | 9.09% | 3.73% | −13.52% | 9.2% | 2.63 |
| 8 | 27% | 3.18% | 0.67% | −2.50% | 7.71% | 3.51% | −10.67% | 9.4% | 2.60 |
| 9 | 28% | 2.89% | 0.50% | −1.44% | 6.32% | 3.27% | −7.83% | 9.7% | 2.57 |
| 10 | 29% | 2.61% | 0.32% | −0.40% | 4.95% | 3.04% | −5.01% | 9.9% | 2.53 |
| 11 | 30% | 2.29% | 0.12% | 0.61% | 3.56% | 2.77% | −2.21% | 10.1% | 2.50 |
| 12 | 31% | 1.98% | −0.08% | 1.64% | 2.18% | 2.51% | 0.58% | 10.4% | 2.46 |
| 13 | 32% | 1.67% | −0.27% | 2.64% | 0.80% | 2.24% | 3.35% | 10.6% | 2.43 |
| 14 | 33% | 1.32% | −0.49% | 3.61% | −0.56% | 1.96% | 6.11% | 10.9% | 2.40 |
| 15 | 34% | 0.95% | −0.73% | 4.55% | −1.94% | 1.65% | 8.83% | 11.2% | 2.36 |
| 16 | 35% | 0.60% | −0.95% | 5.52% | −3.30% | 1.38% | 11.56% | 11.4% | 2.33 |
Table 5
Age-dependent taxes.
| Reform | Flat tax | Up 26–46 (%) | Down 46–65 (%) | Hours | Participation | Budget | Disposabl e-income | Labor income | Income tax | GINI | D9/D2 |
|---|---|---|---|---|---|---|---|---|---|---|---|
| 0 | Base 2006 | 0.00% | 0.00% | 0.00% | 0.00% | 0.00% | 0.00% | 0.0% | 2.34 | ||
| 1 | 15% | 1.00 | 1.00 | 3.89% | 1.11% | −6.60% | 12.46% | 4.02% | −21.12% | 6.6% | 2.68 |
| 2 | 15% | 1.05 | 1.05 | 3.77% | 1.05% | −6.15% | 11.87% | 3.92% | −19.93% | 6.6% | 2.67 |
| 3 | 15% | 1.10 | 1.10 | 3.65% | 0.98% | −5.71% | 11.28% | 3.81% | −18.74% | 6.6% | 2.65 |
| 4 | 15% | 1.15 | 1.15 | 3.53% | 0.92% | −5.27% | 10.70% | 3.71% | −17.56% | 6.7% | 2.63 |
| 5 | 15% | 1.20 | 1.20 | 3.40% | 0.85% | −4.85% | 10.10% | 3.59% | −16.39% | 6.8% | 2.62 |
| 6 | 15% | 1.25 | 1.25 | 3.26% | 0.77% | −4.43% | 9.51% | 3.47% | −15.23% | 6.9% | 2.60 |
| 7 | 15% | 1.30 | 1.30 | 3.11% | 0.68% | −4.02% | 8.91% | 3.33% | −14.08% | 7.0% | 2.59 |
| 8 | 15% | 1.35 | 1.35 | 2.97% | 0.60% | −3.60% | 8.33% | 3.22% | −12.92% | 7.1% | 2.57 |
| 9 | 15% | 1.40 | 1.40 | 2.83% | 0.52% | −3.19% | 7.74% | 3.09% | −11.77% | 7.2% | 2.56 |
| 10 | 15% | 1.45 | 1.45 | 2.66% | 0.42% | −2.81% | 7.14% | 2.94% | −10.65% | 7.3% | 2.54 |
| 11 | 15% | 1.50 | 1.50 | 2.50% | 0.32% | −2.43% | 6.55% | 2.80% | −9.52% | 7.5% | 2.52 |
| 12 | 15% | 1.55 | 1.55 | 2.33% | 0.21% | −2.05% | 5.96% | 2.65% | −8.41% | 7.7% | 2.51 |
| 13 | 15% | 1.60 | 1.60 | 2.18% | 0.13% | −1.65% | 5.38% | 2.52% | −7.27% | 7.8% | 2.49 |
| 14 | 15% | 1.65 | 1.65 | 1.99% | 0.00% | −1.30% | 4.78% | 2.35% | −6.19% | 8.0% | 2.48 |
| 15 | 15% | 1.70 | 1.70 | 1.81% | −0.12% | −0.94% | 4.19% | 2.19% | −5.09% | 8.2% | 2.47 |
| 16 | 15% | 1.75 | 1.75 | 1.58% | −0.27% | −0.63% | 3.58% | 1.98% | −4.05% | 8.5% | 2.45 |
| 17 | 15% | 1.80 | 1.80 | 1.36% | −0.43% | −0.32% | 2.98% | 1.79% | −3.00% | 8.7% | 2.44 |
| 18 | 15% | 1.85 | 1.85 | 1.16% | −0.56% | 0.02% | 2.39% | 1.62% | −1.94% | 9.0% | 2.42 |
| 19 | 15% | 1.90 | 1.90 | 0.93% | −0.72% | 0.32% | 1.80% | 1.42% | −0.90% | 9.3% | 2.42 |
| 20 | 15% | 1.95 | 1.95 | 0.73% | −0.85% | 0.65% | 1.22% | 1.25% | 0.15% | 9.5% | 2.40 |
| 21 | 15% | 2.00 | 2.00 | 0.50% | −1.00% | 0.94% | 0.63% | 1.05% | 1.16% | 9.8% | 2.39 |
| 22 | Extended 2009 in-work tax credit | 1.79% | 1.52% | −3.93% | 5.76% | 1.38% | −11.55% | −1.4% | 2.48 | ||
Table 6
Combination of tax/benefits15.
| Reform | Top level | Level | Break point | Housing allowance | Credit/deduction | Hours | Participation | Budget | Disposable income | Labor income | Income tax | GINI | D9/D2 | W1 | W2 | W3 | W∞ |
|---|---|---|---|---|---|---|---|---|---|---|---|---|---|---|---|---|---|
| 0 | 0% | 0% | 0% | 0% | 2006 | 0.00% | 0.00% | 0.00% | 0.00% | 0.00% | 0.00% | 0.0% | 2.34 | 80 | 80 | 80 | 76 |
| 39 | 0% | -25% | 25% | 50% | 2009 + age | 2.69% | 1.54% | −4.85% | 8.31% | 2.49% | −14.97% | 1.6% | 2.46 | 17 | 3 | 1 | 4 |
| 79 | −100% | −25% | 25% | 50% | 2009 + age | 2.74% | 1.54% | −4.85% | 8.46% | 2.58% | −15.11% | 2.1% | 2.47 | 21 | 5 | 2 | 2 |
| 59 | −100% | 0% | 25% | 50% | 2009 + age | 2.54% | 1.53% | −4.76% | 7.90% | 2.27% | −14.48% | 0.9% | 2.45 | 18 | 6 | 3 | 6 |
| 77 | −100% | −25% | 25% | 50% | 2009 +50% | 3.06% | 1.91% | −7.51% | 11.40% | 2.80% | −21.75% | 1.1% | 2.47 | 12 | 7 | 5 | 21 |
| 19 | 0% | 0% | 25% | 50% | 2009 + age | 2.49% | 1.53% | −4.76% | 7.72% | 2.16% | −14.31% | 0.3% | 2.45 | 22 | 9 | 4 | 13 |
| 37 | 0% | −25% | 25% | 50% | 2009 +50% | 3.03% | 1.91% | −7.48% | 11.27% | 2.73% | −21.61% | 0.7% | 2.47 | 11 | 8 | 6 | 24 |
| 69 | −100% | −25% | 0% | 50% | 2009 + age | 2.18% | 1.46% | −4.47% | 7.21% | 2.00% | −13.40% | 1.0% | 2.42 | 16 | 10 | 9 | 14 |
| 29 | 0% | −25% | 0% | 50% | 2009 + age | 2.10% | 1.46% | −4.44% | 6.96% | 1.84% | −13.14% | 0.3% | 2.42 | 13 | 11 | 12 | 18 |
| 78 | −100% | −25% | 25% | 50% | 2009 +100% | 3.52% | 2.35% | −10.60% | 14.87% | 3.11% | −29.50% | 0.1% | 2.48 | 1 | 1 | 11 | 46 |
| 38 | 0% | −25% | 25% | 50% | 2009 +100% | 3.49% | 2.36% | −10.57% | 14.74% | 3.05% | −29.35% | −0.3% | 2.48 | 2 | 2 | 13 | 50 |
| 57 | −100% | 0% | 25% | 50% | 2009 +50% | 2.88% | 1.90% | −7.40% | 10.87% | 2.52% | −21.14% | −0.1% | 2.45 | 15 | 16 | 16 | 31 |
| 67 | −100% | −25% | 0% | 50% | 2009 +50% | 2.55% | 1.84% | −7.12% | 10.23% | 2.27% | −20.11% | 0.0% | 2.42 | 9 | 14 | 20 | 35 |
| 34 | 0% | −25% | 25% | 0% | 2009 + age | 2.82% | 1.64% | −4.66% | 8.29% | 2.59% | −14.92% | 1.7% | 2.47 | 51 | 22 | 7 | 3 |
| 58 | −100% | 0% | 25% | 50% | 2009 +100% | 3.36% | 2.35% | −10.48% | 14.37% | 2.87% | −28.89% | −1.0% | 2.47 | 3 | 4 | 18 | 59 |
| 74 | −100% | −25% | 25% | 0% | 2009 + age | 2.86% | 1.64% | −4.67% | 8.43% | 2.68% | −15.05% | 2.1% | 2.47 | 52 | 25 | 8 | 1 |
| 54 | −100% | 0% | 25% | 0% | 2009 + age | 2.66% | 1.62% | −4.58% | 7.87% | 2.37% | −14.42% | 0.9% | 2.45 | 48 | 24 | 10 | 5 |
| 64 | −100% | −25% | 0% | 0% | 2009 + age | 2.32% | 1.57% | −4.27% | 7.19% | 2.11% | −13.34% | 1.0% | 2.42 | 41 | 26 | 15 | 12 |
| 27 | 0% | −25% | 0% | 50% | 2009 +50% | 2.47% | 1.84% | −7.10% | 9.98% | 2.12% | −19.86% | −0.7% | 2.42 | 10 | 17 | 25 | 43 |
| 17 | 0% | 0% | 25% | 50% | 2009 +50% | 2.82% | 1.89% | −7.41% | 10.70% | 2.40% | −20.98% | −0.6% | 2.45 | 19 | 19 | 24 | 36 |
| 73 | −100% | −25% | 25% | 0% | 2009 +100% | 3.62% | 2.43% | −10.44% | 14.84% | 3.20% | −29.47% | 0.2% | 2.48 | 25 | 18 | 19 | 39 |
| 24 | 0% | −25% | 0% | 0% | 2009 + age | 2.23% | 1.56% | −4.25% | 6.93% | 1.96% | −13.08% | 0.3% | 2.42 | 42 | 28 | 17 | 16 |
| 14 | 0% | 0% | 25% | 0% | 2009 + age | 2.61% | 1.63% | −4.58% | 7.70% | 2.26% | −14.26% | 0.4% | 2.45 | 54 | 30 | 14 | 10 |
| 49 | −100% | 0% | 0% | 50% | 2009 + age | 1.79% | 1.44% | −4.28% | 6.27% | 1.49% | −12.28% | −0.6% | 2.39 | 23 | 23 | 32 | 32 |
| 36 | 0% | −25% | 25% | 50% | 2009 | 2.48% | 1.30% | −4.47% | 7.75% | 2.33% | −13.82% | 1.9% | 2.46 | 37 | 38 | 26 | 11 |
| 76 | −100% | −25% | 25% | 50% | 2009 | 2.52% | 1.30% | −4.47% | 7.89% | 2.42% | −13.95% | 2.3% | 2.47 | 38 | 40 | 27 | 8 |
| 18 | 0% | 0% | 25% | 50% | 2009 +100% | 3.31% | 2.35% | −10.48% | 14.20% | 2.75% | −28.74% | −1.4% | 2.46 | 6 | 13 | 29 | 66 |
| 68 | −100% | −25% | 0% | 50% | 2009 +100% | 3.06% | 2.30% | −10.21% | 13.76% | 2.63% | −27.93% | −1.0% | 2.44 | 4 | 12 | 30 | 68 |
| 33 | 0% | −25% | 25% | 0% | 2009 +100% | 3.59% | 2.43% | −10.42% | 14.71% | 3.13% | −29.32% | −0.2% | 2.48 | 26 | 20 | 23 | 48 |
| 72 | −100% | −25% | 25% | 0% | 2009 +50% | 3.19% | 2.01% | −7.33% | 11.38% | 2.90% | −21.71% | 1.1% | 2.47 | 47 | 33 | 21 | 19 |
| 32 | 0% | −25% | 25% | 0% | 2009 +50% | 3.16% | 2.02% | −7.30% | 11.26% | 2.84% | −21.56% | 0.7% | 2.47 | 46 | 34 | 22 | 22 |
| 28 | 0% | −25% | 0% | 50% | 2009 +100% | 2.98% | 2.30% | −10.17% | 13.53% | 2.50% | −27.67% | −1.6% | 2.44 | 5 | 15 | 34 | 72 |
| 56 | −100% | 0% | 25% | 50% | 2009 | 2.32% | 1.29% | −4.39% | 7.34% | 2.11% | −13.32% | 1.1% | 2.45 | 36 | 43 | 31 | 17 |
| 9 | 0% | 0% | 0% | 50% | 2009 + age | 1.69% | 1.45% | −4.25% | 5.95% | 1.30% | −11.95% | −1.4% | 2.39 | 24 | 31 | 40 | 45 |
| 66 | −100% | −25% | 0% | 50% | 2009 | 1.96% | 1.22% | −4.10% | 6.65% | 1.84% | −12.25% | 1.2% | 2.42 | 32 | 45 | 39 | 26 |
| 52 | −100% | 0% | 25% | 0% | 2009 +50% | 3.01% | 2.00% | −7.22% | 10.86% | 2.63% | −21.09% | 0.0% | 2.46 | 49 | 37 | 28 | 29 |
| 53 | −100% | 0% | 25% | 0% | 2009 +100% | 3.47% | 2.43% | −10.32% | 14.35% | 2.95% | −28.86% | −0.9% | 2.47 | 28 | 27 | 33 | 56 |
| 16 | 0% | 0% | 25% | 50% | 2009 | 2.27% | 1.29% | −4.38% | 7.16% | 2.00% | −13.16% | 0.5% | 2.45 | 39 | 48 | 35 | 23 |
| 47 | −100% | 0% | 0% | 50% | 2009 +50% | 2.18% | 1.81% | −6.95% | 9.32% | 1.77% | −19.04% | −1.5% | 2.40 | 14 | 29 | 48 | 61 |
| 26 | 0% | −25% | 0% | 50% | 2009 | 1.87% | 1.22% | −4.07% | 6.39% | 1.68% | −11.99% | 0.5% | 2.42 | 33 | 49 | 43 | 28 |
| 62 | −100% | −25% | 0% | 0% | 2009 +50% | 2.69% | 1.95% | −6.93% | 10.21% | 2.38% | −20.06% | 0.0% | 2.43 | 44 | 41 | 36 | 34 |
| 48 | −100% | 0% | 0% | 50% | 2009 +100% | 2.72% | 2.28% | −10.03% | 12.89% | 2.17% | −26.89% | −2.4% | 2.41 | 7 | 21 | 52 | 77 |
| 44 | −100% | 0% | 0% | 0% | 2009 + age | 1.92% | 1.54% | −4.09% | 6.24% | 1.60% | −12.22% | −0.6% | 2.39 | 50 | 44 | 38 | 30 |
| 63 | −100% | −25% | 0% | 0% | 2009 +100% | 3.16% | 2.38% | −10.04% | 13.73% | 2.72% | −27.90% | −0.9% | 2.44 | 27 | 32 | 44 | 65 |
| 31 | 0% | −25% | 25% | 0% | 2009 | 2.63% | 1.42% | −4.27% | 7.73% | 2.45% | −13.75% | 1.9% | 2.47 | 61 | 58 | 41 | 9 |
| 22 | 0% | −25% | 0% | 0% | 2009 +50% | 2.61% | 1.95% | −6.91% | 9.97% | 2.23% | −19.81% | −0.6% | 2.42 | 45 | 46 | 42 | 41 |
| 13 | 0% | 0% | 25% | 0% | 2009 +100% | 3.41% | 2.42% | −10.32% | 14.17% | 2.84% | −28.70% | −1.4% | 2.47 | 31 | 35 | 45 | 64 |
| 12 | 0% | 0% | 25% | 0% | 2009 +50% | 2.96% | 2.00% | −7.23% | 10.68% | 2.51% | −20.93% | −0.5% | 2.45 | 56 | 50 | 37 | 33 |
| 71 | −100% | −25% | 25% | 0% | 2009 | 2.67% | 1.42% | −4.27% | 7.88% | 2.54% | −13.89% | 2.3% | 2.47 | 63 | 59 | 47 | 7 |
| 51 | −100% | 0% | 25% | 0% | 2009 | 2.47% | 1.41% | −4.19% | 7.32% | 2.23% | −13.26% | 1.1% | 2.45 | 59 | 57 | 46 | 15 |
| 7 | 0% | 0% | 0% | 50% | 2009 +50% | 2.06% | 1.81% | −6.94% | 9.00% | 1.57% | −18.74% | −2.3% | 2.39 | 20 | 39 | 56 | 71 |
| 23 | 0% | −25% | 0% | 0% | 2009 +100% | 3.09% | 2.38% | −10.00% | 13.50% | 2.59% | −27.63% | −1.5% | 2.44 | 30 | 36 | 51 | 70 |
| 46 | −100% | 0% | 0% | 50% | 2009 | 1.56% | 1.20% | −3.92% | 5.70% | 1.32% | −11.13% | −0.4% | 2.39 | 35 | 53 | 57 | 44 |
| 11 | 0% | 0% | 25% | 0% | 2009 | 2.42% | 1.41% | −4.19% | 7.14% | 2.11% | −13.10% | 0.6% | 2.45 | 60 | 60 | 50 | 20 |
| 8 | 0% | 0% | 0% | 50% | 2009 +100% | 2.61% | 2.28% | −10.02% | 12.59% | 1.97% | −26.61% | −3.2% | 2.41 | 8 | 42 | 61 | 80 |
| 4 | 0% | 0% | 0% | 0% | 2009 + age | 1.82% | 1.55% | −4.07% | 5.92% | 1.40% | −11.90% | −1.4% | 2.39 | 55 | 51 | 49 | 37 |
| 61 | −100% | −25% | 0% | 0% | 2009 | 2.12% | 1.35% | −3.89% | 6.64% | 1.96% | −12.18% | 1.2% | 2.42 | 57 | 61 | 54 | 25 |
| 21 | 0% | −25% | 0% | 0% | 2009 | 2.03% | 1.34% | −3.86% | 6.38% | 1.81% | −11.92% | 0.5% | 2.42 | 58 | 62 | 55 | 27 |
| 42 | −100% | 0% | 0% | 0% | 2009 +50% | 2.31% | 1.91% | −6.77% | 9.29% | 1.88% | −19.00% | −1.5% | 2.40 | 43 | 52 | 53 | 58 |
| 43 | −100% | 0% | 0% | 0% | 2009 +100% | 2.83% | 2.36% | −9.86% | 12.87% | 2.27% | −26.85% | −2.3% | 2.42 | 29 | 47 | 58 | 75 |
| 6 | 0% | 0% | 0% | 50% | 2009 | 1.47% | 1.21% | −3.89% | 5.39% | 1.14% | −10.81% | −1.2% | 2.39 | 40 | 56 | 60 | 55 |
| 41 | −100% | 0% | 0% | 0% | 2009 | 1.71% | 1.32% | −3.72% | 5.68% | 1.44% | −11.07% | −0.4% | 2.39 | 62 | 63 | 62 | 40 |
| 3 | 0% | 0% | 0% | 0% | 2009 +100% | 2.72% | 2.36% | −9.86% | 12.56% | 2.06% | −26.57% | −3.1% | 2.41 | 34 | 54 | 63 | 79 |
| 2 | 0% | 0% | 0% | 0% | 2009 +50% | 2.19% | 1.91% | −6.76% | 8.98% | 1.68% | −18.70% | −2.3% | 2.39 | 53 | 55 | 59 | 69 |
| 1 | 0% | 0% | 0% | 0% | 2009 | 1.61% | 1.33% | −3.69% | 5.37% | 1.25% | −10.75% | −1.2% | 2.39 | 64 | 64 | 64 | 52 |
| 55 | −100% | 0% | 25% | 50% | 2006 | 0.68% | −0.07% | −0.70% | 1.96% | 0.85% | −2.55% | 2.5% | 2.41 | 67 | 65 | 65 | 53 |
| 75 | −100% | −25% | 25% | 50% | 2006 | 0.88% | −0.06% | −0.79% | 2.52% | 1.16% | −3.18% | 3.8% | 2.42 | 71 | 68 | 67 | 47 |
| 15 | 0% | 0% | 25% | 50% | 2006 | 0.63% | −0.06% | −0.70% | 1.78% | 0.73% | −2.39% | 1.9% | 2.41 | 68 | 66 | 66 | 57 |
| 35 | 0% | −25% | 25% | 50% | 2006 | 0.84% | −0.06% | −0.78% | 2.38% | 1.07% | −3.04% | 3.3% | 2.42 | 72 | 69 | 68 | 49 |
| 70 | −100% | −25% | 25% | 0% | 2006 | 1.06% | 0.09% | −0.56% | 2.50% | 1.29% | −3.09% | 3.7% | 2.43 | 79 | 75 | 69 | 38 |
| 30 | 0% | −25% | 25% | 0% | 2006 | 1.02% | 0.09% | −0.54% | 2.36% | 1.21% | −2.95% | 3.3% | 2.42 | 78 | 76 | 70 | 42 |
| 25 | 0% | −25% | 0% | 50% | 2006 | 0.25% | −0.13% | −0.37% | 1.04% | 0.45% | −1.23% | 1.9% | 2.37 | 65 | 67 | 71 | 67 |
| 50 | −100% | 0% | 25% | 0% | 2006 | 0.86% | 0.08% | −0.48% | 1.94% | 0.98% | −2.47% | 2.4% | 2.41 | 75 | 73 | 72 | 51 |
| 65 | −100% | −25% | 0% | 50% | 2006 | 0.32% | −0.13% | −0.42% | 1.29% | 0.58% | −1.51% | 2.7% | 2.38 | 66 | 70 | 74 | 63 |
| 10 | 0% | 0% | 25% | 0% | 2006 | 0.81% | 0.08% | −0.47% | 1.76% | 0.87% | −2.30% | 1.9% | 2.41 | 74 | 74 | 73 | 54 |
| 20 | 0% | −25% | 0% | 0% | 2006 | 0.44% | 0.03% | −0.13% | 1.03% | 0.60% | −1.13% | 1.9% | 2.38 | 73 | 77 | 75 | 62 |
| 60 | −100% | −25% | 0% | 0% | 2006 | 0.51% | 0.03% | −0.18% | 1.28% | 0.73% | −1.41% | 2.6% | 2.38 | 76 | 78 | 76 | 60 |
| 45 | −100% | 0% | 0% | 50% | 2006 | −0.08% | −0.16% | −0.25% | 0.34% | 0.06% | −0.40% | 1.0% | 2.35 | 69 | 71 | 77 | 74 |
| 5 | 0% | 0% | 0% | 50% | 2006 | −0.20% | −0.16% | −0.25% | 0.01% | −0.16% | −0.11% | 0.0% | 2.34 | 70 | 72 | 78 | 78 |
| 40 | −100% | 0% | 0% | 0% | 2006 | 0.12% | 0.00% | 0.00% | 0.33% | 0.22% | −0.30% | 0.9% | 2.35 | 77 | 79 | 79 | 73 |
Download links
A two-part list of links to download the article, or parts of the article, in various formats.