Modelling household spending using a random assignment scheme
- University of Essex, England
Cite this article
as: T. Lawson; 2013; Modelling household spending using a random assignment scheme; International Journal of Microsimulation; 6(2); 56-75.
doi: 10.34196/ijm.00083
- Article
- Figures and data
- Jump to
Figures
Figure 1

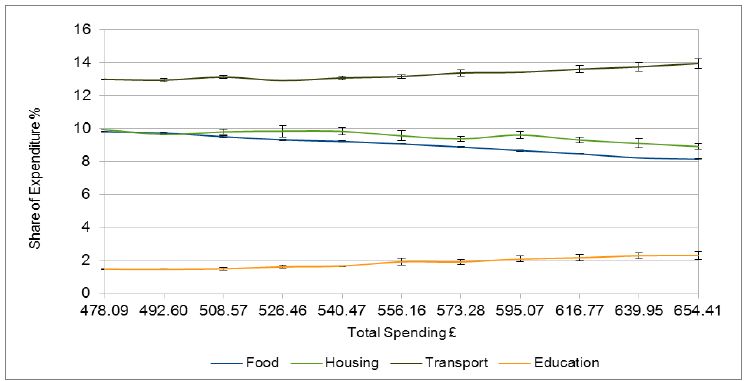
Share of expenditure (all households).
Figure 2

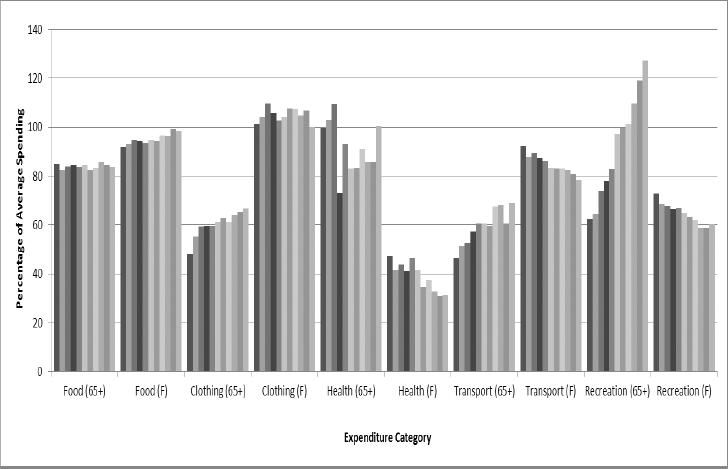
Share of expenditure (older households and families with young children).
Figure 3

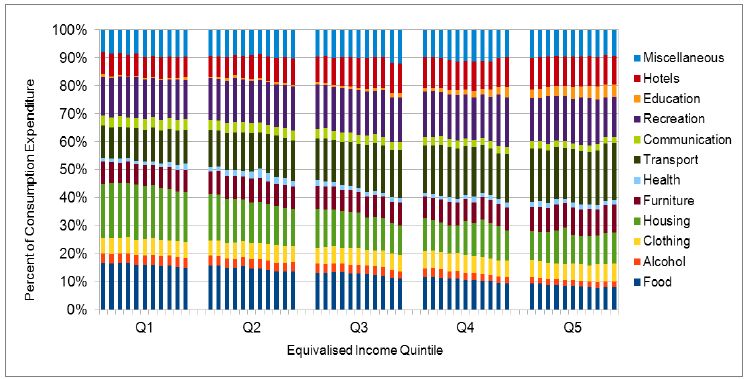
Share of expenditure by quintile.
Tables
Table 1
Primary EFS expenditure categories.
| Variable name | EFS Household Expenditure Category | Notes |
|---|---|---|
| P601t | Food & non-alcoholic drinks | |
| P602t | Alcohol, Tobacco & Narcotics | Alcohol to be consumed at home |
| P603t | Clothing and Footwear | |
| P604t | Housing Fuel & Power | Includes rent, maintenance of household, water and fuel bills.
Excludes mortgage costs |
| P605t | Household Furnishings & equipment | Includes carpets, curtains, household appliances, utensils and tools |
| P606t | Health | Prescriptions, glasses, dentist fees but not medical insurance |
| P607t | Transport | Purchase of vehicles, fuel, vehicle maintenance but not insurance |
| P608t | Communications | Mobile and fixed line telephone, postage but not internet subscription |
| P609t | Recreation & Culture | Television, computers, CDs, boats, caravans, pets, sports, holidays |
| P610t | Education | Course fees, school trips |
| P611t | Restaurants & Hotels | Includes takeaways, alcohol consumed outside the home and school meals |
| P612t | Miscellaneous | Includes insurance, jewellery, child care, fees, moving expenses |
Table 2
Share of expenditure with increasing income (all households).
| Expenditure Category | Initial Share (%) | Final Share (%) | Shift in Budget Share (%) | 95% Confidence Interval (+ −) α = 0.05, n = 3 | Lower CI | Upper CI |
|---|---|---|---|---|---|---|
| Transport | 13.00 | 13.94 | 0.95 | 0.288 | 13.65 | 14.23 |
| Education | 1.48 | 2.31 | 0.82 | 0.242 | 2.07 | 2.55 |
| Furniture | 6.32 | 6.58 | 0.26 | 0.200 | 6.38 | 6.78 |
| Miscellaneous | 7.54 | 7.63 | 0.09 | 0.152 | 7.48 | 7.78 |
| Health | 1.24 | 1.31 | 0.07 | 0.033 | 1.28 | 1.34 |
| Clothing | 4.86 | 4.79 | −0.08 | 0.095 | 4.70 | 4.89 |
| Hotels | 7.92 | 7.79 | −0.13 | 0.007 | 7.78 | 7.80 |
| Communication | 2.46 | 2.1 | −0.36 | 0.017 | 2.08 | 2.12 |
| Recreation | 12.26 | 11.89 | −0.37 | 0.325 | 11.57 | 12.22 |
| Alcohol | 2.33 | 1.94 | −0.39 | 0.039 | 1.90 | 1.98 |
| Housing | 9.94 | 8.92 | −1.02 | 0.167 | 8.75 | 9.09 |
| Food | 9.81 | 8.14 | −1.67 | 0.059 | 8.08 | 8.20 |
-
The expenditure shares to not add up to 100% because some spending goes to other items not included in these categories.
Download links
A two-part list of links to download the article, or parts of the article, in various formats.