Modelling the impact of declining Australian terms of trade on the spatial distribution of income
- Institute for Governance and Policy Analysis, University of Canberra, Australia
- University of Canberra, Australia
Cite this article
as: Y. Vidyattama, M. Rao, I. Mohanty, R. Tanton; 2014; Modelling the impact of declining Australian terms of trade on the spatial distribution of income; International Journal of Microsimulation; 7(1); 100-126.
doi: 10.34196/ijm.00095
- Article
- Figures and data
- Jump to
Figures
Figure 1
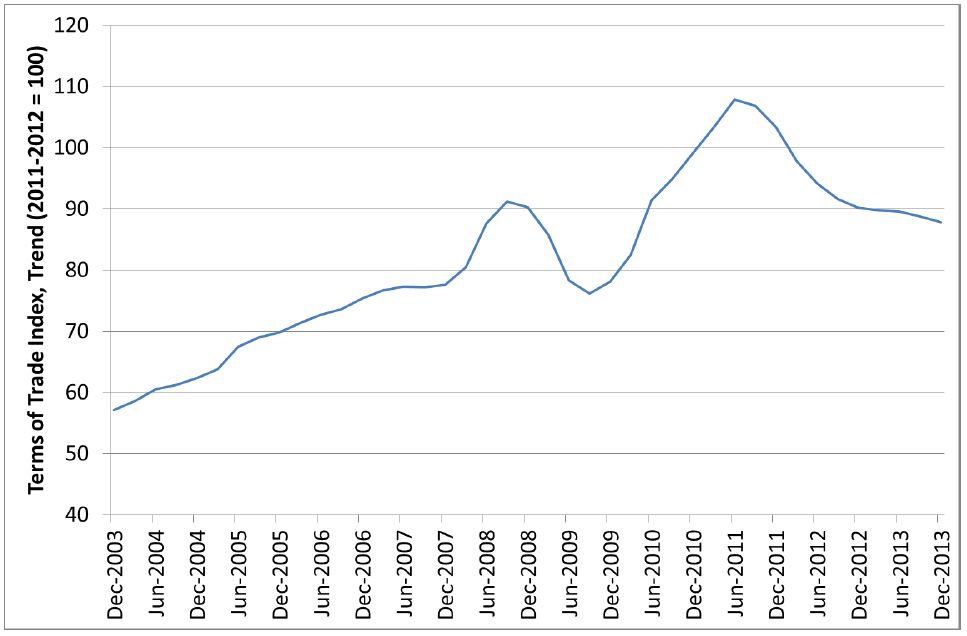
Movements in Australian terms of trade.
Source: ABS.
Figure 2
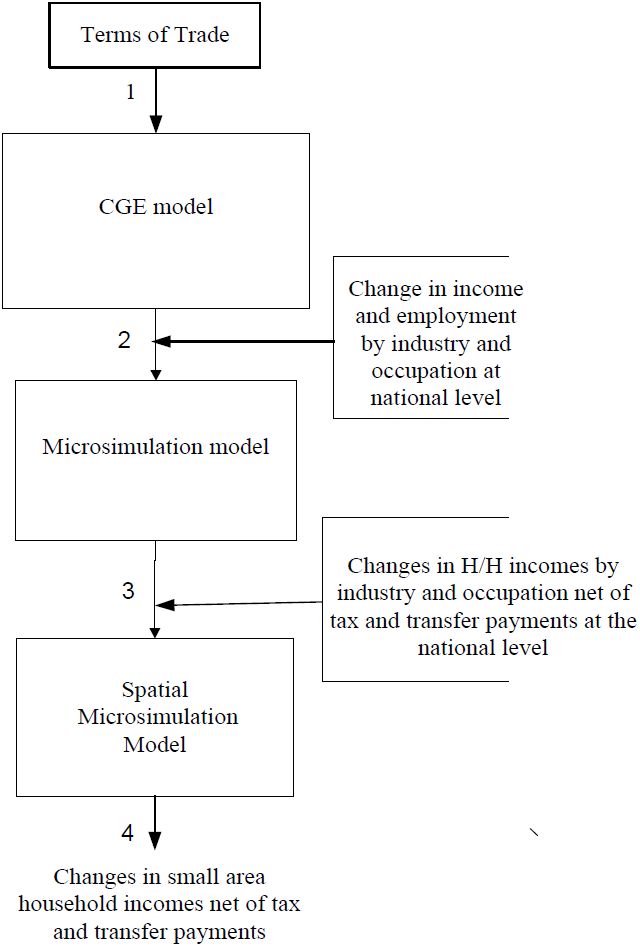
The modelling framework.
Figure 3

Spatial impact on incomes of a change in terms of trade.
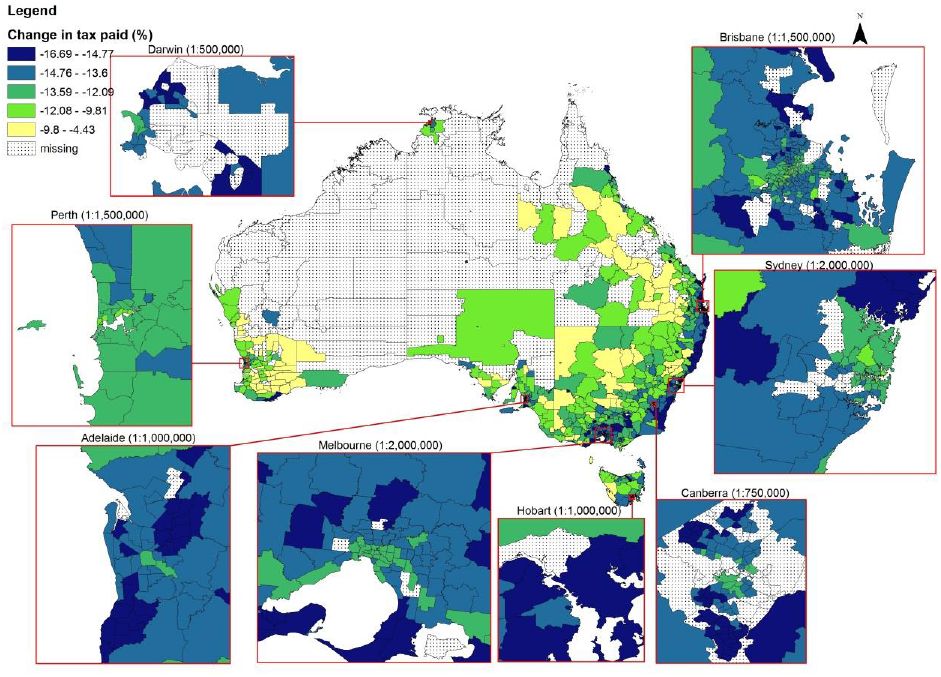
Figure 4

Spatial reduction in tax paid as a result of a change in terms of trade.
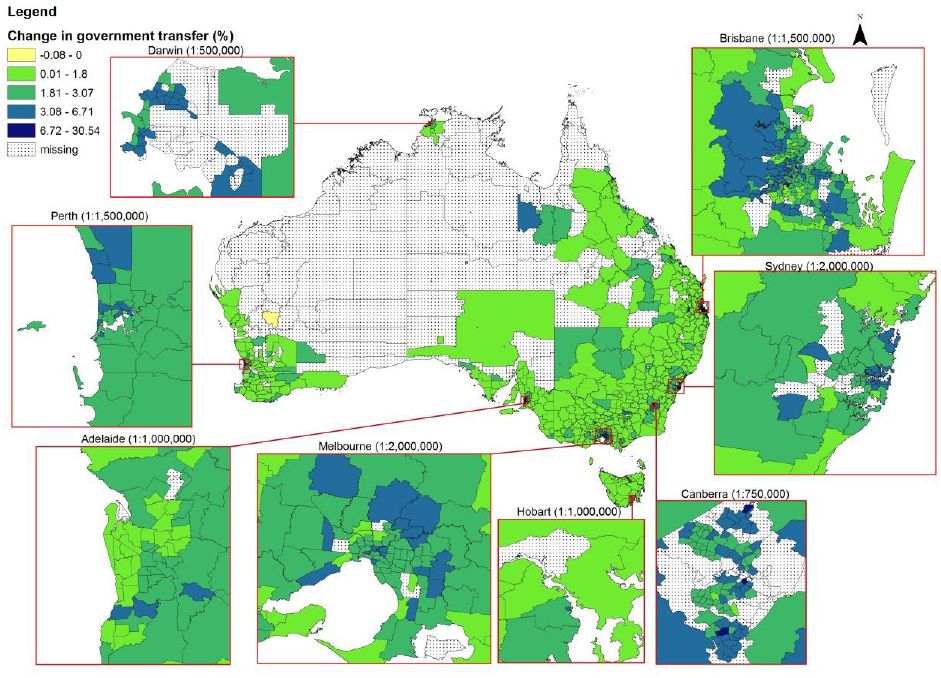
Figure 5

Spatial impact on government transfer payments as a result of a change in terms of trade.
Figure 6
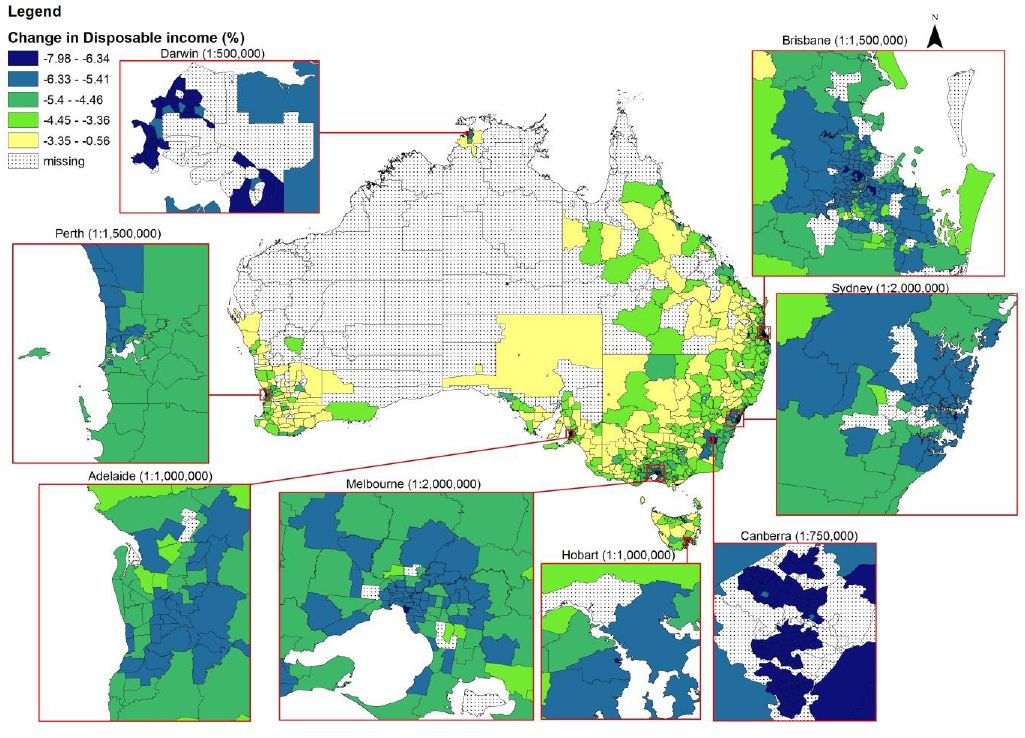

Spatial impact on disposable income as a result of a change in terms of trade.
Tables
Table 1
Employment simulation benchmark tables.
| Number | Benchmark |
|---|---|
| 1 | Number of Persons aged 15+ |
| 2 | Occupation of Reference Person by Industry of employment |
| 3 | Occupation of Spouse by Industry of employment |
| 4 | Age of Reference person by Age of Spouse by family type |
| 5 | Non School Qualification (reference person and Spouse) and Number of Dependents |
-
Source: ABS Census of Population and Housing, 2011.
Table 2
Census benchmark tables to generate dataset for small areas.
| Number | Benchmark |
|---|---|
| 1 | Age by sex by labour force status |
| 2 | Non-school qualification |
| 3 | Industry and Occupation |
| 4 | Household type |
| 5 | Number of persons usually resident in household |
| 6 | Tenure type by weekly household income |
| 7 | Dwelling structure by household family composition |
-
Source: ABS Census of Population and Housing, 2011.
Table 3
Policy simulation: A terms of trade decline of 22.6 percent (5% pa) over the 5 years from 2011–12 to 2016–17 – the percentage deviations in macro variables from the baseline forecasts.
| Macro variables | Deviations from forecast values | |
|---|---|---|
| 1 | Real GDP | −0.64 |
| 2 | Real GNE | −2.38 |
| 3 | Real GNP | −3.66 |
| 4 | Total factor productivity | 0.00 |
| 5 | Average Propensity to Consume | 0.00 |
| 6 | Real private consumption | −2.33 |
| 7 | Real public consumption | −2.33 |
| 8 | Real investment | −2.56 |
| 9 | Real exports | 2.65 |
| 10 | Real imports | −8.06 |
| 11 | Employment (hours weighted) | 0.00 |
| 12 | Employment (wage weighted) | 0.07 |
| 13 | Capital Stocks | −2.29 |
| 14 | Real wage | −8.93 |
| 15 | Nominal exchange rate | 30.23 |
| 16 | Real exchange rate | −37.91 |
| 17 | Terms of trade | −22.60 |
| 18 | Consumer price index | 0.00 |
| 19 | Price deflator for GDP | −5.52 |
| 20 | Price deflator for investment | −0.40 |
| 21 | Price deflator for consumption | −1.37 |
| 22 | Change in the ratio of balance of trade to GDP | 0.03 |
| 23 | Change in the ratio of net foreign liabilities to GDP | −0.69 |
Table 4
Movements in sectoral output and employment.
| Sector | Input (1) | Employment (2) | Wage rates (3) | |
|---|---|---|---|---|
| 1 | Agriculture, Fisheries & Forestry | 1.88 | 3.40 | −1.32 |
| 2 | Mining | 4.13 | 7.25 | −7.31 |
| 3 | Manufacturing | 2.71 | 4.47 | −5.84 |
| 4 | Electricity, Gas & Water | −0.30 | 1.89 | −8.59 |
| 5 | Construction | −2.20 | −1.76 | −10.75 |
| 6 | Wholesale Trade | −2.40 | −1.86 | −8.93 |
| 7 | Retail Trade | −3.00 | −2.35 | −11.69 |
| 8 | Accommodation, Cafes & Restaurants | −0.01 | 0.78 | −9.83 |
| 9 | Transport & Storage | 0.26 | 0.99 | −8.09 |
| 10 | Communication Services | −1.00 | 1.01 | −8.95 |
| 11 | Finance & Insurance | −0.28 | 0.73 | −7.46 |
| 12 | Property & Business Services | −0.59 | 1.66 | −8.50 |
| 13 | Professional Science & Technical Services | −1.09 | −0.83 | −8.01 |
| 14 | Administrative & Support Services | −0.50 | 0.63 | −8.24 |
| 15 | Public Administration | −2.14 | −1.69 | −8.72 |
| 16 | Education | −0.10 | 0.15 | −9.27 |
| 17 | Health & Social Services | −0.82 | −0.68 | −11.56 |
| 18 | Arts & Recreation | −1.22 | −0.58 | −9.73 |
| 19 | Other Services | −1.04 | −0.35 | −9.65 |
| 20 | Agriculture, Fisheries & Forestry | 1.88 | 3.40 | −1.32 |
| 21 | Mining | 4.13 | 7.25 | −7.31 |
| 22 | Manufacturing | 2.71 | 4.47 | −5.84 |
| 23 | Electricity, Gas & Water | −0.30 | 1.89 | −8.59 |
Table 5
National effects from the CGE and microsimulation models.
| Employment effect (%) | Income effect (%) | Total effect (%) | |
|---|---|---|---|
| Private Income | 0.15 | −8.10 | −7.95 |
| Tax paid | 0.12 | −13.47 | −13.35 |
| Government transfer | −0.21 | 1.98 | 1.77 |
| Disposable Income | 0.11 | −5.49 | −5.38 |
Download links
A two-part list of links to download the article, or parts of the article, in various formats.