Constructing an urban microsimulation model to assess the influence of demographics on heat consumption
- HafenCity University, Germany
- Article
- Figures and data
- Jump to
Figures

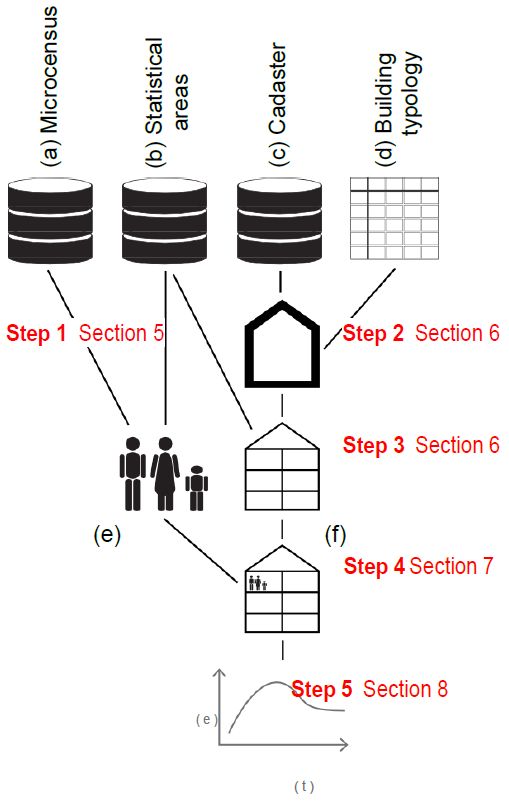
Model data structure and simulation steps.
The diagram shows the three main databases (a-c) and the additional building typology used for the classification of the building stock (d). In step 4 the synthetic families (e) are merged with the constructed dwelling units (f). The simulation of heat consumption is performed in step number 5.

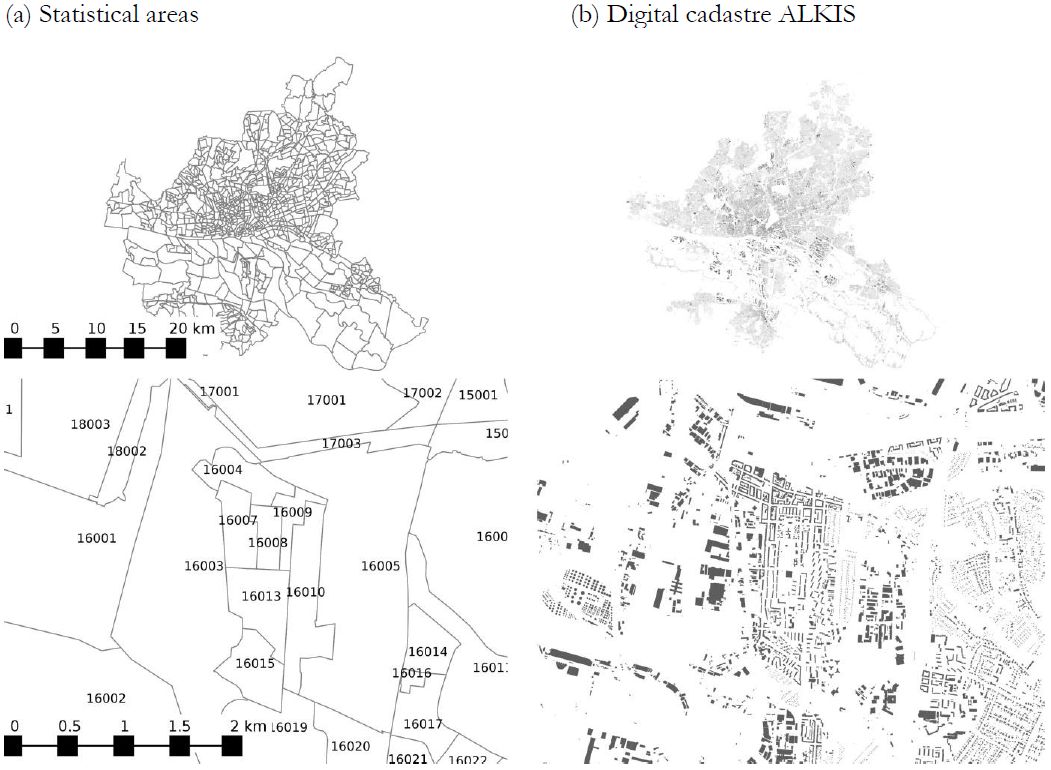
Spatial data used in our model.
(a) Statistical areas `Statistische Gebiete’’ containing aggregated sociodemographic information. Statistisches Amt für Hamburg und Schleswig-Holstein (StaNord); and (b) Digital cadaster ALKIS `Amtliches Liegenschaftskatasterinformationssystem’’. Landesbetrieb Geoinformation und Vermessung – Stadt Hamburg (2010).

Occupant influence on different building typologies arrange by construction year.

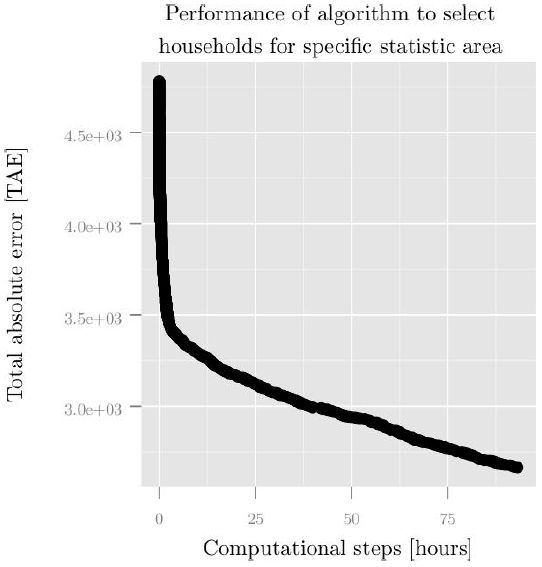
Performance of the algorithm used for selecting households to fit aggregate values of statistical area 16004.
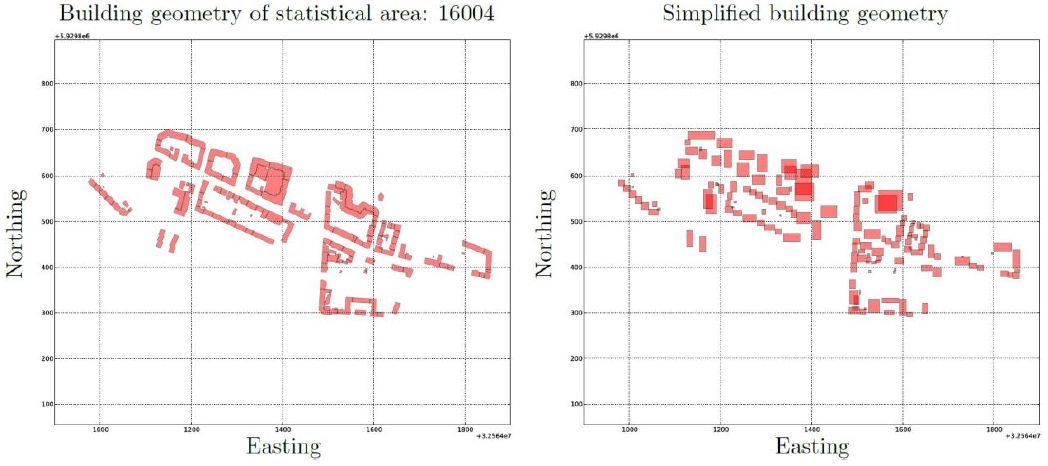
Geometrical simplification of selected buildings (left) original geometry; and (right) simplified geometry used as input for the estimation of heat demand.
(left) original geometry; and (right) simplified geometry used as input for the estimation of heat demand
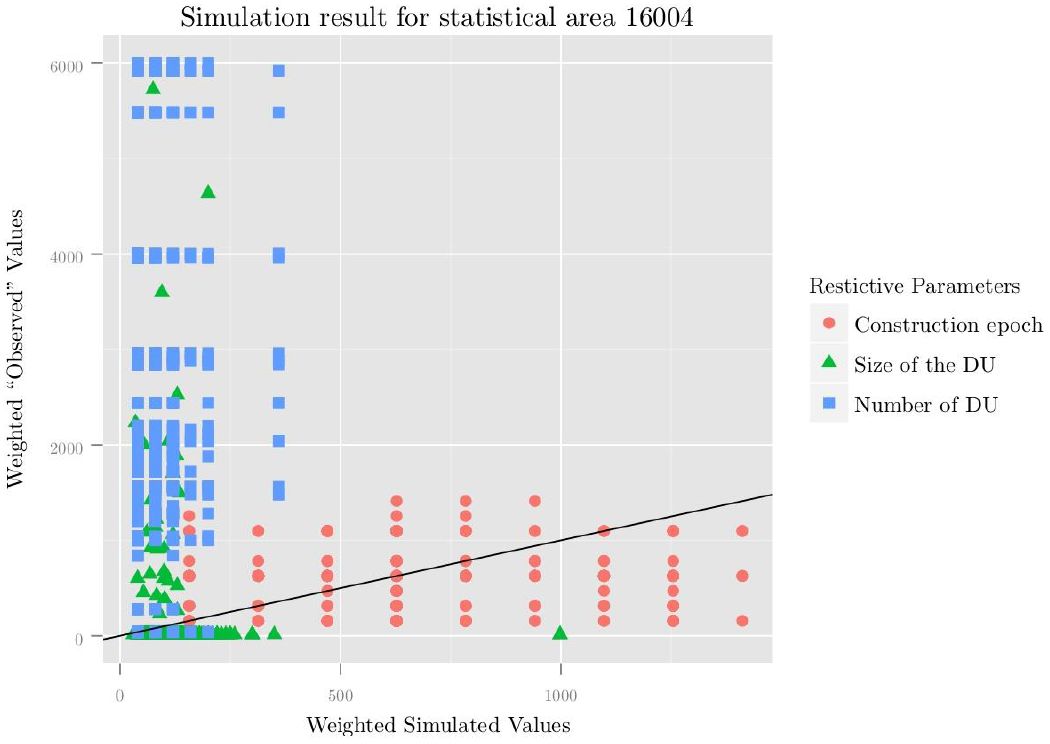
Comparison between simulated and observed parameters.
These Parameters are used as restrictions to merge the households to the dwelling units in statistical area 16,004. Result after 10e+6 (Selection of households from the micro census) + 10e+6 (merge of households with dwelling units) iterations.

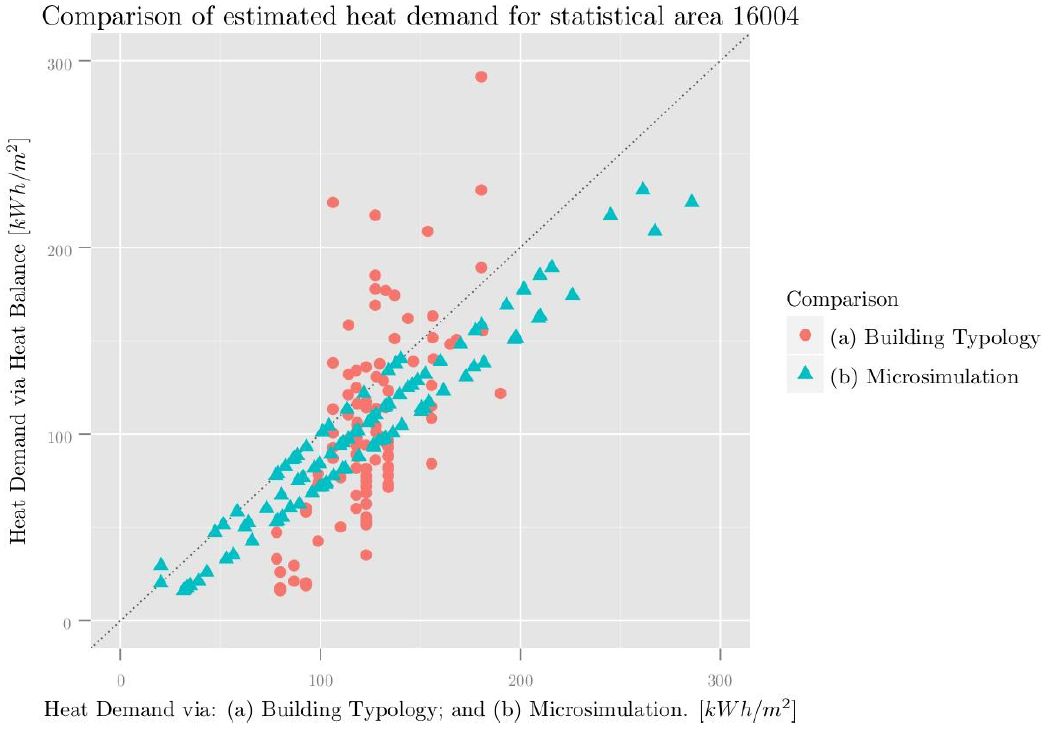
Comparison between estimated heat demand and simulated heat consumption.
Comparison between heat demand estimated with a heat balance method, using the ``average’’ occupant (vertical axis) and with help of: (a) building typologies; and (b) a heat balance, taking into account occupant influence, induce thought the synthetic simulated demographic characteristics via a spatial microsimulation (horizontal axis). This comparison shows the results of buildings in statistical area 16004.

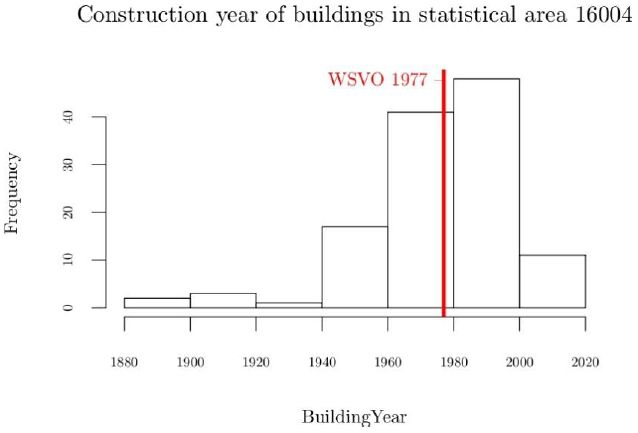
Histogram showing the frequency of construction year in statistical area 16004.
To generate this distribution only known construction years are used.
Tables
Different types of models for energy simulation of buildings.
| Model Type\Occupant Type | Static heat balance model (at individual building level) | Dynamic thermal simulation model (at individual building level) | Statistic model relating heat consumption to occupants, at various levels of aggregation, no heat balance imposed |
|---|---|---|---|
| “Average Occupant” (household comprised of identical norm persons; only their number counts) | Blesl, Kempe, Ohl and Fahl (2007), Deutsches Institut für Normung e. V (2011), Dascalaki, Droutsa, Balaras and Kontoyiannidis (2011), Loga, Diefenbach and Born (2011) | EnergyPlus Development Team (2012), Henden and Lamberts (2011) | |
| Household with individualized demographics and behaviour | Chingcuanco and Miller (2012) Munoz & Peters (2014) | Lüdemann (2001), Borgeson and Brager (2008), Page et al. (2008), Mahdavi (2011), Widén et al. (2011). | Scott (1980), Bohi and Zimmerman (1984), Guerra Santin et al. (2009). |
Variables used to fit households from the Microcensus into statistical areas.
| Constructed variables | |
|---|---|
| Variable ID | Variable Name |
| Average household size (No. of individuals per dwelling unit) | |
| Number of single households | |
| Number of households with children | |
| Number of single parent households | |
| Variables directly taken from the micro-census | Variable Name |
| ef455 | In what year was your home built? |
| ef451 | How many dwelling units has the building in which you are living? |
-
Source: MIKROZENSUS 2002 Statistisches Bundesamt (2002). Variable names: translation by the authors.
Variables used for the allocation of the synthetic households into the semi-synthetic dwelling units.
| Living standard of the household | |
|---|---|
| Variable ID | Variable Name |
| ef451 | How many dwelling units has the building in which you are living? |
| ef453 | What is the floor area of the dwelling unit? |
| ef455 | In what year was your home built? |
-
Source: MIKROZENSUS 2002 Statistisches Bundesamt (2002). Variable names: translation by the authors.
Variables used to estimate the time at home for the single individuals.
| Labor participation | |
|---|---|
| Variable ID | Variable Name |
| ef95 | Employment status in the reference week |
| ef138 | Full-time / part-time job |
| ef141 | Full-time / part-time job |
| ef147 | Work on Saturday (February until April) |
| ef148 | Work on Sundays and public holidays (February until April) |
| ef149 | Evening work (between 6 p.m and 11 p.m) (February until April) |
| ef150 | Night work (between 11 p.m and 6 a.m) (February until April) |
| ef151 | Night work hours (between 11 p.m and 6 a.m) (February until April) |
| ef163 | Home office (February until April) |
-
Source: MIKROZENSUS 2002 Statistisches Bundesamt (2002). Variable names: translation by the authors.
Rules to select input variables to the heat balance model based on the average working hours in the building.
| Computed work time (wk) | qi[W/m2] | Ti[C°] | n[h−1] | Possible occupant type | ||
|---|---|---|---|---|---|---|
| wt = | > 10 | 3 | 18 | 0.3 | single household, employed | |
| wt = ≤ 9 | ∧ | > 8 | 6 | 19 | 0.4 | both parents employed |
| wt = ≤ 8 | ∧ | > 4 | 5 | 20 | 0.5 | “average” occupant |
| wt = ≤ 4 | ∧ | > 1 | 6 | 21 | 0.6 | part time |
| wt = ≤ 1 | 7 | 22 | 0.7 | unemployed | ||
-
qi[W /m2] = Internal heat emissions; Ti[C°] = Internal temperature; and n[h−1] = Air exchange rate.
Description of some parameters of statistical area 16004 in comparison of the average value for the city of Hamburg.
| Statistical area 16004 | Hamburg | Δ | |
|---|---|---|---|
| Size of household [# individuals per household] | 2.0 | 1.8 | 0.2 |
| Share of foreign nationals [%] | 45.1 | 13.6 | 31.5 |
| Share of household with kids [%] | 26.7 | 16.9 | 9.8 |
| Share of unemployed residents*[%] | 12.2 | 4.8 | 7.4 |
| Share of single person households [%] | 49.8 | 51.2 | 1.4 |
| Number of private cars per 1000 residents [cars] | 180 | 353 | 172 |
-
*Residents between the ages of 15 and 65.