Imputing individual effects in dynamic microsimulation models an application to household formation and labour market participation in Italy
- University of Oxford Nuffield College, United Kingdom
- Collegio Carlo Alberto and LABORatorio Revelli, Italy
- LABORatorio Revelli, University of Milan-Bicocca, Italy
- Article
- Figures and data
- Jump to
Figures

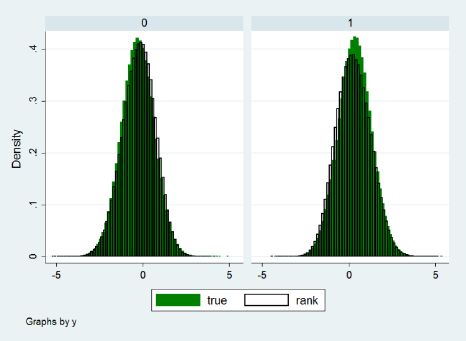
Distribution of the true and imputed (via the Rank method) individual effects. Parameterization: x~N(−0.5,2),β = β = 1, α~N(0,1),η~N(0,1).
Source: Richiardi (2014).

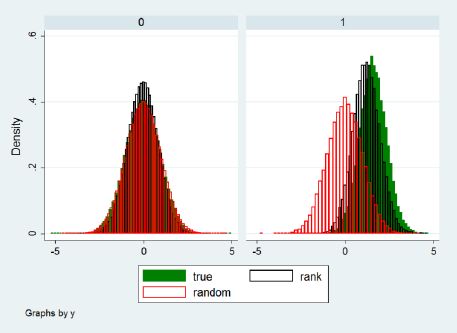
Distribution of the true and imputed (via the Rank method) individual effects, first quintile of x. Parameterization: x~N(−0.5,2),β = β = 1, α~N(0,1),η~N(0,1).
Source: Richiardi (2014).

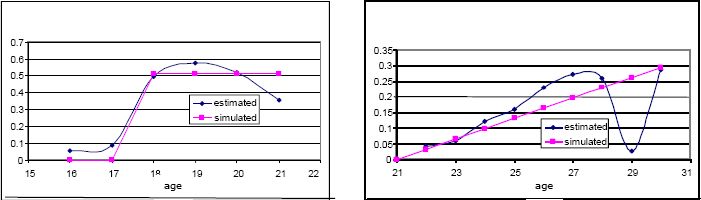
Probability of graduating, high school (left panel) and university (right panel).
Source: Leombruni and Richiardi (2006).

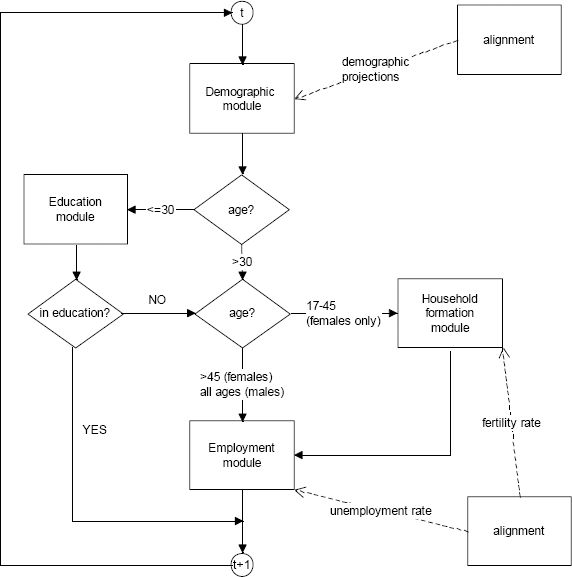
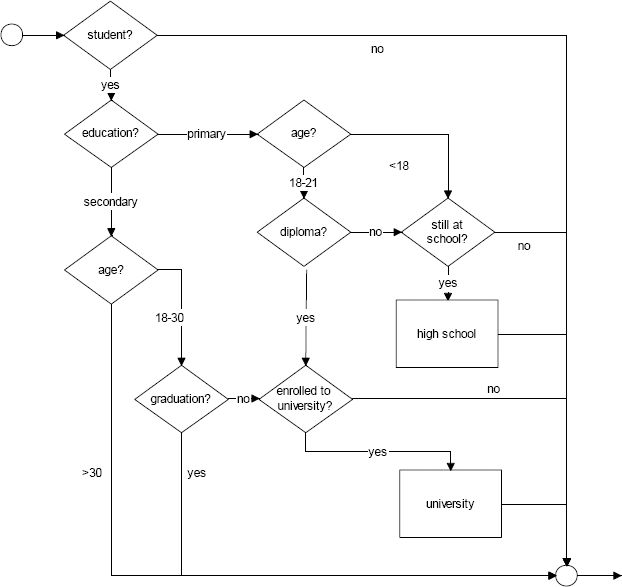
Structure of the microsimulation model.

The education module.

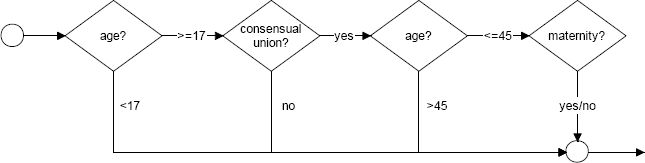
The Household formation module (females only).
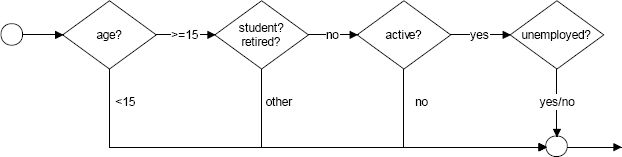
The employment module.
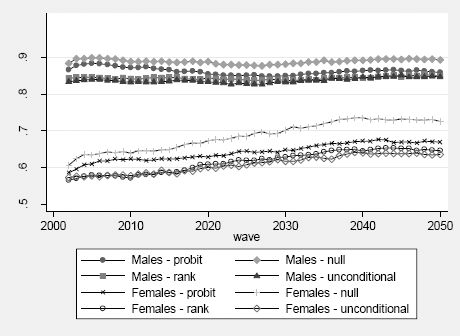
Projected participation rates, individuals aged 17–54.
Tables
Application of the Rank method. It is assumed β = β.
| (1) | (2) | (3) | (4) | (5) | (6) | (7) | (8) | (9) | (10) | |
|---|---|---|---|---|---|---|---|---|---|---|
| id | y | |||||||||
| 1 | 1 | −0.49 | 0 | 1 | 1 | −1.43 | 2.01 | 0.58 | 1 | 1 |
| 9 | 1 | −0.05 | 0 | 1 | 2 | 2.36 | −2.12 | 0.24 | 2 | 1 |
| 8 | 1 | −0.39 | 0 | 1 | 3 | 0.22 | −0.10 | 0.12 | 3 | 0 |
| 5 | 1 | −1.38 | 0 | 1 | 4 | 2.02 | −2.45 | −0.43 | 4 | 0 |
| 6 | 1 | −0.77 | 0 | 1 | 5 | −0.76 | 0.16 | −0.6 | 5 | 0 |
| 10 | 1 | 0.21 | 1 | 0 | 6 | −1.35 | 0.27 | −1.08 | 6 | 0 |
| 1 | 0 | −2.79 | 0 | 0 | 7 | 0.29 | −1.45 | −1.16 | 7 | 0 |
| 2 | 0 | −0.5 | 0 | 0 | 8 | −1.87 | 0.06 | −1.81 | 8 | 0 |
| 3 | 0 | −0.37 | 0 | 0 | 9 | −0.52 | −1.85 | −2.37 | 9 | 0 |
| 4 | 0 | 0.36 | 1 | −1 | 10 | 0.79 | −3.33 | −2.54 | 10 | 0 |
Participation rates by level of education, 2010.
| Italy | EU15 | |||
|---|---|---|---|---|
| Men | Women | Men | Women | |
| % | ||||
| Low education | 64.5 | 32.6 | 67.3 | 46.4 |
| Medium education | 80.7 | 63.1 | 82.2 | 71.2 |
| High education | 86.5 | 77.5 | 90.4 | 84.0 |
| TOTAL | 73.6 | 51.2 | 78.8 | 65.6 |
-
Source: our elaboration on Eurostat data
Status at age 17.
| In education | Active Males | Unemployed | |
|---|---|---|---|
| North | 79.8% | 17.2% | 8.6% |
| Centre | 86.0% | 10.4% | 15.0% |
| South | 82.3% | 12.2% Females | 46.9% |
| North | 86.7% | 12.1% | 19.0% |
| Centre | 86.8% | 10.2% | 35.0% |
| South | 83.7% | 9.9% | 55.8% |
-
Source: our elaboration on Italian LFS data (2001).
Enrolment.
| Secondary School (Probit) | University (Probit) | |||||
|---|---|---|---|---|---|---|
| Coef | SE | Coef. | SE | |||
| Female | −0.008 | 0.069 | 0.113 | * | 0.055 | |
| Age | −11.285 | ** | 2.665 | 0.691 | ** | 0.214 |
| Age-squared | 0.287 | ** | 0.070 | −0.016 | ** | 0.004 |
| Centre | 0.090 | 0.098 | 0.010 | 0.070 | ||
| South | 0.087 | 0.081 | 0.110 | ** | 0.033 | |
| Year of birth | 0.073 | ** | 0.021 | 0.036 | ** | 0.014 |
| Constant | −33.024 | 50.76 | −77.856 | ** | 27.901 | |
-
Source: our elaboration on ECHP 1994–2001 data.
-
*
significant at 90% confidence level.
-
**
significant at 95% confidence level.
-
*** significant at 99% confidence level
Unemployment and male participation estimates (Table legend).
| Unemployment | Male participation | |||||||
|---|---|---|---|---|---|---|---|---|
| Probit | Dynamic RE model | Probit | Dynamic RE model | |||||
| Coef. | Robust SE | Coef. | SE | Coef. | Robust SE | Coef. | SE | |
| Lag (participation) | --- | --- | --- | --- | 1.766 ** | 0.052 | 0.799 ** | 0.077 |
| Lag (unemployment) | 1.785 ** | 0.026 | 1.123 ** | 0.039 | --- | --- | --- | --- |
| Female | 0.356 ** | 0.022 | 0.592 ** | 0.049 | --- | --- | --- | --- |
| Age | −0.148 ** | 0.009 | −0.256 ** | 0.020 | 0.130 ** | 0.011 | 0.326 ** | 0.026 |
| Age^2 | 0.002 ** | 0.0001 | 0.002 ** | 0.000 | −0.002 ** | 0.000 | −0.004 ** | 0.000 |
| High education | −0.246 ** | 0.038 | −0.582 ** | 0.083 | 0.287 ** | 0.066 | 0.341 ** | 0.115 |
| Medium education | −0.237 ** | 0.022 | −0.368 ** | 0.045 | 0.110 ** | 0.032 | 0.170 ** | 0.058 |
| Centre | 0.283 ** | 0.035 | 0.463 ** | 0.078 | −0.054 | 0.046 | −0.104 | 0.088 |
| South | 0.783 ** | 0.028 | 1.508 ** | 0.065 | −0.155 ** | 0.035 | −0.313 ** | 0.069 |
| Year of birth | --- | --- | --- | --- | −0.006 | 0.007 | 0.010 | 0.014 |
| Lag (student) | 1.147 ** | 0.043 | 0.504 ** | 0.116 | 0.205 ** | 0.061 | −0.026 | 0.135 |
| Unempl.rate | 11.354 ** | 1.585 | 10.076 ** | 2.828 | --- | --- | --- | --- |
| _cons | −0.167 | 0.229 | 1.403 ** | 0.476 | 9.376 | 13.075 | −24.420 | 27.245 |
| σα | --- | 1.256 | --- | 1.071 | ||||
-
Source: our elaboration on ECHP 1994–2001 data.
-
*
significant at 90% confidence level.
-
**
significant at 95% confidence level.
-
***
significant at 99% confidence level.
Female participation and household formation estimates.
| Female participation | Living in consensual union | |||||||
|---|---|---|---|---|---|---|---|---|
| Probit | Dynamic RE model | Probit | Dynamic RE model | |||||
| Coef. | Robust SE | Coef. | SE | Coef. | Robust SE | Coef. | SE | |
| Lag (participation) | 2.387 ** | 0.027 | 1.417 ** | 0.038 | −0.049 | 0.033 | −0.093 | 0.052 |
| Lag (union) | −0.417 ** | 0.027 | −0.595 ** | 0.049 | 3.795 ** | 0.043 | 3.010 ** | 0.075 |
| Lag (children under 3) | −0.159 ** | 0.032 | −0.197 ** | 0.050 | 0.347 ** | 0.098 | 0.516 ** | 0.122 |
| Age | 0.038 ** | 0.007 | 0.087 ** | 0.015 | 0.074 ** | 0.010 | 0.263 ** | 0.036 |
| Age2 | −0.001 ** | 0.000 | −0.001 ** | 0.000 | −0.001 ** | 0.000 | −0.003 ** | 0.000 |
| High education | 0.808 ** | 0.047 | 1.665 ** | 0.093 | −0.001 | 0.060 | −0.170 | 0.093 |
| Medium education | 0.371 ** | 0.021 | 0.775 ** | 0.044 | −0.029 | 0.032 | −0.135 * | 0.057 |
| Centre | −0.116 ** | 0.027 | −0.355 ** | 0.064 | 0.052 | 0.042 | 0.145 * | 0.073 |
| South | −0.270 ** | 0.021 | −0.738 ** | 0.052 | 0.015 | 0.031 | 0.003 | 0.053 |
| Year of birth | 0.000 | 0.004 | 0.009 | 0.008 | 0.002 | 0.007 | −0.026 | 0.014 |
| Lag(student) | 0.549 | 0.056 | 0.272 * | 0.121 | −0.530 ** | 0.066 | −0.706 ** | 0.090 |
| _cons | −1.326 | 7.845 | −19.025 | 16.684 | −7.667 | 13.146 | 44.404 | 28.285 |
| σα | ---- | 1.218 | ---- | 0.890 | ||||
-
Source: our elaboration on ECHP 1994–2001 data.
-
*
significant at 90% confidence level.
-
**
significant at 95% confidence level.
-
***
significant at 99% confidence level.
Birth probability estimates the sample includes only women aged 17–45.
| Motherhood | Probit | |
|---|---|---|
| Coef. | Robust SE | |
| Lag (children under 3) | −0.571 ** | 0.050 |
| Lag (no children) | −0.371 ** | 0.084 |
| Lag (participation) | −0.037 | 0.046 |
| Lag (unemployment) | −0.087 | 0.072 |
| Lag (student) | −0.216 | 0.153 |
| Age | 0.287 ** | 0.043 |
| Age2 | −0.006 ** | 0.001 |
| High education | 0.227 ** | 0.072 |
| Medium education | 0.039 | 0.043 |
| Centre | 0.062 | 0.060 |
| South | 0.092 | 0.073 |
| Fertility rate | 11.716 * | 5.106 |
| Constant | −4.628 ** | 0.722 |
-
Source: our elaboration on ECHP 1994–2001 data.
-
*
significant at 90% confidence level.
-
**
significant at 95% confidence level.
-
***
significant at 99% confidence level.
Validation results: female participation rates (%), individuals aged 17–54.
| True data | Simulated data | |||||
|---|---|---|---|---|---|---|
| Dataset | Probit | Null | Rank | Unconditional | ||
| ECHP | 1994 | 52.85 | ||||
| 1995 | 53.22 | |||||
| 1996 | 53.66 | |||||
| 1997 | 53.80 | |||||
| 1998 | 55.52 | |||||
| 1999 | 55.49 | |||||
| 2000 | 54.76 | |||||
| 2001 | 56.24 | |||||
| EUSIC | 2005 | 59.78 | 61.02 | 63.41 | 58.01 | 57.48 |
| 2006 | 60.28 | 61.77 | 63.83 | 57.91 | 57.89 | |
| 2007 | 59.10 | 61.77 | 64.26 | 57.81 | 58.01 | |
| 2008 | 60.07 | 62.34 | 64.06 | 57.78 | 57.93 | |
| Probability of participate at time t | ||||||
| if not participate at t-1 | 17.06 | 14.22 | 34.69 | 20.29 | 20.68 | |
| if participate at t-1 | 91.05 | 93.79 | 85.78 | 89.09 | 88.41 | |
| Probability of not participate at time t | ||||||
| if not participate at t-1 | 82.94 | 85.78 | 65.31 | 79.71 | 79.32 | |
| if participate at t-1 | 8.5 | 6.21 | 14.22 | 10.91 | 11.59 | |
Coefficients of lagged endogenous variables (standard errors in parenthesis), same probit models as for input estimation. Estimation is performed on couple of years (the third column reports averages over results from 2002–2003 to 2007–2008).
| ECHP | ECHP/sim | sim | |
|---|---|---|---|
| 2000–2001 | 2001–2002 | 2002–2008 | |
| Union unconditional | 3.810 (0.087) | 1.648 (0.019) | 2.626 (0.034) |
| Null | 3.810 (0.087) | 2.285 (0.022) | 2.150 (0.036) |
| Rank | 3.810 (0.087) | 3.111 (0.026) | 2.826 (0.035) |
| Participation (males) unconditional | 2.550 (0.075) | 1.426 (0.024) | 1.728 (0.033) |
| Null | 2.550 (0.075) | 1.901 (0.026) | 1.763 (0.051) |
| Rank | 2.550 (0.075) | 2.599 (0.028) | 1.858 (0.308) |
| Participation (females) unconditional | 2.542 (0.056) | 0.638 (0.015) | 1.856 (0.024) |
| Null | 2.542 (0.056) | 0.974 (0.015) | 0.938 (0.024) |
| Rank | 2.542 (0.056) | 2.057 (0.017) | 1.990 (0.024) |