Health&WealthMOD2030: A microsimulation model of the long term economic impacts of disease leading to premature retirements of Australians aged 45–64 years old
-
Deborah Schofield

-
Rupendra Shrestha
-
Simon Kelly
-
Lennert Veerman
-
Robert Tanton
-
Megan Passey
-
Theo Vos
-
Michelle Cunich
-
Emily Callander
- Sydney Medical School, Australia
- The University of Canberra, Australia
- The University of Queensland, Australia
- North Coast, School of Public Health, Sydney Medical School, The University of Sydney PO Box 3074, Lismore, NSW 2480, Australia
Abstract
Policymakers in Australia, like in most OECD countries, have recognised the importance of early retirement due to ill health on individuals and families, as well as on the budget balance when planning for the health needs of an ageing population. In order to understand these effects, a unique microsimulation model, called Health&WealthMOD2030, was built to estimate the impacts of early retirement due to ill health on labour force participation, personal and household income, economic hardship (poverty), and government taxation revenue, spending and GDP in the years 2010, 2015, 2020, 2025 and 2030. This paper describes the construction of Health&WealthMOD2030. The model captures the long term projections of demographic change, changing labour force participation patterns, real wages growth and trends in major illnesses affecting the older working age population. The base population of Health&WealthMOD2030 are the individuals aged 45–64 years with information on their work force status and health from the Australian Bureau of Statistics’ Surveys of Disability, Ageing and Carers (SDAC) 2003 and 2009. Projected estimates of income, taxation, income support payments, savings and superannuation from the National Centre for Social and Economic Modelling (NATSEM’s) dynamic microsimulation model Australian Population and Policy Simulation Model (APPSIM) were synthetically matched with the base population. Health&WealthMOD2030 project forward the economic impacts of early retirement from ill health to 2030. This will fill substantial gaps in the current Australian evidence of health conditions that will keep older working age Australians out of the labour market over the longterm.
1. Introduction
Premature retirement due to ill health or disease can have devastating economic impacts for individuals and government. Individuals are affected through reduced income and savings resulting from early retirement; governments through reduced income taxation revenue, increased expenditure on health care, and increased income support payments. The Treasury’s Intergenerational Reports (IGRs) 2002, 2007 and 2010, and the Productivity Commission’s report on the Economic Impacts of Ageing 2005, have emphasised that demographic ageing and labour shortages are the main pressures threatening the sustainability of the Australian Budget (Commonwealth of Australia, 2002; Productivity Commission, 2005; Commonwealth of Australia, 2007; Commonwealth of Australia, 2010). In response to these challenges, the Australian Government has promoted policies for deferred or gradual retirement in order to help maintain its revenue. However, with 50% of men and 20% of women in Australia retiring early from full-time employment because of their ill health, prevention and treatment of long-term health conditions are crucial to helping people remain in the workforce longer (Australian Bureau of Statistics, 1998).
Although there is a significant body of work that estimates the burden of disease (Begg et al., 2008) and related health care costs in Australia (Australian Institute of Health and Welfare, 2004), indirect costs (i.e. costs that extend beyond those to the health system) are rarely assessed. This is surprising given that several studies have demonstrated that indirect costs for a number of conditions are higher than the direct costs to the health system (Begley et al., 2001; Taylor et al., 2006). Although not specifically focusing on indirect costs, a few ‘economics of illness’ studies have included the indirect costs of premature retirement due to illness. One recent study, which mainly focused on estimating the health care costs of arthritis, also estimated some of the financial impacts of this condition on individuals and the New Zealand Government (Access Economics, 2005). Similar studies have been published for visual impairment, cardiovascular disease, macular degeneration, and diabetes in Australia (Colagiuri et al.; Access Economics, 2005; Access Economics, 2006; Taylor et al., 2006). A number of international studies have also estimated economic costs of illness using similar methods (Moore et al., 1997; Henriksson & Jonsson, 1998; Begley et al., 2001; World Health Organisation, 2005).
However, these studies are limited in terms of scope. They have tended to focus on a single disease and contain only limited economic data e.g. excluding superannuation and asset accumulation in their assessments of the broader impacts of ill health on wealth. They have also used simplistic methods of estimation, which seems to stem from their reliance on aggregated data. For example, estimates of lost income due to illness have typically assumed that all persons included in the study would, without illness, have achieved average earnings (Schofield & Beard, 2005). Such a generalisation does not take into account the evidence that both income and type of illness differ by age, sex, education and occupation. For example, a university degree is related to 100% higher earnings in later working life, compared to earnings for people without this level of education (Johnson & Lloyd, 2000). Another limitation is that they do not provide any distributional information on the extent of incapacity. It is therefore difficult to estimate, from these studies, the probability of an effective intervention leading to greater labour force participation. It is precisely this type of information, however, that needs to be used in up-to-date microsimulation models of health, income, government income taxation and support payments, and wealth, in order to guide effective government policy.
Australia’s first microsimulation model to address these issues, Health&WealthMOD (Schofield et al., 2009; Schofield et al., 2011), has demonstrated the significant economic impacts of premature retirement due to ill health. It is estimated that there are currently approximately 650,000 Australians aged 45–64 years who are lost from the workforce because of their ill health, resulting in a loss of $12-$14 billion in GDP per annum (Schofield et al., 2008). Our previous analysis indicates that those who are out of the workforce due to illness receive a weekly income that is less than one quarter of those in full time employment. The Australian Government also loses about $300 per week in taxation per premature retiree, and pays an additional $150 per week in government income support payments such as disability support payment, on average (Schofield et al., 2011).
The health conditions accounting for the greatest number of premature retirees were found to be back injuries, arthritis and mental illness, whereas the conditions with the highest probability of causing premature retirement amongst sufferers were mental illness and heart disease. Moreover, the greater the number of chronic conditions the individual suffers, the higher the odds of them retiring early (Schofield et al., 2008). Further, although longevity is increasing, there was no evidence of improved health amongst older working aged Australians (Schofield et al., 2007).
However, estimates from Health&WealthMOD are based on a cross section of the Australian population taken at 2003. Thus, they do not take into account the economic and health trends which are important for understanding future economic impacts of ill health through early retirement. The future economic impacts of premature retirement due to illness are likely to be greater in total and result in more severe inequality between those who are able to continue to work and those who cannot.
The main drivers of the expected labour shortages are the declining fertility rate and ageing of the general population, which will be further exacerbated by the retirement of the large baby boomer cohort (Schofield & Beard, 2005). The total number of people who retire prematurely is likely to increase due to ageing of the workforce. From 2006 to 2026, over 60% of the growth in the working-age population is projected to be in the 45–64 years group. However, this is also the age group from which significant numbers retire early due to ill health (Australian Bureau of Statistics, 2005).
Further, the labour force participation rate for women is projected to increase sharply in the 45–64 years groups (Commonwealth of Australia, 2007), making them better off in terms of income and other socio-economic indicators. However, this also implies that there will be more women vulnerable to the detrimental effects of premature retirement if they become too ill to work. The combined impacts of an ageing workforce and greater female labour force participation also imply that there will be an even greater potential for effective interventions to increase overall labour force participation.
There is likely to be a widening of the income gap between Australians who are able to work and those who retire prematurely when they become ill, in terms of income earned through work and assets accumulated (wealth). The reason for this is that wage growth is running ahead of inflation, and it is anticipated that this pattern will continue as labour shortages generate an environment where employees command higher wages (Productivity Commission, 2005; Kulish et al., 2006).
Furthermore, superannuation coverage is increasing in Australia (Australian Bureau of Statistics, 2008). Superannuation in Australia is the compulsory contribution, currently at 9.5% of employees’ wages which is set to gradually increase to 12% by year 2025, that employers make on behalf of employees into superannuation funds so that the fund is available for them in retirement. Employees can also make voluntary contributions to their superannuation fund. Average superannuation balances are forecast to double from about $50,000 to about $100,000 by 2020 (Kelly et al., 2002). Therefore, the savings of older workers in the future are likely to be considerably greater than current levels, and the savings gap between those who are able to work and those who cannot, also will be greater.
Along with the type of changes in economic circumstances and the population outlined above, changes in disease prevalence may mean that the conditions related to premature retirement differ to the main conditions identified today. Hence, there is a need to determine how long term health trends (such as a rise in prevalence of diabetes), coupled with the ageing of the population and labour force participation trends will impact on the economic circumstances of individuals and the Government.
This paper describes the development of a new microsimulation model called Health&WealthMOD2030. Using this model, we will be able to undertake long term projections from 2010 to 2030 of:
Impacts of demographic changes,
Changes in the labour force participation rates for older workers (for both genders),
Impacts of superannuation changes and their flow on effect to wealth accumulation,
Real wages growth,
Trends in major illnesses which currently have a significant impact on the older workforce, and
Impacts of effective interventions to address these health conditions.
2. Methods
Health&WealthMOD2030 is a static microsimulation model designed to provide snapshots of the prevalence of diseases, socio-demographic and economic characteristics (such as income, government support payments and wealth) of Australians aged 45–64 years every five years from 2010 to 2030.
The output data files of Health&WealthMOD2030 consist of five datasets providing similar information on Australians aged 45–64 years but at different points in time (i.e. 2010, 2015, 2020, 2025 and 2030).
Health&WealthMOD2030 has four main components: i) the base population – the microdata on which the model is built; ii) output datasets of the Australian Population and Policy Simulation Model (APPSIM) (Keegan & Kelly, 2009); iii) trends in disease prevalence, and (iv) population and labour force projections from the Treasury. Figure 1 shows the schematic diagram of Health&WealthMOD2030 and how each component is linked.

Health&WealthMOD2030.
2.1 Base population
Person level unit record data of the Australian Bureau of Statistics (ABS) Surveys of Disability, Ageing and Carers (SDACs) 2003 and 2009 were chosen as the base data files for Health&WealthMOD2030 (Australian Bureau of Statistics, 2005; Australian Bureau of Statistics, 2010). These nationally representative (Australian) household survey data provide information on demographic variables (such as age, sex, family type, and state of residence), socioeconomic variables (such as level of education, income, home ownership, and benefits received), labour force variables (such as labour force participation, employment restrictions, and reason for retirement), and health and disability (such as chronic conditions, health status, type and extent of disability, support and care required) for each individual in the household. The SDACs have two samples: (i) household component samples which include individuals living in private dwellings and non-private dwellings such as hotels, motels, boarding houses and self-care components of retirement villages; and (ii) cared-accommodation component samples which included individuals living in cared accommodation (Australian Bureau of Statistics, 2005; Australian Bureau of Statistics, 2010). The base population of Health&WealthMOD2030 are Australians aged 45–64 years from the SDACs 2003 and 2009 household component.
In order to increase the number of unit records for greater variability in the data and sample of rarer population, unit records from the two SDACs 2003 and 2009 were concatenated for the base population. We extracted 8,864 unit records from the 2003 SDAC and 16,240 unit records from the 2009 SDAC to create a Health&Wealth2030 base population of 25,104 unit records. Both surveys have applied similar sampling methods and the contents that are within the scope of Health&WealthMOD2030 are comparable between the two surveys, making it possible to concatenate the two datasets after reweighting the 2003 and 2009 data to 2010 (see reweighting below).
2.2 The Australian population and policy simulation model (APPSIM)
APPSIM is a dynamic population microsimulation model that was developed to provide a snapshot of the socioeconomic characteristics (such as income and government support payments) of the Australian population annually (Keegan & Kelly, 2009). It is maintained and developed by the National Centre for Social and Economic Modelling (NATSEM). This model uses a sample of 188,000 records (1% of the 2001 Australian census population) to simulate the impact of social and fiscal policies on every Australian. As each simulated year passes, a range of events are simulated to happen in the model. The events include divorce, migration, labour force participation, disability status, earning income, paying tax, receiving income support payments, homeownership, saving, contributing to superannuation, and retiring. The probability of each of these events occurring is based on probability tables or logistic regression equations developed from historical (longitudinal) data. The modelling also includes the probabilities of death, childbirth and overseas migration, allowing the simulated population to change and age over time. The model simulates economic information such as estimates of income, income tax paid, government support payments, the values of different types of wealth assets (i.e. cash, shares, property investment, owner-occupied home and superannuation) for each individual in the APPSIM population each year (Keegan & Kelly, 2009). The APPSIM outputs one simulated dataset of the socioeconomic characteristics of the Australian population for each year to 2030.
We extracted APPSIM output datasets for individuals aged 45–64 years in five-year intervals from 2010 to 2030.
2.3 Trends in disease prevalence
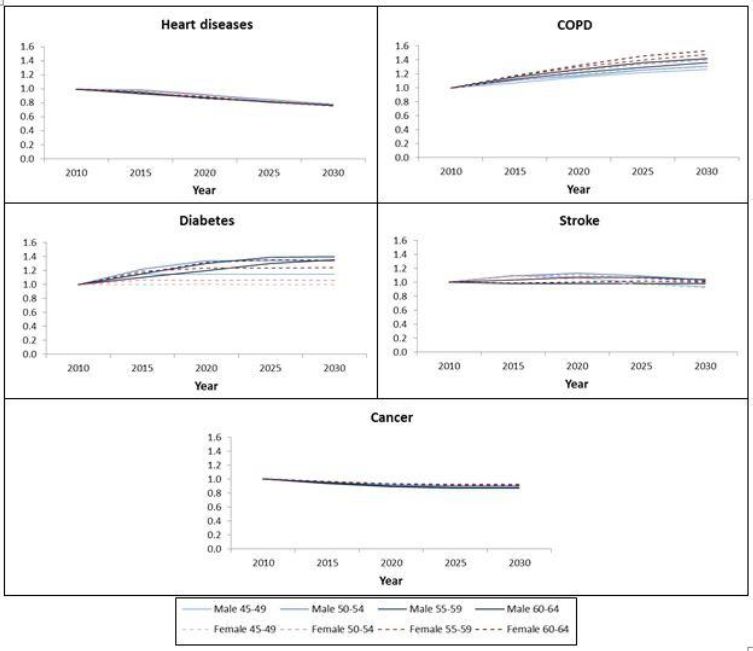
To account for disease trends, we applied the same trends in disease incidence as were used in the 2003 Australian Burden of Disease and Injury Study (Beggs et al., 2007), which had 2003 as base year and assumed that recent trends would apply until 2023, after which rates were assumed to stabilise. Proportional changes in disease prevalence were calculated for chronic conditions, aggregated into the following categories: ischaemic heart disease (the most common form of heart disease and cause of heart attacks), stroke, type 2 diabetes, chronic obstructive pulmonary disease (COPD) and cancer. For any other diseases, rates were assumed to remain stable as there was no evidence of a trend for other diseases. The proportional changes in disease prevalence were applied to the self-reported prevalence of corresponding chronic conditions amongst the 2003 and 2009 SDAC respondents (Table 1) to project the prevalence of diseases to 2010, 2015, 2020, 2025 and 2030 by five year age group and sex for the Australians aged 45 to 64 years and estimated the number of individuals with specific diseases by age group and sex for those years. Projected prevalence of disease for the 45–64 year population was close to new comparable estimates where data were available (6.7% for diabetes and 3.1% for ischaemic heart disease in 2010 in Health&WealthMOD2030 compared to 7.1% for diabetes and 3.2% for ischaemic heart disease in 2011–2012 based on the latest ABS Australian Health Survey, 2011–12)(Australian Bureau of Statistics, 2013). Figure 2 shows the prevalence of chronic conditions by five year age group and sex for 2015, 2020, 2025 and 2030, indexed from 2010. Prevalence of diabetes is expected to increase for all age and sex groups, with the highest growth in males aged 55 to 59 years old, followed by males aged 60 to 64 year old. Prevalence of diabetes is expected to increase by 40% from 2010 to 2030 in males aged 55 to 59 years old. COPD is also expected to grow for all age and sex groups, with higher growth in females than males. Heart disease is expected to decline by between 22 to 25% from 2010 to 2030 for the 45 to 64 years old population.
Prevalence of chronic conditions amongst SDAC respondents in 2003 and 2009.
| Prevalence of chronic conditions, 2003 SDAC | ||||||
|---|---|---|---|---|---|---|
| Sex | Age group | Ischaemic heart disease | Stroke | Type 2 diabetes | COPD | Cancer |
| Male | 45–49 | 1.7% | 0.5% | 3.5% | 0.6% | 0.7% |
| 50–54 | 1.5% | 1.2% | 5.5% | 0.3% | 0.7% | |
| 55–59 | 5.7% | 1.7% | 7.1% | 1.0% | 1.5% | |
| 60–64 | 9.3% | 4.1% | 11.0% | 2.2% | 3.0% | |
| 45–49 | 0.8% | 0.6% | 2.5% | 0.5% | 1.3% | |
| Female | 50–54 | 1.3% | 0.8% | 3.3% | 0.6% | 1.6% |
| 55–59 | 2.6% | 2.4% | 4.8% | 0.9% | 2.3% | |
| 60–64 | 4.9% | 1.9% | 8.2% | 2.7% | 2.1% | |
| Prevalence of chronic conditions, 2009 SDAC | ||||||
| Ischaemic heart disease | Stroke | Type 2 diabetes | COPD | Cancer | ||
| Male | 45–49 | 1.4% | 0.6% | 3.0% | 0.6% | 0.7% |
| 50–54 | 3.0% | 1.5% | 4.7% | 0.5% | 0.7% | |
| 55–59 | 4.7% | 2.2% | 9.0% | 1.0% | 1.9% | |
| 60–64 | 7.7% | 3.3% | 10.0% | 2.0% | 3.0% | |
| Female | 45–49 | 0.6% | 0.6% | 2.1% | 0.3% | 1.2% |
| 50–54 | 0.6% | 1.4% | 4.8% | 0.9% | 1.8% | |
| 55–59 | 2.2% | 2.1% | 6.6% | 1.3% | 2.2% | |
| 60–64 | 3.2% | 2.7% | 8.1% | 1.8% | 2.6% | |

Prevalence of chronic conditions by five year age group and sex, indexed from 2010.
2.4 The Treasury population and labour force projections
To account for the population growth and the trends in labour force participation, we used 2013–14 population and labour force projections provided by the Treasury. We extracted population projections and projected full time and part time labour force participation rates to 2030 for Australians aged 45 to 64 years by five year age group and sex.
2.5 Reweighting
The Health&WealthMOD2030 dataset provides socio-demographic, including health conditions, and economic characteristics for the Australian population for the year 2010 and then for every five years up to 2030 (i.e. for 2010, 2015, 2020, 2025 and 2030). Changes in the demographic structure of the population (such as ageing, labour force participation, disability and illness), from 2003 and 2009 to 2010 (and other modelled years to 2030) were captured through static ageing techniques. Both SDACs 2003 and 2009 were weighted by the ABS to address the problem of unequal probability of individual selection in the surveys, and to make the survey data a true representation of the Australian population in the survey year (Australian Bureau of Statistics, 2005; Australian Bureau of Statistics, 2010). A survey weight designed to take into account the individual’s probability of selection and the clustering and the stratification of the sample was assigned to each record in the dataset. This weight reflects the number of people with similar characteristics in the Australian population at the particular survey year. Starting with these sample weights, we then further reweighted the SDAC 2003 and 2009 to reflect the profile of the subsample aged 45–64 years in 2010 and other modelled years (2015, 2020, 2025, 2030) using a generalised regression reweighting algorithm programmed in a SAS macro called GREGWT.
This macro was developed by the ABS and is commonly used to reweight their survey data (Bell, 2000). The mathematical technique of GREGWT is described in Singh and Mohl (1996) and Tanton et al (2011). Briefly, the reweighting algorithm GREGWT uses the generalized regression method to modify initial survey weights so that the weighted totals match the externally provided totals known as benchmarks. It allows up to 30 benchmark datasets (Bell, 2000).
Population and labour force projections from the Treasury were used as benchmarks for population and labour force growth for Australians aged 45–64 years. The following projected populations were used as benchmarks.
Population by age group, sex;
Number of individuals in full time labour force by age group and sex;
Number of individuals in part time labour force by age group and sex.
In order to address socioeconomic changes in the subsample of Australians aged 45–64 years, benchmark datasets were based on APPSIM outputs for the corresponding years. The following six populations were used as benchmark populations during reweighting. Benchmark populations were derived by applying distributions from APPSIM datasets to the Treasury population projections.
Population by age group, sex and income quintiles;
Population by age group, sex and highest level of education;
Population by age group, sex and whether or not receiving disability support pension;
Population by income unit type;
Population by age group, sex and whether or not owns a home.
In order to address changes in the number of individuals with chronic conditions that are most likely to change in prevalence as discussed above, the projected number of individuals with the following five chronic conditions were used as benchmarks for reweighting.
Projected number of individuals with diabetes by age group and sex;
Projected number of individuals with heart disease by age group and sex;
Projected number of individuals with chronic obstructive pulmonary disease (COPD) by age group and sex;
Projected number of individuals who had stroke by age group and sex;
Projected number of individuals with cancer by age group and sex.
2.6 Synthetic matching of Health&WealthMOD2030 base population with APPSIM population
The SDACs 2003 and 2009 included only limited economic information. In order to generate estimates of more detailed economic variables (such as income, government support payments, income tax paid and the values of different types of wealth assets) for each unit record in the concatenated SDAC data file, unit records from the reweighted SDACs were linked with APPSIM unit records for corresponding years using synthetic matching – a process commonly used in microsimulation modelling (Rässler, 2002). This procedure created a synthetic dataset that had socio-demographic, health and disability, labour force and detailed economic data for the population aged 45–64 years. Synthetic matching was completed for five-year intervals from 2010 to generate the population for the years 2010, 2015, 2020, 2025 and 2030.
The first step in synthetic matching involved identifying the matching variables that are common to both datasets (i.e. the reweighted SDAC and APPSIM output for the development of Health&WealthMOD2030), and strongly related to the income. The ten variables used as matching variables for synthetic matching and their categories are listed in Table 1. In the synthetic matching process, unit records in two unique datasets are first grouped into homogeneous cells (sometimes called bins) based on the matching variables. Each unit record within a cell from one dataset are synthetically linked with the closest matching record, with replacement, from the corresponding cell of another dataset. To match economic data from APPSIM, SDAC unit records were linked with APPSIM unit records with similar characteristics based on the ten matching variables listed in Table 2.
Synthetic matching variables and their categories in Health&WealthMOD2030.
| Group | Matching variables | Categories | |
|---|---|---|---|
| Labour force status | • Employed full-time • Employed part-time • Unemployed looking for work • Not in the labour force |
||
| Income unit type | a. Married couple with dependents b. Married couple only c. One parent with dependents d. One person |
||
| Group A | Income quintile | a. 1st quintile b. 2nd quintile c. 3rd quintile d. 4th quintile e. 5th quintile |
|
| Receiving age pension | a. Yes b. no | ||
| Receiving disability support pension | a. Yes b. no |
||
| Sex | a. male b. female | ||
| Age group | a. 45–49 years b. 50–54 years c. 55–59 years d. 60–64 years | ||
| Group B | Hours worked per week | a. not applicable b. 1–15 hours c. 16–24 hours d. 25–34 hours e. 35–40 hours f. +41 hours |
|
| Highest level of educational qualification | a. university b. non-university | ||
| Home ownership | a. yes b. no | ||
Based on the total permutation of the ten matching variables for Health&WealthMOD2030, we had 17,920 distinct cells1, with numerous cells having zero or a very few records. This is not important where there are no records in either dataset (77.4%) but is important if there are records in SDAC cells but no record in the corresponding APPSIM cells (4%). To overcome this problem, we used less than ten matching variables for some cells to avoid having no matching records, thereby allowing matching with the records from a neighbouring cell. To determine which matching variables would be used, we grouped the ten matching variables into two groups (Table 2), and the distinct cells were first created on the basis of the five matching variables in Group A instead of the full set. The remaining five matching variables in Group B were ranked for each cell based on how much variation in income could be explained by each Group B matching variable as measured by the R2 of a linear regression model from the APPSIM data. The ranking of Group B matching variables may be different for different cells (Figure 3). For example, for the unit records in Cell 2, which has the following characteristics: employed full time; married couple with dependents; 2nd income quintile; no age pension; no disability support pension, the next matching variable to group the unit records was “home ownership”. However, for the unit records in Cell 4, which had the same characteristics except for “4th income quintile” instead of “2nd income quintile”, the next matching variable to group the unit records was “sex”. Once the unit records were grouped into new cells, the remaining matching variables were further ranked for each newly created cell based on how much variation in income could be explained by each remaining matching variable as measured by the R2 of a linear regression model from the records in that cell and the unit records in each cell were further grouped into new cells based on the variable that explained the highest variation in income. The process continues until either all five Group B matching variables were used (i.e. cells are based on all ten matching variables) or there were no more than ten records left in the cell of APPSIM. Thus for some cells, not all ten variables were used.

Example of synthetic matching for two cells in Health&WealthMOD2030.
Once the unit records were grouped into homogeneous cells based on matching variables in both the reweighted SDACs and APPSIM data files, each SDAC unit record within a cell was synthetically linked with the closest matching APPSIM unit record of the corresponding cell, with replacement. The closest matching unit record was identified using a standardized Euclidean Distance method, and the distance was based on the ten matching variables. The record with the minimum standardized Euclidean Distance was selected as the closest match. In the event that there is more than one closest match, the record was chosen randomly from the pool of closest matching unit records. Under this process, the same unit record in APPSIM could be synthetically matched with multiple SDAC records and some APPSIM unit records may not be matched at all.
2.7 Synthetic matching of SDAC records with APPSIM records
More than 90% of SDAC unit records were synthetically matched with APPSIM unit records of the same category for each of the ten matching variables (Table 3). Most of SDAC unit records (99.79% in 2010, 99.83% in 2020 and 2030) were matched with APPSIM unit records of the same categories for eight or more matching variables (Table 3). The analysis of how well SDAC unit records were matched with APPSIM unit records for each matching variable shows that all matching variables were matched within 3% accuracy (Table 4).
Degree of exact synthetic matching of SDAC and APPSIM unit records.
| No. of synthetic matching variables that have the categories exactly matched | Year 2010 | Year 2020 | Year 2030 | |||
|---|---|---|---|---|---|---|
| No. of SDAC unit records | % | No. of SDAC unit records | % | No. of SDAC unit records | % | |
| 10 | 23,356 | 93.04 | 23,042 | 91.79 | 22,854 | 91.04 |
| 9 | 24,682 | 98.32 | 24,650 | 98.19 | 24,777 | 98.7 |
| 8 | 25,052 | 99.79 | 25,061 | 99.83 | 25,060 | 99.83 |
| 7 | 25,102 | 99.99 | 25,096 | 99.97 | 25,098 | 99.98 |
| 6 | 25,104 | 100 | 25,102 | 99.99 | 25,103 | 100 |
| 5 | 25,104 | 100 | 25,104 | 100 | 25,104 | 100 |
| Total unit records | 25,104 | 25,104 | 25,104 | |||
Number of SDAC unit records that matched with APPSIM unit records of different categories of synthetic matching variables due to matching with a close neighbour cell.
| Synthetic matching variables | Year 2010 | Year 2020 | Year 2030 | |||
|---|---|---|---|---|---|---|
| No. of SDAC unit records matched with APPSIM unit records of different category | % | No. of SDAC unit records matched with APPSIM unit records of different category | % | No. of SDAC unit records matched with APPSIM unit records of different category | % | |
| Sex | 325 | 1.3% | 140 | 0.6% | 211 | 0.8% |
| Income unit type | 0 | 0% | 0 | 0% | 0 | 0% |
| Income quintiles | 487 | 1.9% | 629 | 2.5% | 625 | 2.5% |
| Receiving age | 1 | 0.0% | 494 | 2% | 494 | 2% |
| pension | ||||||
| Receiving | 1 | 0.0% | 21 | 0.1% | 0 | 0% |
| disability support | ||||||
| pension | ||||||
| Age group | 281 | 1.1% | 477 | 1.9% | 586 | 2.3% |
| Labour force | 0 | 0% | 0 | 0% | 0 | 0% |
| status | ||||||
| Hours worked per | 747 | 3% | 585 | 2.3% | 420 | 1.7% |
| week | ||||||
| Highest level of | 121 | 0.5% | 35 | 0.1% | 18 | 0.1% |
| education | ||||||
| Home ownership | 251 | 1.0% | 188 | 0.7% | 274 | 1.1% |
3. Discussion
We have developed a new microsimulation model called Health&WealthMOD2030 to project the economic impacts of chronic conditions leading to early exit from the labour force of Australians aged 45–64 years in 2010. Health&WealthMOD2030 captures the impacts of population ageing, changing labour force participation patterns, income and savings trends, and changes in the prevalence of the most disabling conditions. Health&WealthMOD2030 will be used to estimate (i) the number of people out of the labour force due to their ill health; (ii) the lost income and savings of people who have left the labour force because of their ill health, compared to those who continued in paid employment; and (iii) the extent of these losses due to: demographic, disease, or economic trends at 2010, 2015, 2020, 2025 and 2030. Health&WealthMOD2030 will also be used to estimate the potential long-term economic gains from health interventions that address particular health conditions (such as mental health disorders), and risk factors such as obesity and physical inactivity.
It would be ideal to create a base population for a microsimulation model from a single dataset with all key information (e.g. chronic conditions and economic information for Health&WealthMOD2030). In absence of a dataset containing such detailed information on both chronic conditions and individual economic circumstances, we sourced our base population from the SDAC datasets (containing information on chronic conditions and limited economic data) and have linked the records with the APPSIM population (which contains detailed economic information). It is not possible to exactly match individuals between the SDAC and APPSIM for a number of reasons. Firstly, there was no unique identifier to link the two datasets. Furthermore, the SDAC is based on random survey data and APPSIM is a one percent sample of the census population. Although both are nationally representative samples, there will be a very few, if any, respondents in common on both data sources. Further, the data were collected at different points in time. While the SDAC data were collected in 2003 and 2009, APPSIM data were simulated events on 2001 data for the future years meaning that even for the few individuals that may be in common, some variables will no longer be the same between the SDAC and APPSIM. Finally, within Australia, exact matching between ABS surveys is prohibited. As a result of these constraints, we linked SDAC records with APPSIM records using synthetic matching based on ten synthetic matching variables. Synthetic matching was used to match individuals from the SDAC dataset to individuals with similar characteristics on the APPSIM dataset and create a synthetic population, which is a nationally representative sample of the whole Australian population. The method is commonly used in microsimulation models to create synthetic datasets (Hynes et al., 2006; von Randow et al., 2012).
One of the limitations of synthetic matching is that unit records from one dataset can be matched with the unit records of different categories of matching variables in another dataset creating a mismatch in the categories of the same matching variables. We have limited this mismatch by identifying the closest matching APPSIM unit record for each SDAC unit record using a standardized Euclidean Distance method based on the ten matching variables. Health&WealthMOD2030 has 99% of SDAC unit records matched with APPSIM unit records of the same categories for eight or more matching variables, with more than 90% matched for each of the ten matching variables.
An unconstrained synthetic matching process was used in developing Health&WealthMOD2030 allowing multiple SDAC unit records to be synthetically matched with one APPSIM unit record based on the closest matching record. This process also allows some APPSIM unit records to be completely dropped from Health&WealthMOD2030 if there is no SDAC unit record that is synthetically matched with them. This means that there are inherent differences in the distribution of the information in APPSIM and Health&WealthMOD2030, and as a result there is the potential for the distributions of economic variables in Health&WealthMOD2030 to be different from the original distributions in APPSIM (i.e. benchmark distributions). For example, there is a 0.05% difference in average annual benefits received between APPSIM and Health&WealthMOD2030.
The Australian Government is seeking new ways to enable older workers to remain in the workforce longer, largely due to its need to manage expected labour shortages and ensure adequate taxation revenue to fund the needs of its ageing population. A longer time in the workforce also tends to generate benefits to individuals in terms of available income and greater capacity to save for a higher standard of living in retirement. Whilst the Government recognises that not all older workers are able to participate in the labour force for as long as they would like (due to their own ill health and informal caregiving to family members who are disabled or ill for example) (Moore et al., 1997), there is little information available on the type of health conditions that are likely to keep people out of the labour force over the long-term. Nor is there information about how these conditions will differ from current patterns in the future, and the extent of the flow-on economic impacts of premature retirement for individuals or the Government.
Australia’s population is ageing and, consequently, it is widely recognised that there will be a significant increase in the demand for health care (Schofield & Earnest, 2006). However, with an ageing workforce, Australia is also at risk of having an inadequate source of labour from which to maintain taxation revenue to support these needs. Similarly, there are health trends, such as the rapid rise in diabetes, which may adversely affect the health and labour force participation of our ageing workforce.
Results from Health&WealthMOD2030 will help to fill substantial gaps in current Australian evidence on the health conditions likely to keep older workers out of the labour force over the long term and diminish their standard of living. Using this model, we will be able to contribute to existing evidence on how fundamental demographic changes in the Australian workforce are likely to impact on economic sustainability – an issue regularly highlighted by policymakers after release of the Treasury Intergenerational Reports (Commonwealth of Australia, 2002; Commonwealth of Australia, 2007; Commonwealth of Australia, 2010). For example, the Treasurer Wayne Swan in the 2001–12 Budget Speech said: “We believe our economy can’t afford to waste a single pair of capable hands” (The honourable Wayne Swan MP, 2011) when referring to work and its impact on sustainability.
The techniques used in Health&WealthMOD2030 will ensure that policymakers are drawing on reliable estimates of the long-term costs (from an individual and government perspective) of ill health leading to unplanned retirement, and the number of individuals who realistically may be able to continue to work in older age as the population grows.
Footnotes
1.
“Employed full time” can be combined with only two categories for hours worked per week: 35-40 hours and 41+ hours. “Employed part time” be combined with three possible categories: 1-15 hours, 16-24 hours and 25-34 hours. “Unemployed looking for work” and “Not in the labour force” groups can be combined with only “Not applicable” category for hours worked per week.
References
-
1
The Economic Cost of Arthritis in New ZealandThe Economic Cost of Arthritis in New Zealand, Arthritis New Zealand.
-
2
The Shifting Burden of Cardiovascular Disease in AustraliaNational Heart Foundation of Australia.
- 3
-
4
Retirement and Retirement Intentions SurveyRetirement and Retirement Intentions Survey, Cat No. 6238.0, Australian Bureau of Statistics, Canberra.
-
5
Information Paper - Basic Confidentialised Unit Record File: Survey of Disability, Ageing and Carers 2003 (reissue)Canberra: Australian Bureau of Statistics.
-
6
Population Projection for Australia, 2002 - 2101Canberra: Australian Bureau of Statistics.
-
7
Empolyment arrangements, retirement and superannuation, AustraliaEmpolyment arrangements, retirement and superannuation, Australia, Cat 6261.0, Canberra.
-
8
2009 Disability, Ageing and Carers, Australia: Summary of findingsCanberra: Australian Bureau of Statistics.
- 9
- 10
-
11
Burden of disease and injury in Australia in the new millennium: measuring health loss from diseases, injuries and risk factors’Med J Aust 188:36–40.
- 12
-
13
The lifetime cost of bipolar disorder in the US: an estimate for new cases in 1998’Pharmacoeconomics 19:483–495.
-
14
GREGWT and TABLE macros - users guide.Canberra: Australian Bureau of Statistics (ABS).
-
15
Cost of type 2 diabetes care in Australia - the DiabCost studyet al, Cost of type 2 diabetes care in Australia - the DiabCost study, Ansers that matter, Lilly, Diabetes Australia.
-
16
Intergenerational Report 2002-03’, 2002-03 Budget paper no. 5Canberra: Department of The Treasury.
- 17
- 18
-
19
The economic cost of multiple sclerosis in Sweden in 1994’Pharmacoeconomics 13:597–606.
-
20
Building a static farm level spatial microsimulation model: statistically matching the Irish national farm survey to the Irish census of agriculture46th Congress of the European Regional Science Association. 30.
- 21
-
22
APPSIM - Dynamic microsimulation modelling of social security and taxationCanberra: National Centre for Social and Economic Modelling, University of Canberra.
-
23
Living long and prosper? Projecting the likely superannuation of the baby boomers in 2020Canberra: NATSEM.
-
24
Ageing, retirement and savings: A general equilbrium analysis. Research Discussion Paper 2006-06Canberra: Reserve Bank of Australia.
- 25
- 26
-
27
Statistical matching: a frequentist theory, practical applications, and alternative Bayesian approachesNew York; London: Springer.
-
28
Health&WealthMOD: A microsimulation model of the economic impacts of diseases on older workers’International Journal of Microsimulation 2:58–63.
-
29
Modelling the cost of ill health in Health&WealthMOD (Version II): lost labour force participation, income and taxation, the impact of disease prevention’The International Journal of Microsimulation 4:32–36.
-
30
Baby boomer doctors and nurses: demographic change and transitions to retirement’Med J Aust 183:80–83.
-
31
Demographic change and the future demand for public hospital care in Australia, 2005 to 2050’Aust Health Rev 30:507–515.
-
32
Are we getting healthier as we grow older? Implications for babyboomer labor force participation’Ann N Y Acad Sci 1114:230–240.
-
33
Chronic disease and labour force participation among older Australians’Med J Aust 189:447–450.
-
34
Economic impacts of illness in older workers: quantifying the impact of illness on income, tax revenue and government spending’et al, BMC Public Health, 11, 418.
-
35
Understanding calibration estimators in survey sampling’Survey Methodology 22:107–115.
- 36
-
37
The economic impact and cost of visual impairment in Australia’Br J Ophthalmol 90:272–275.
- 38
-
39
Data matching to allocate doctors to patients with microsimulation model of the primary care process in New Zealand’Social Science Computer Review 30:358–368.
- 40
Article and author information
Author details
Acknowledgements
The development and application of the microsimulation model outlined in this paper, Health&WealthMOD2030, is funded by the Australian Research Council (under grant LP100100158), and Pfizer Australia is a partner to the grant. All authors are independent from the funding sources.
Publication history
- Version of Record published: August 31, 2014 (version 1)
Copyright
© 2014, Schofield et al.
This article is distributed under the terms of the Creative Commons Attribution License, which permits unrestricted use and redistribution provided that the original author and source are credited.