Health&WealthMOD2030: A microsimulation model of the long term economic impacts of disease leading to premature retirements of Australians aged 45–64 years old
-
Deborah Schofield

-
Rupendra Shrestha
-
Simon Kelly
-
Lennert Veerman
-
Robert Tanton
-
Megan Passey
-
Theo Vos
-
Michelle Cunich
-
Emily Callander
- Sydney Medical School, Australia
- The University of Canberra, Australia
- The University of Queensland, Australia
- North Coast, School of Public Health, Sydney Medical School, The University of Sydney PO Box 3074, Lismore, NSW 2480, Australia
Cite this article
as: D. Schofield, R. Shrestha, S. Kelly, L. Veerman, R. Tanton, M. Passey, T. Vos, M. Cunich, E. Callander; 2014; Health&WealthMOD2030: A microsimulation model of the long term economic impacts of disease leading to premature retirements of Australians aged 45–64 years old; International Journal of Microsimulation; 7(2); 94-118.
doi: 10.34196/ijm.00101
- Article
- Figures and data
- Jump to
Figures
Figure 1

Health&WealthMOD2030.
Figure 2

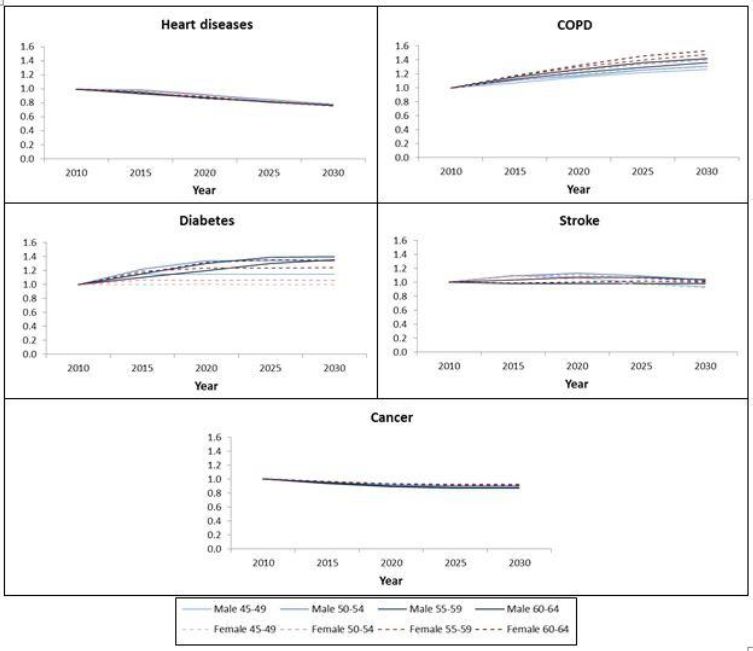
Prevalence of chronic conditions by five year age group and sex, indexed from 2010.
Figure 3

Example of synthetic matching for two cells in Health&WealthMOD2030.
Tables
Table 1
Prevalence of chronic conditions amongst SDAC respondents in 2003 and 2009.
| Prevalence of chronic conditions, 2003 SDAC | ||||||
|---|---|---|---|---|---|---|
| Sex | Age group | Ischaemic heart disease | Stroke | Type 2 diabetes | COPD | Cancer |
| Male | 45–49 | 1.7% | 0.5% | 3.5% | 0.6% | 0.7% |
| 50–54 | 1.5% | 1.2% | 5.5% | 0.3% | 0.7% | |
| 55–59 | 5.7% | 1.7% | 7.1% | 1.0% | 1.5% | |
| 60–64 | 9.3% | 4.1% | 11.0% | 2.2% | 3.0% | |
| 45–49 | 0.8% | 0.6% | 2.5% | 0.5% | 1.3% | |
| Female | 50–54 | 1.3% | 0.8% | 3.3% | 0.6% | 1.6% |
| 55–59 | 2.6% | 2.4% | 4.8% | 0.9% | 2.3% | |
| 60–64 | 4.9% | 1.9% | 8.2% | 2.7% | 2.1% | |
| Prevalence of chronic conditions, 2009 SDAC | ||||||
| Ischaemic heart disease | Stroke | Type 2 diabetes | COPD | Cancer | ||
| Male | 45–49 | 1.4% | 0.6% | 3.0% | 0.6% | 0.7% |
| 50–54 | 3.0% | 1.5% | 4.7% | 0.5% | 0.7% | |
| 55–59 | 4.7% | 2.2% | 9.0% | 1.0% | 1.9% | |
| 60–64 | 7.7% | 3.3% | 10.0% | 2.0% | 3.0% | |
| Female | 45–49 | 0.6% | 0.6% | 2.1% | 0.3% | 1.2% |
| 50–54 | 0.6% | 1.4% | 4.8% | 0.9% | 1.8% | |
| 55–59 | 2.2% | 2.1% | 6.6% | 1.3% | 2.2% | |
| 60–64 | 3.2% | 2.7% | 8.1% | 1.8% | 2.6% | |
Table 2
Synthetic matching variables and their categories in Health&WealthMOD2030.
| Group | Matching variables | Categories | |
|---|---|---|---|
| Labour force status | • Employed full-time • Employed part-time • Unemployed looking for work • Not in the labour force |
||
| Income unit type | a. Married couple with dependents b. Married couple only c. One parent with dependents d. One person |
||
| Group A | Income quintile | a. 1st quintile b. 2nd quintile c. 3rd quintile d. 4th quintile e. 5th quintile |
|
| Receiving age pension | a. Yes b. no | ||
| Receiving disability support pension | a. Yes b. no |
||
| Sex | a. male b. female | ||
| Age group | a. 45–49 years b. 50–54 years c. 55–59 years d. 60–64 years | ||
| Group B | Hours worked per week | a. not applicable b. 1–15 hours c. 16–24 hours d. 25–34 hours e. 35–40 hours f. +41 hours |
|
| Highest level of educational qualification | a. university b. non-university | ||
| Home ownership | a. yes b. no | ||
Table 3
Degree of exact synthetic matching of SDAC and APPSIM unit records.
| No. of synthetic matching variables that have the categories exactly matched | Year 2010 | Year 2020 | Year 2030 | |||
|---|---|---|---|---|---|---|
| No. of SDAC unit records | % | No. of SDAC unit records | % | No. of SDAC unit records | % | |
| 10 | 23,356 | 93.04 | 23,042 | 91.79 | 22,854 | 91.04 |
| 9 | 24,682 | 98.32 | 24,650 | 98.19 | 24,777 | 98.7 |
| 8 | 25,052 | 99.79 | 25,061 | 99.83 | 25,060 | 99.83 |
| 7 | 25,102 | 99.99 | 25,096 | 99.97 | 25,098 | 99.98 |
| 6 | 25,104 | 100 | 25,102 | 99.99 | 25,103 | 100 |
| 5 | 25,104 | 100 | 25,104 | 100 | 25,104 | 100 |
| Total unit records | 25,104 | 25,104 | 25,104 | |||
Table 4
Number of SDAC unit records that matched with APPSIM unit records of different categories of synthetic matching variables due to matching with a close neighbour cell.
| Synthetic matching variables | Year 2010 | Year 2020 | Year 2030 | |||
|---|---|---|---|---|---|---|
| No. of SDAC unit records matched with APPSIM unit records of different category | % | No. of SDAC unit records matched with APPSIM unit records of different category | % | No. of SDAC unit records matched with APPSIM unit records of different category | % | |
| Sex | 325 | 1.3% | 140 | 0.6% | 211 | 0.8% |
| Income unit type | 0 | 0% | 0 | 0% | 0 | 0% |
| Income quintiles | 487 | 1.9% | 629 | 2.5% | 625 | 2.5% |
| Receiving age | 1 | 0.0% | 494 | 2% | 494 | 2% |
| pension | ||||||
| Receiving | 1 | 0.0% | 21 | 0.1% | 0 | 0% |
| disability support | ||||||
| pension | ||||||
| Age group | 281 | 1.1% | 477 | 1.9% | 586 | 2.3% |
| Labour force | 0 | 0% | 0 | 0% | 0 | 0% |
| status | ||||||
| Hours worked per | 747 | 3% | 585 | 2.3% | 420 | 1.7% |
| week | ||||||
| Highest level of | 121 | 0.5% | 35 | 0.1% | 18 | 0.1% |
| education | ||||||
| Home ownership | 251 | 1.0% | 188 | 0.7% | 274 | 1.1% |
Download links
A two-part list of links to download the article, or parts of the article, in various formats.