Spot on or way off? Validating results of the AVID microsimulation model retrospectively
- Deutsche Rentenversicherung Bund, Germany
Cite this article
as: D. Frommert; 2015; Spot on or way off? Validating results of the AVID microsimulation model retrospectively; International Journal of Microsimulation; 8(1); 3-32.
doi: 10.34196/ijm.00110
- Article
- Figures and data
- Jump to
Figures
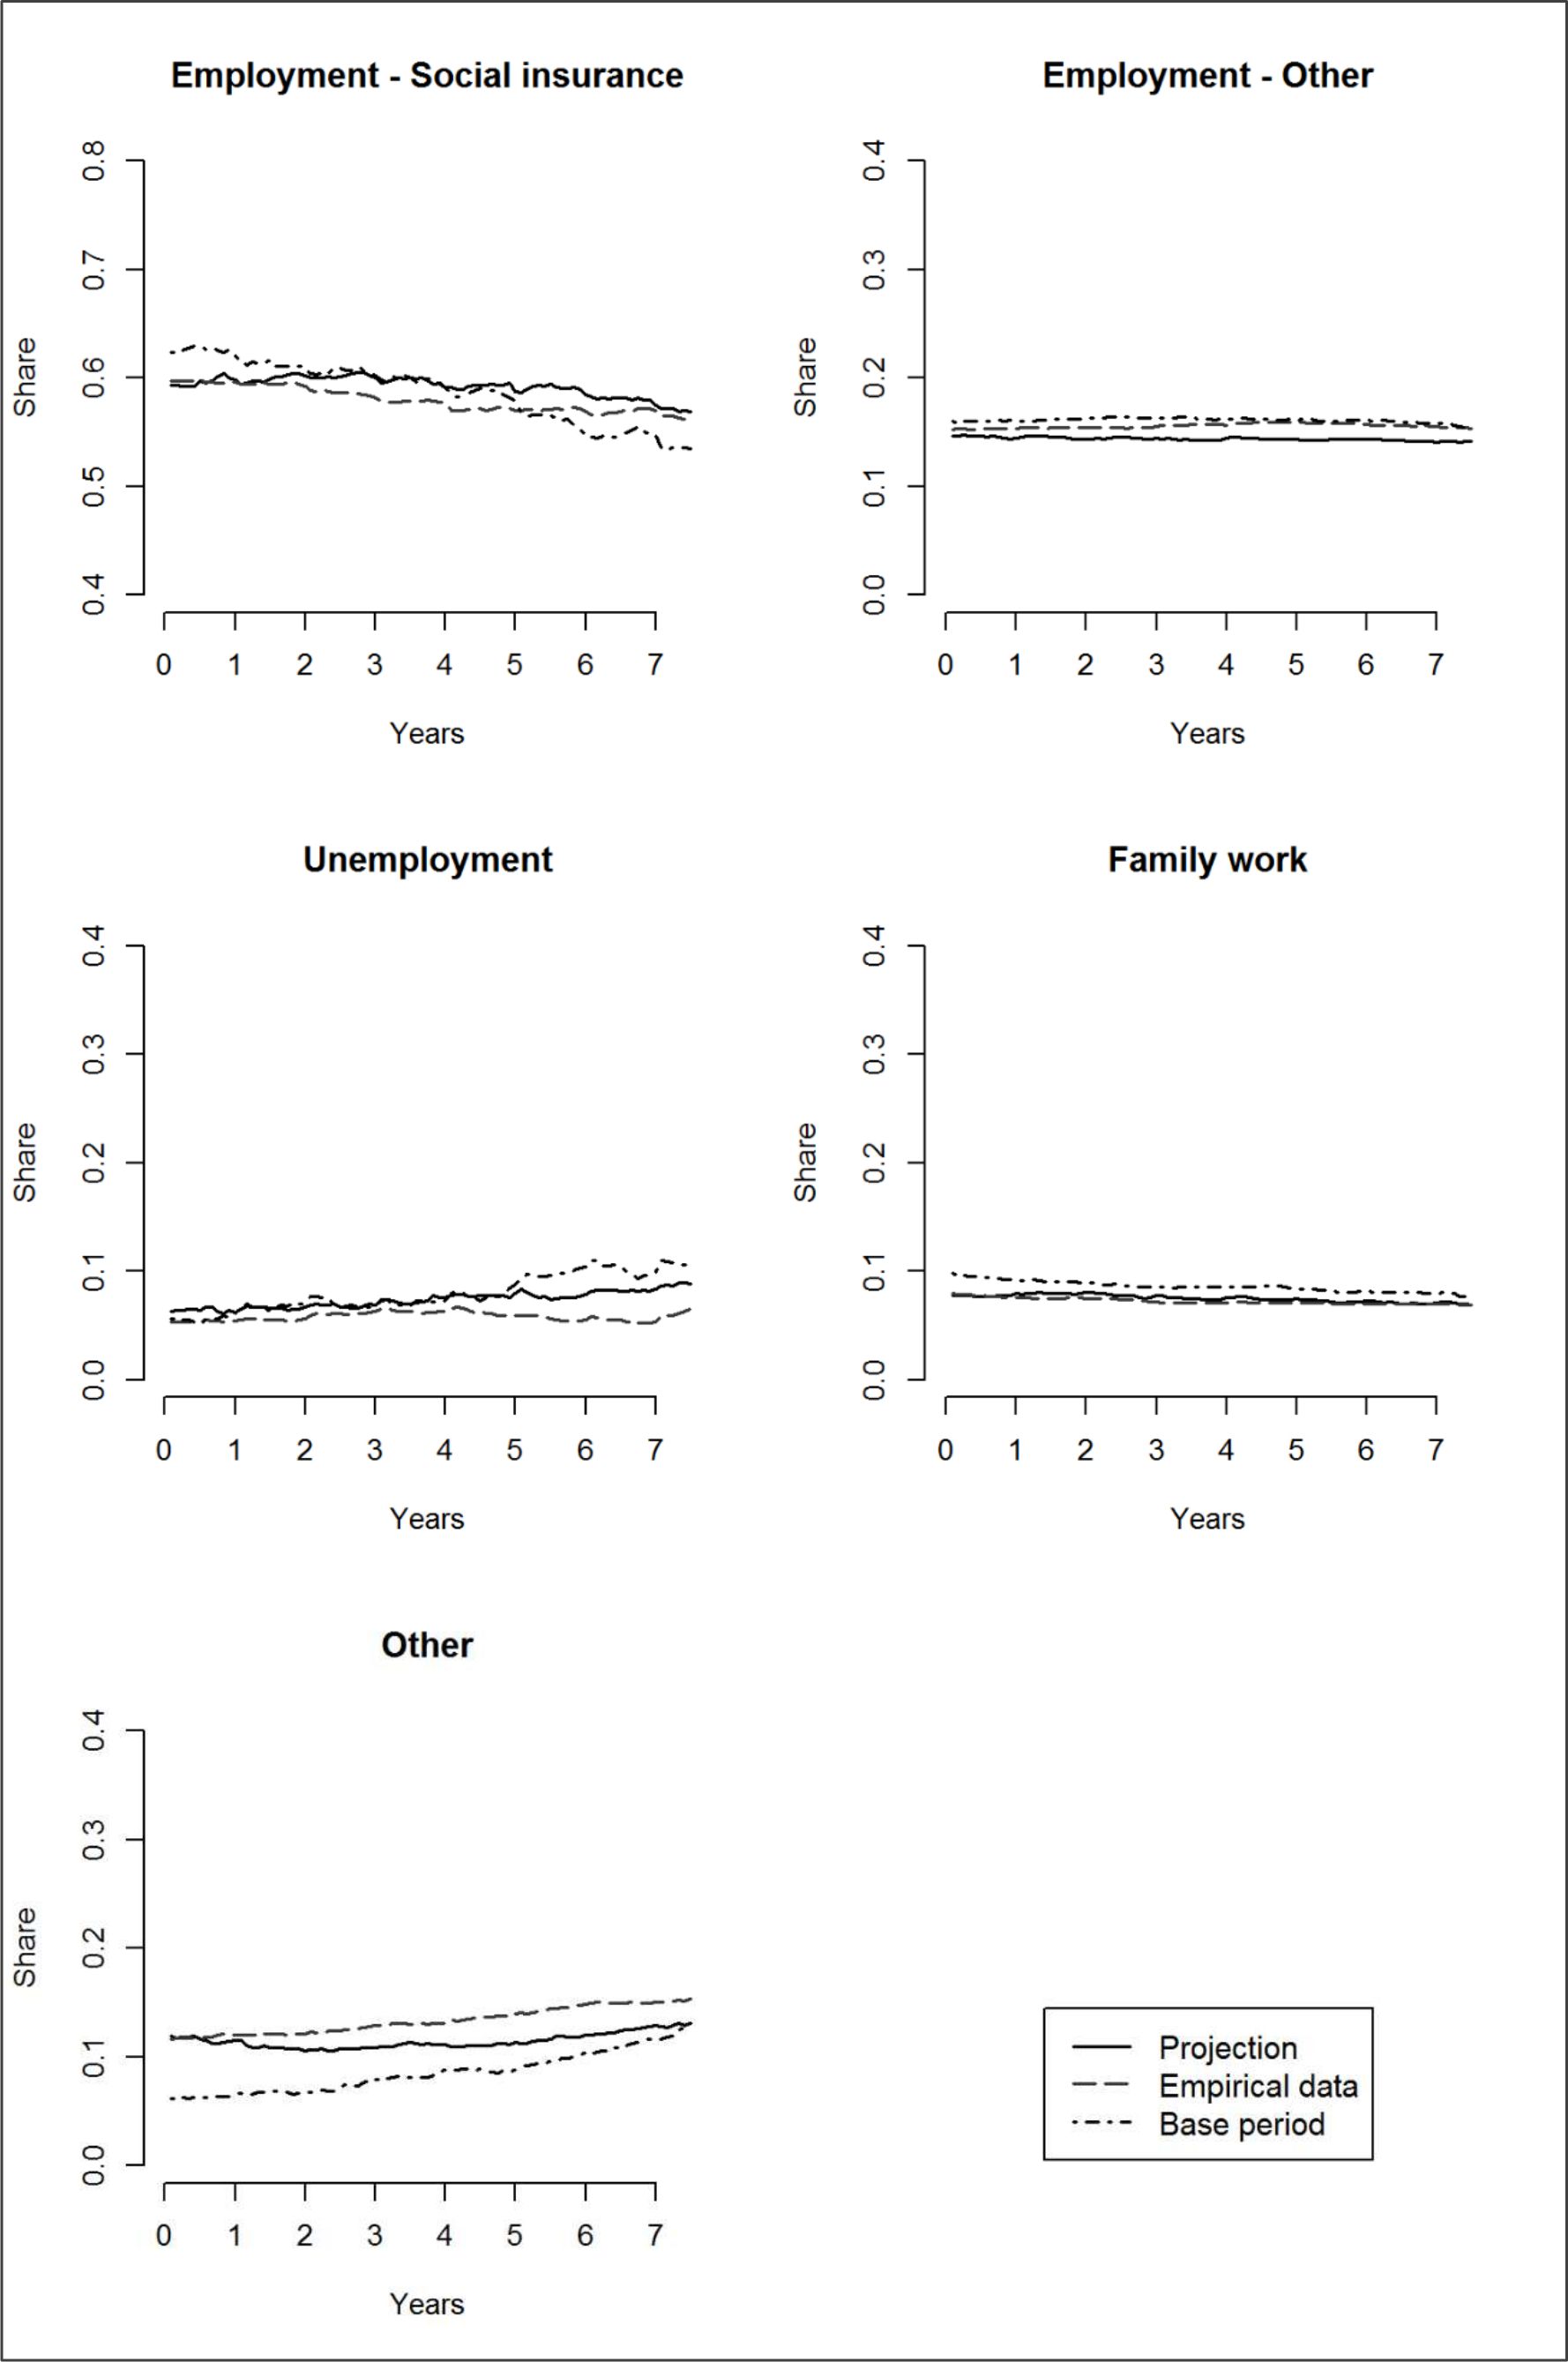
Figure 1
Development of SES states, total of the population.
Source: AVID 2005 and IAV 2009, own calculations.
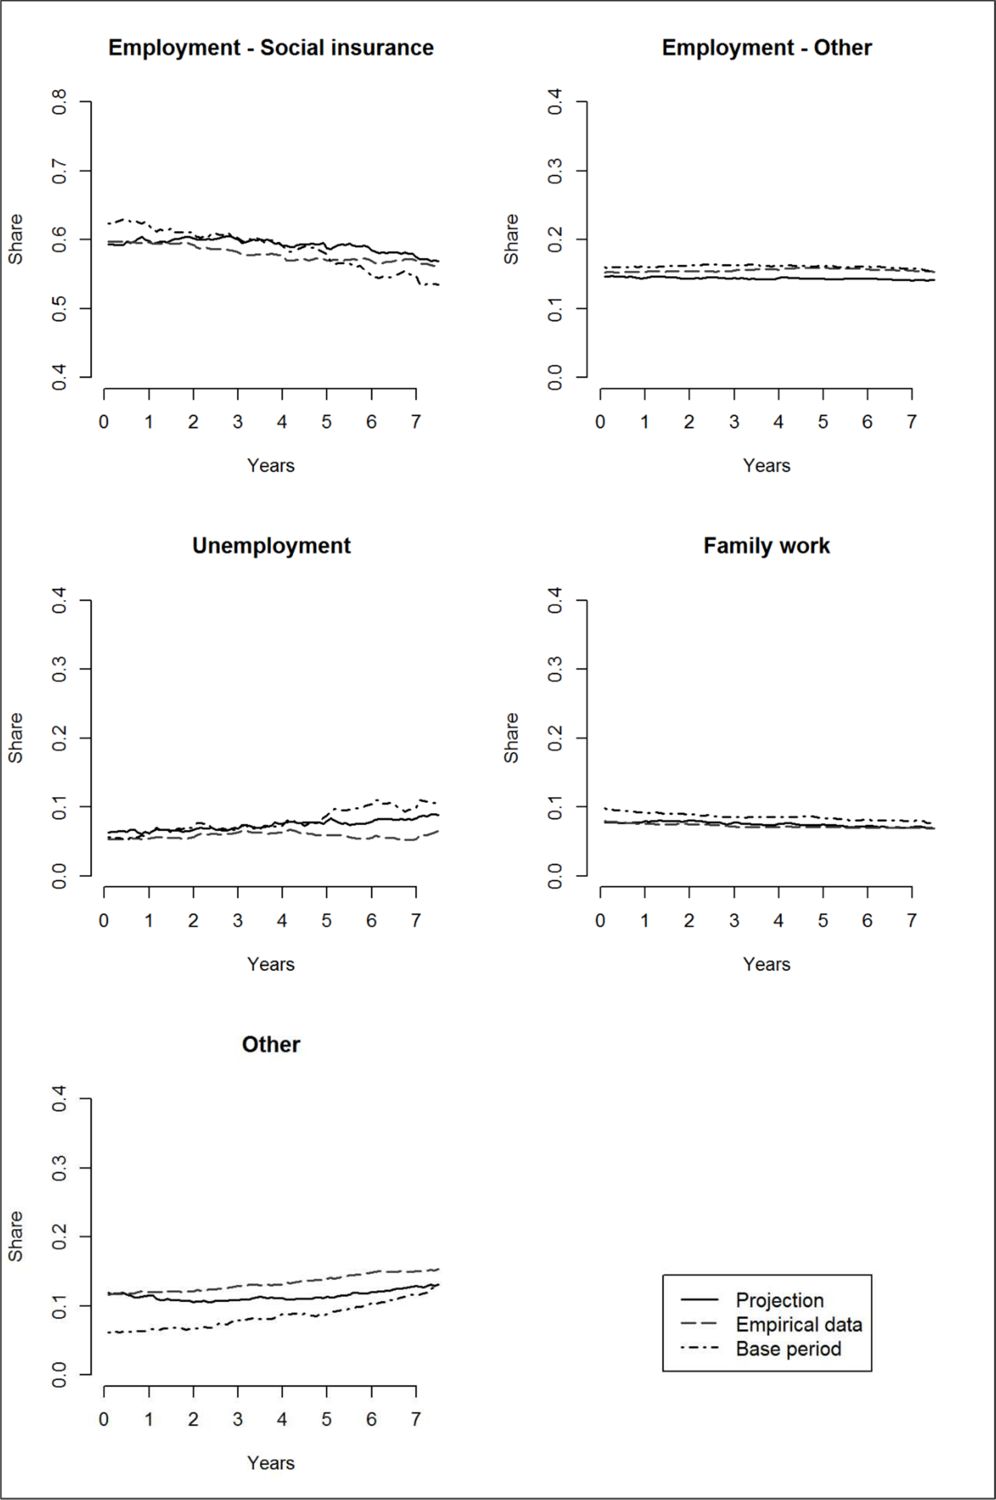
Figure 2

Development of SES states, West German men.
Source: AVID 2005 and IAV 2009, own calculations.
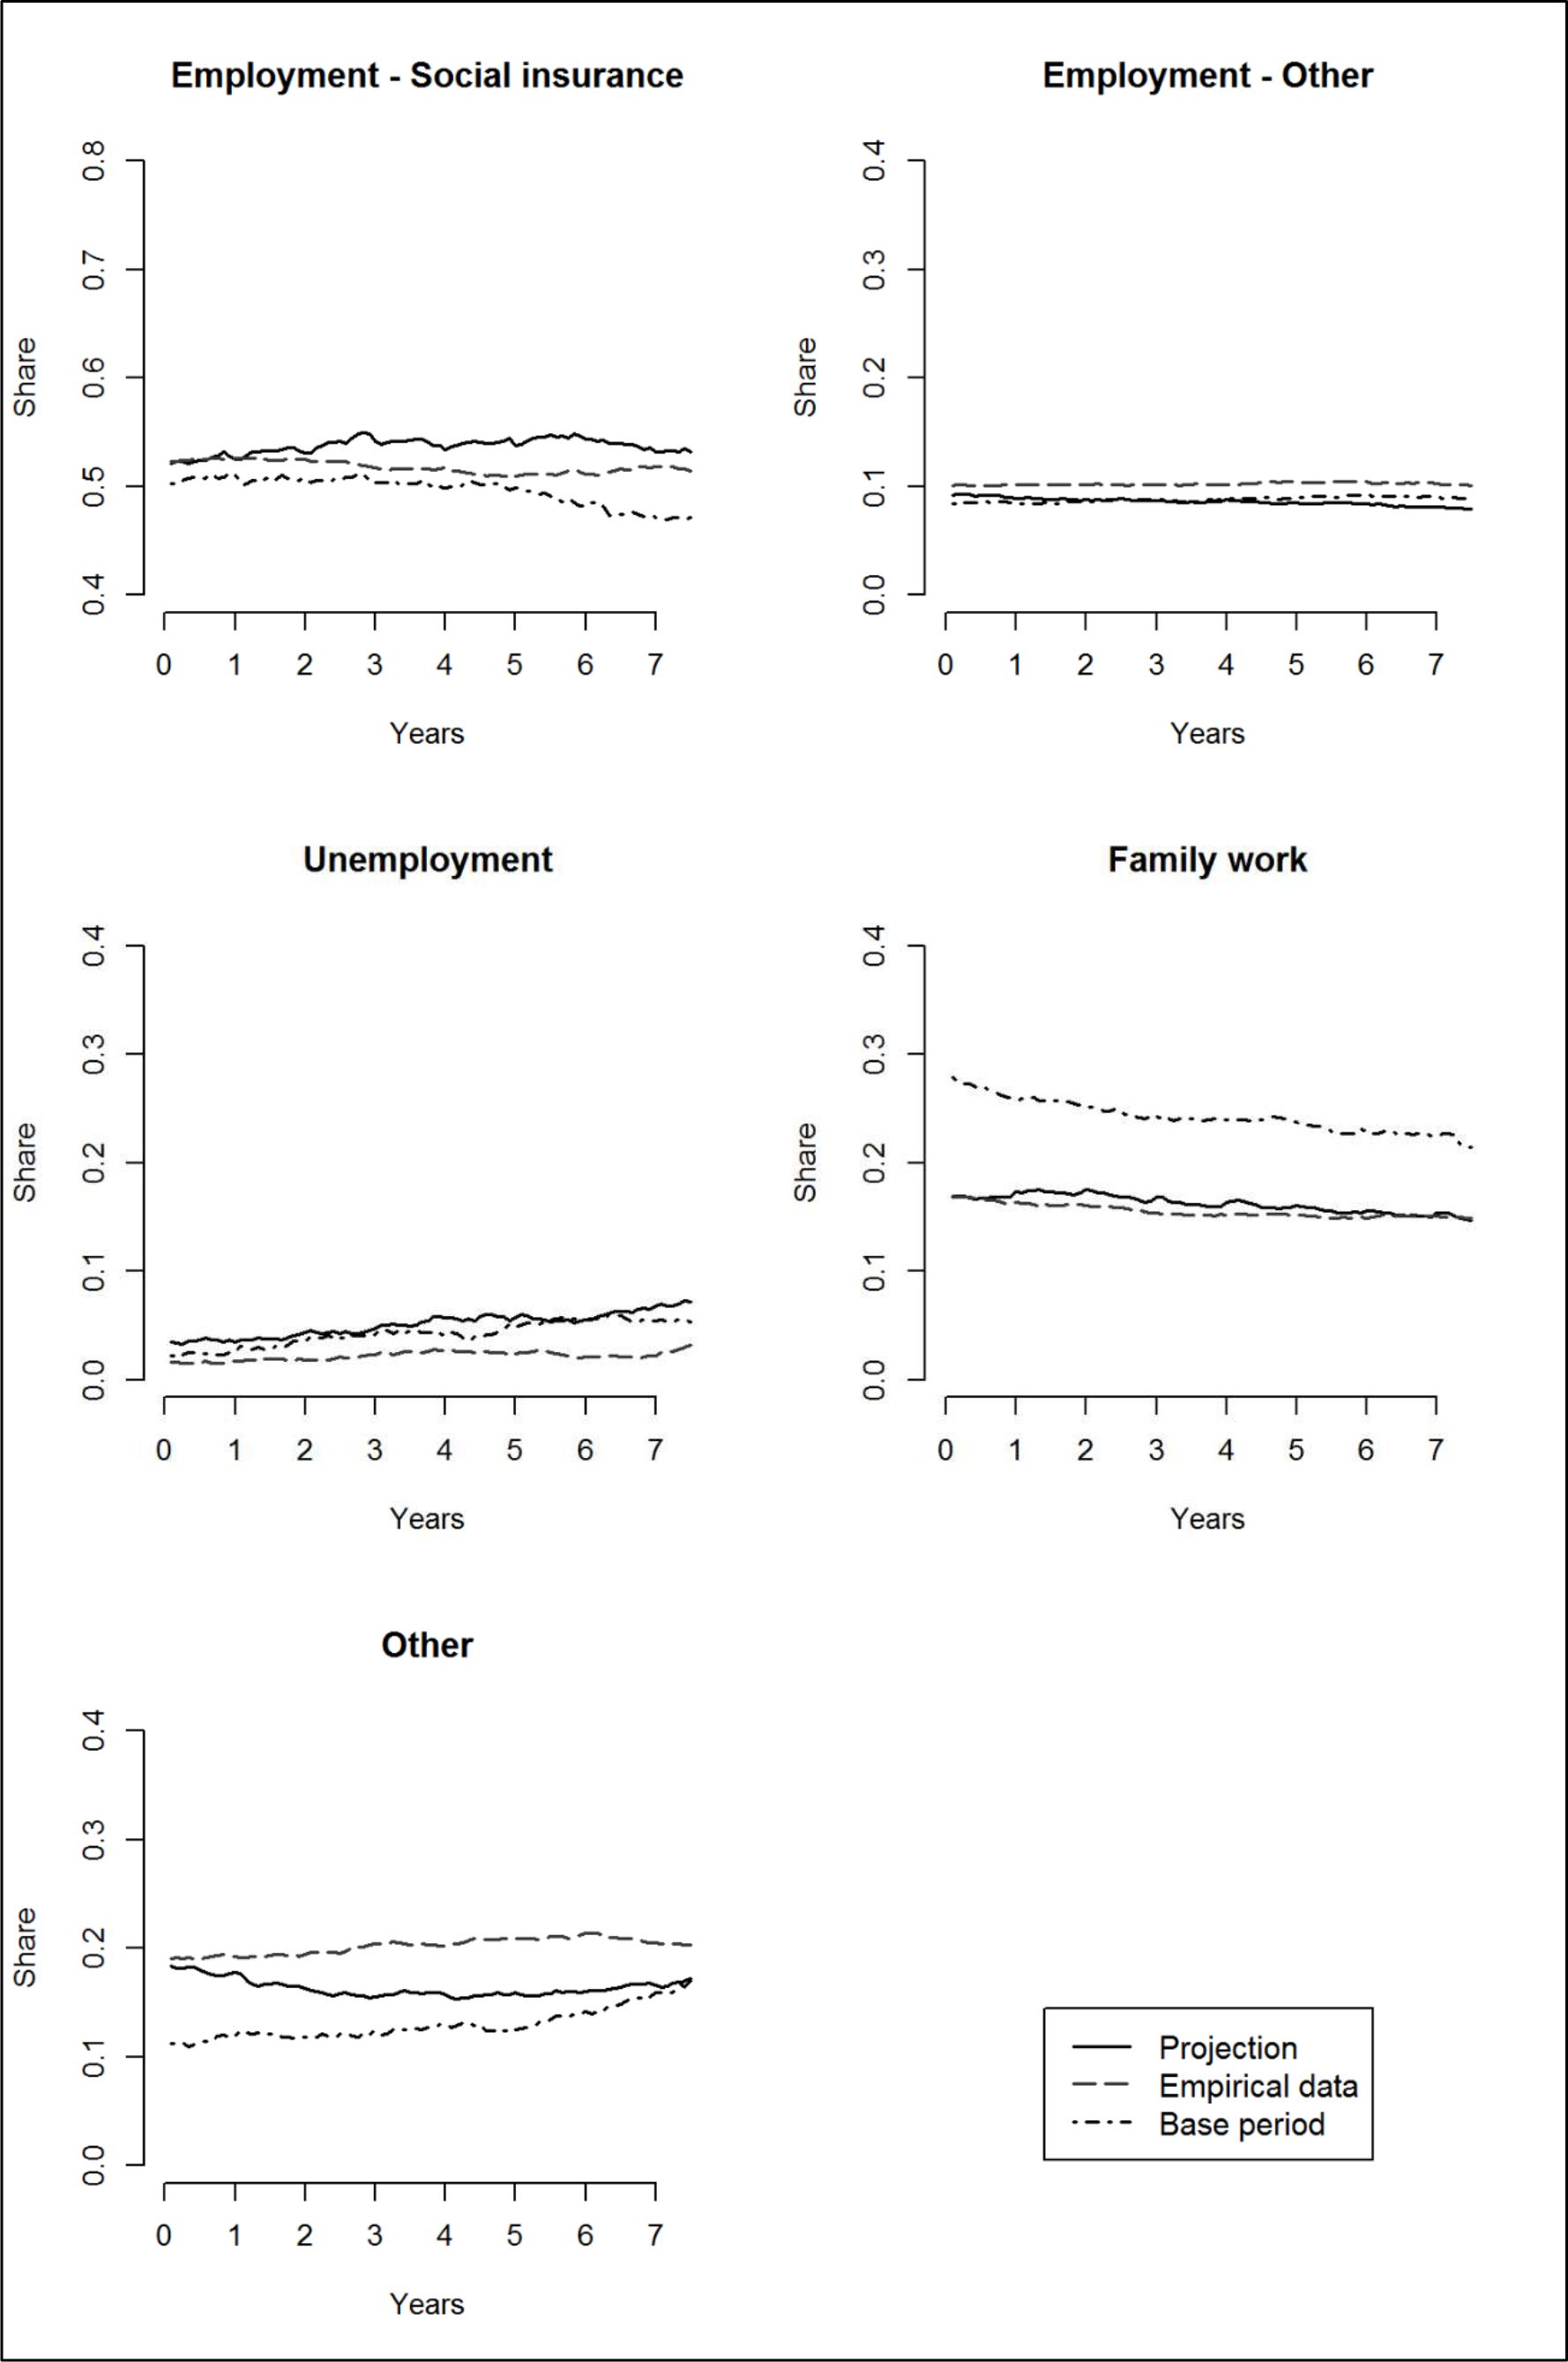
Figure 3

Development of SES states, West German women.
Source: AVID 2005 and IAV 2009, own calculations.
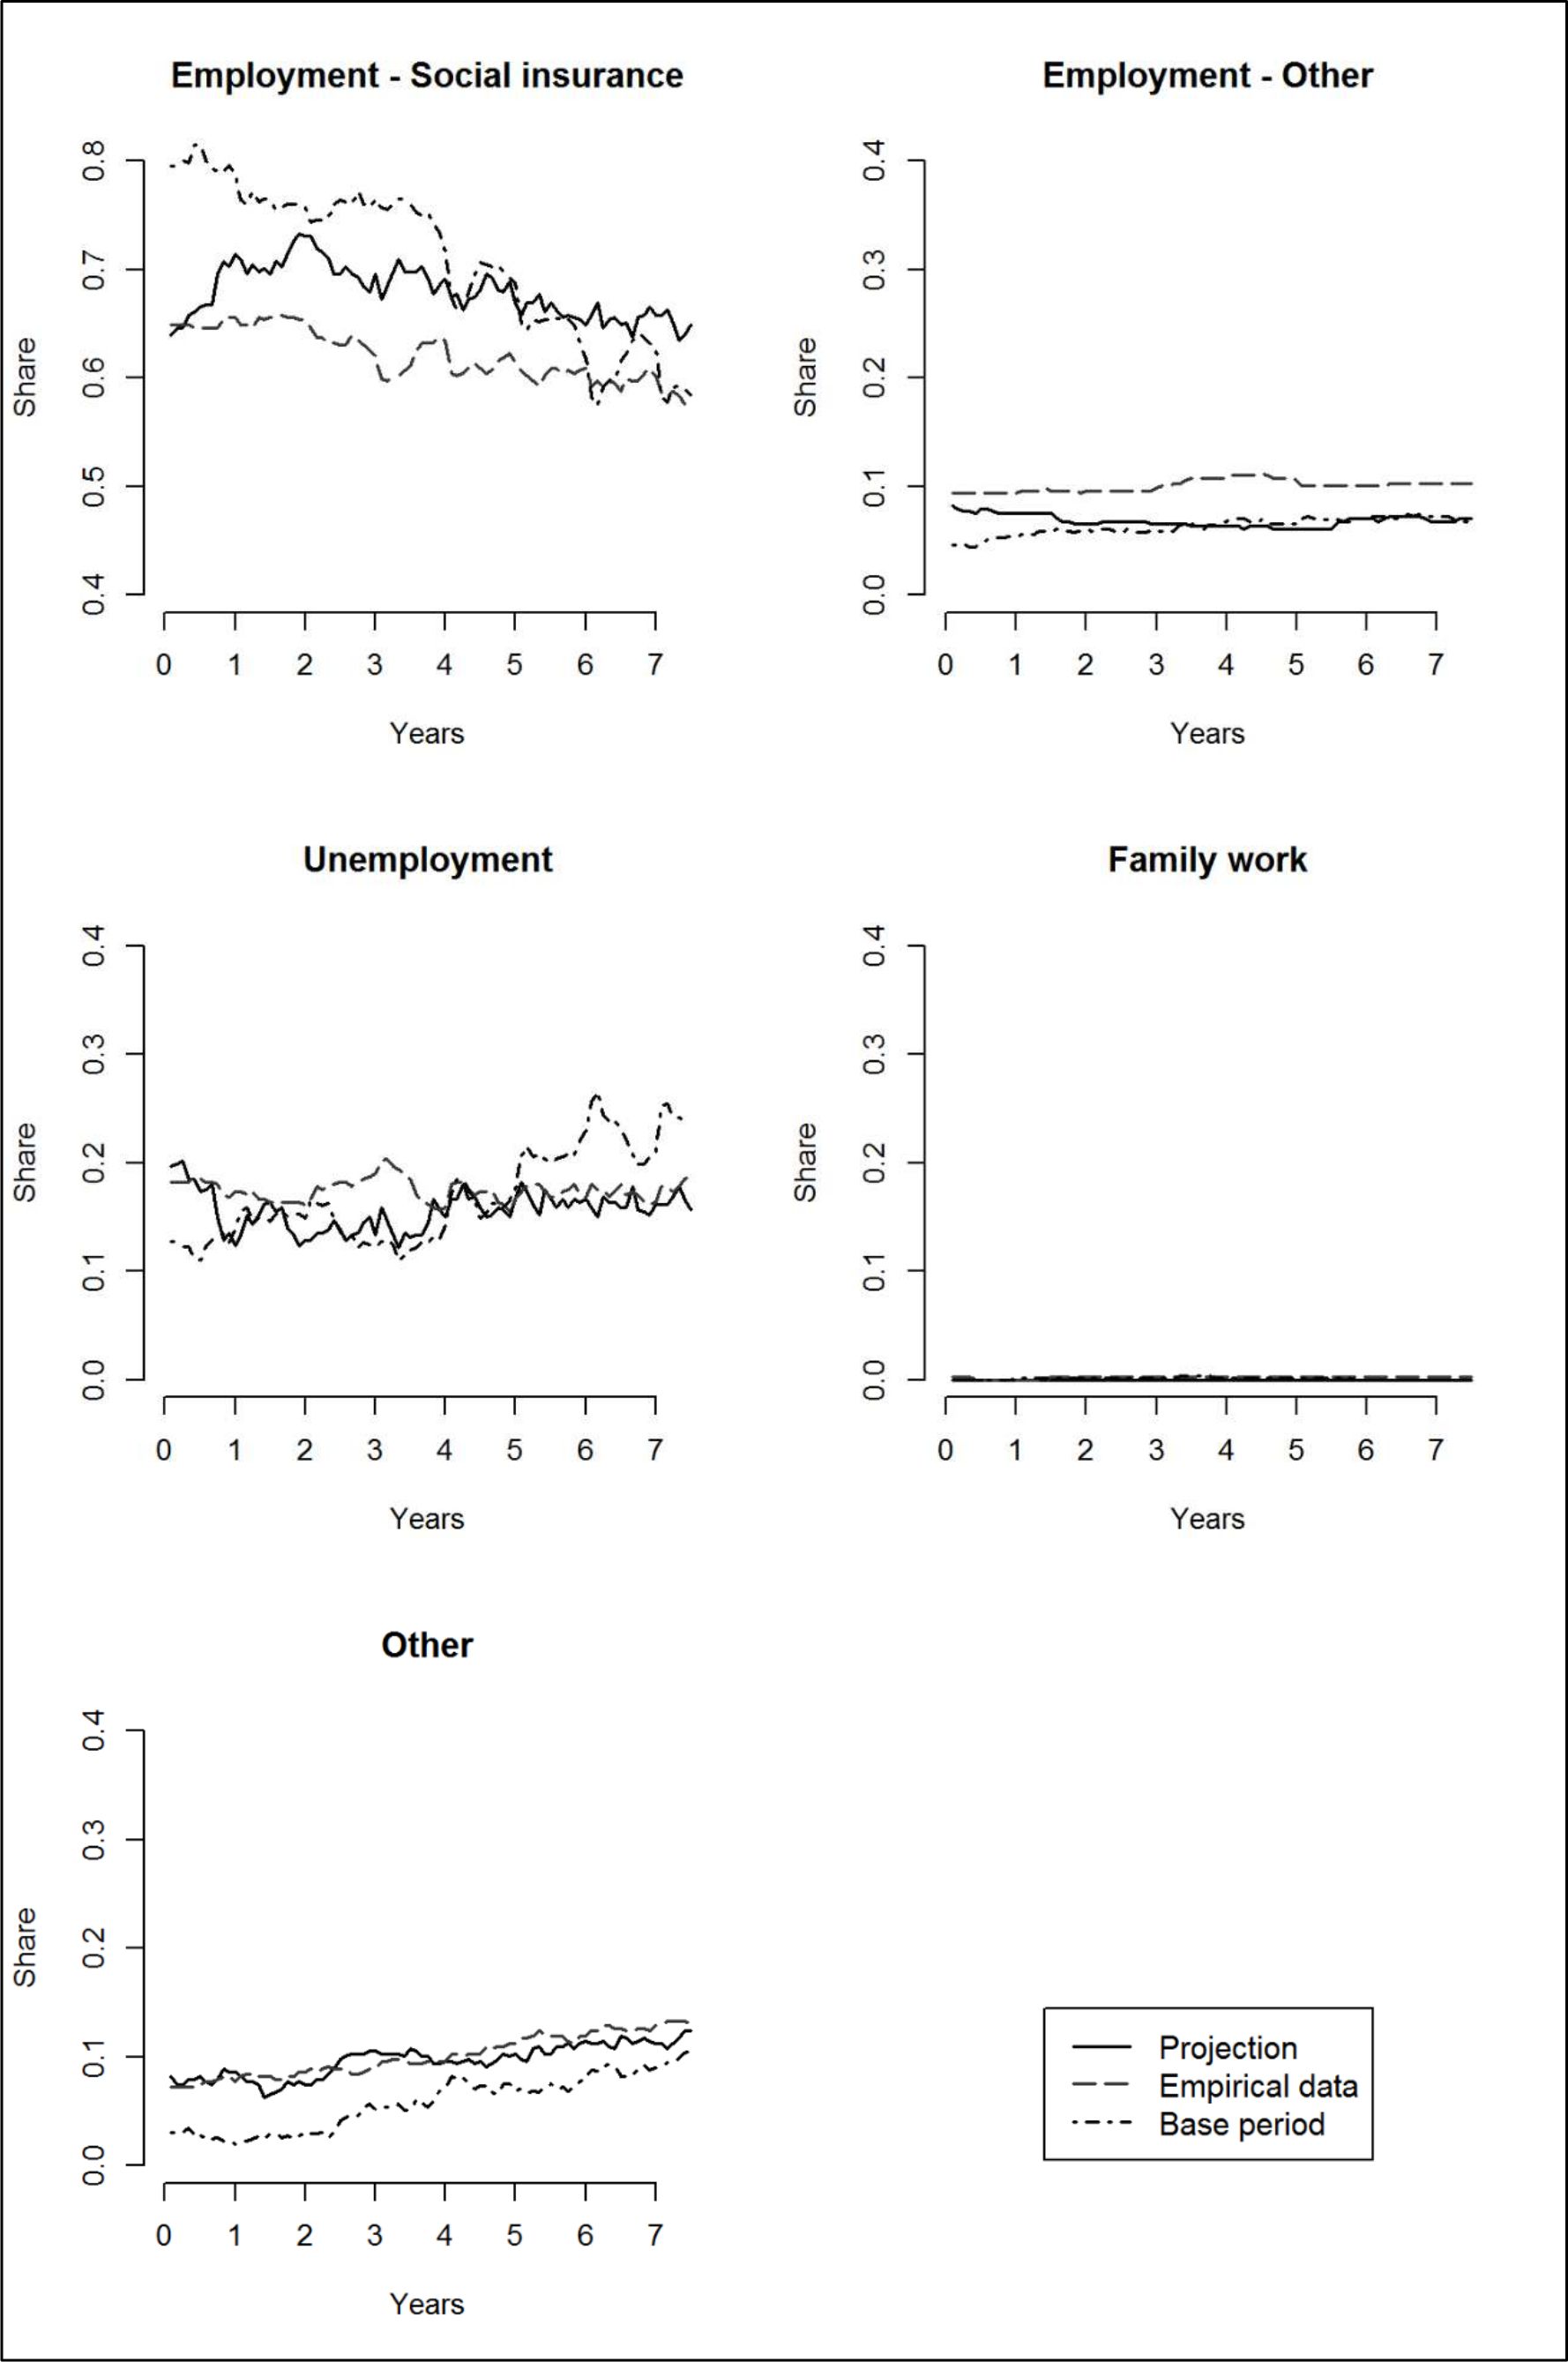
Figure 4

Development of SES states, East German men.
Source: AVID 2005 and IAV 2009, own calculations.
Figure 5

Development of SES states, East German women.
Source: AVID 2005 and IAV 2009, own calculations.
Figure 6
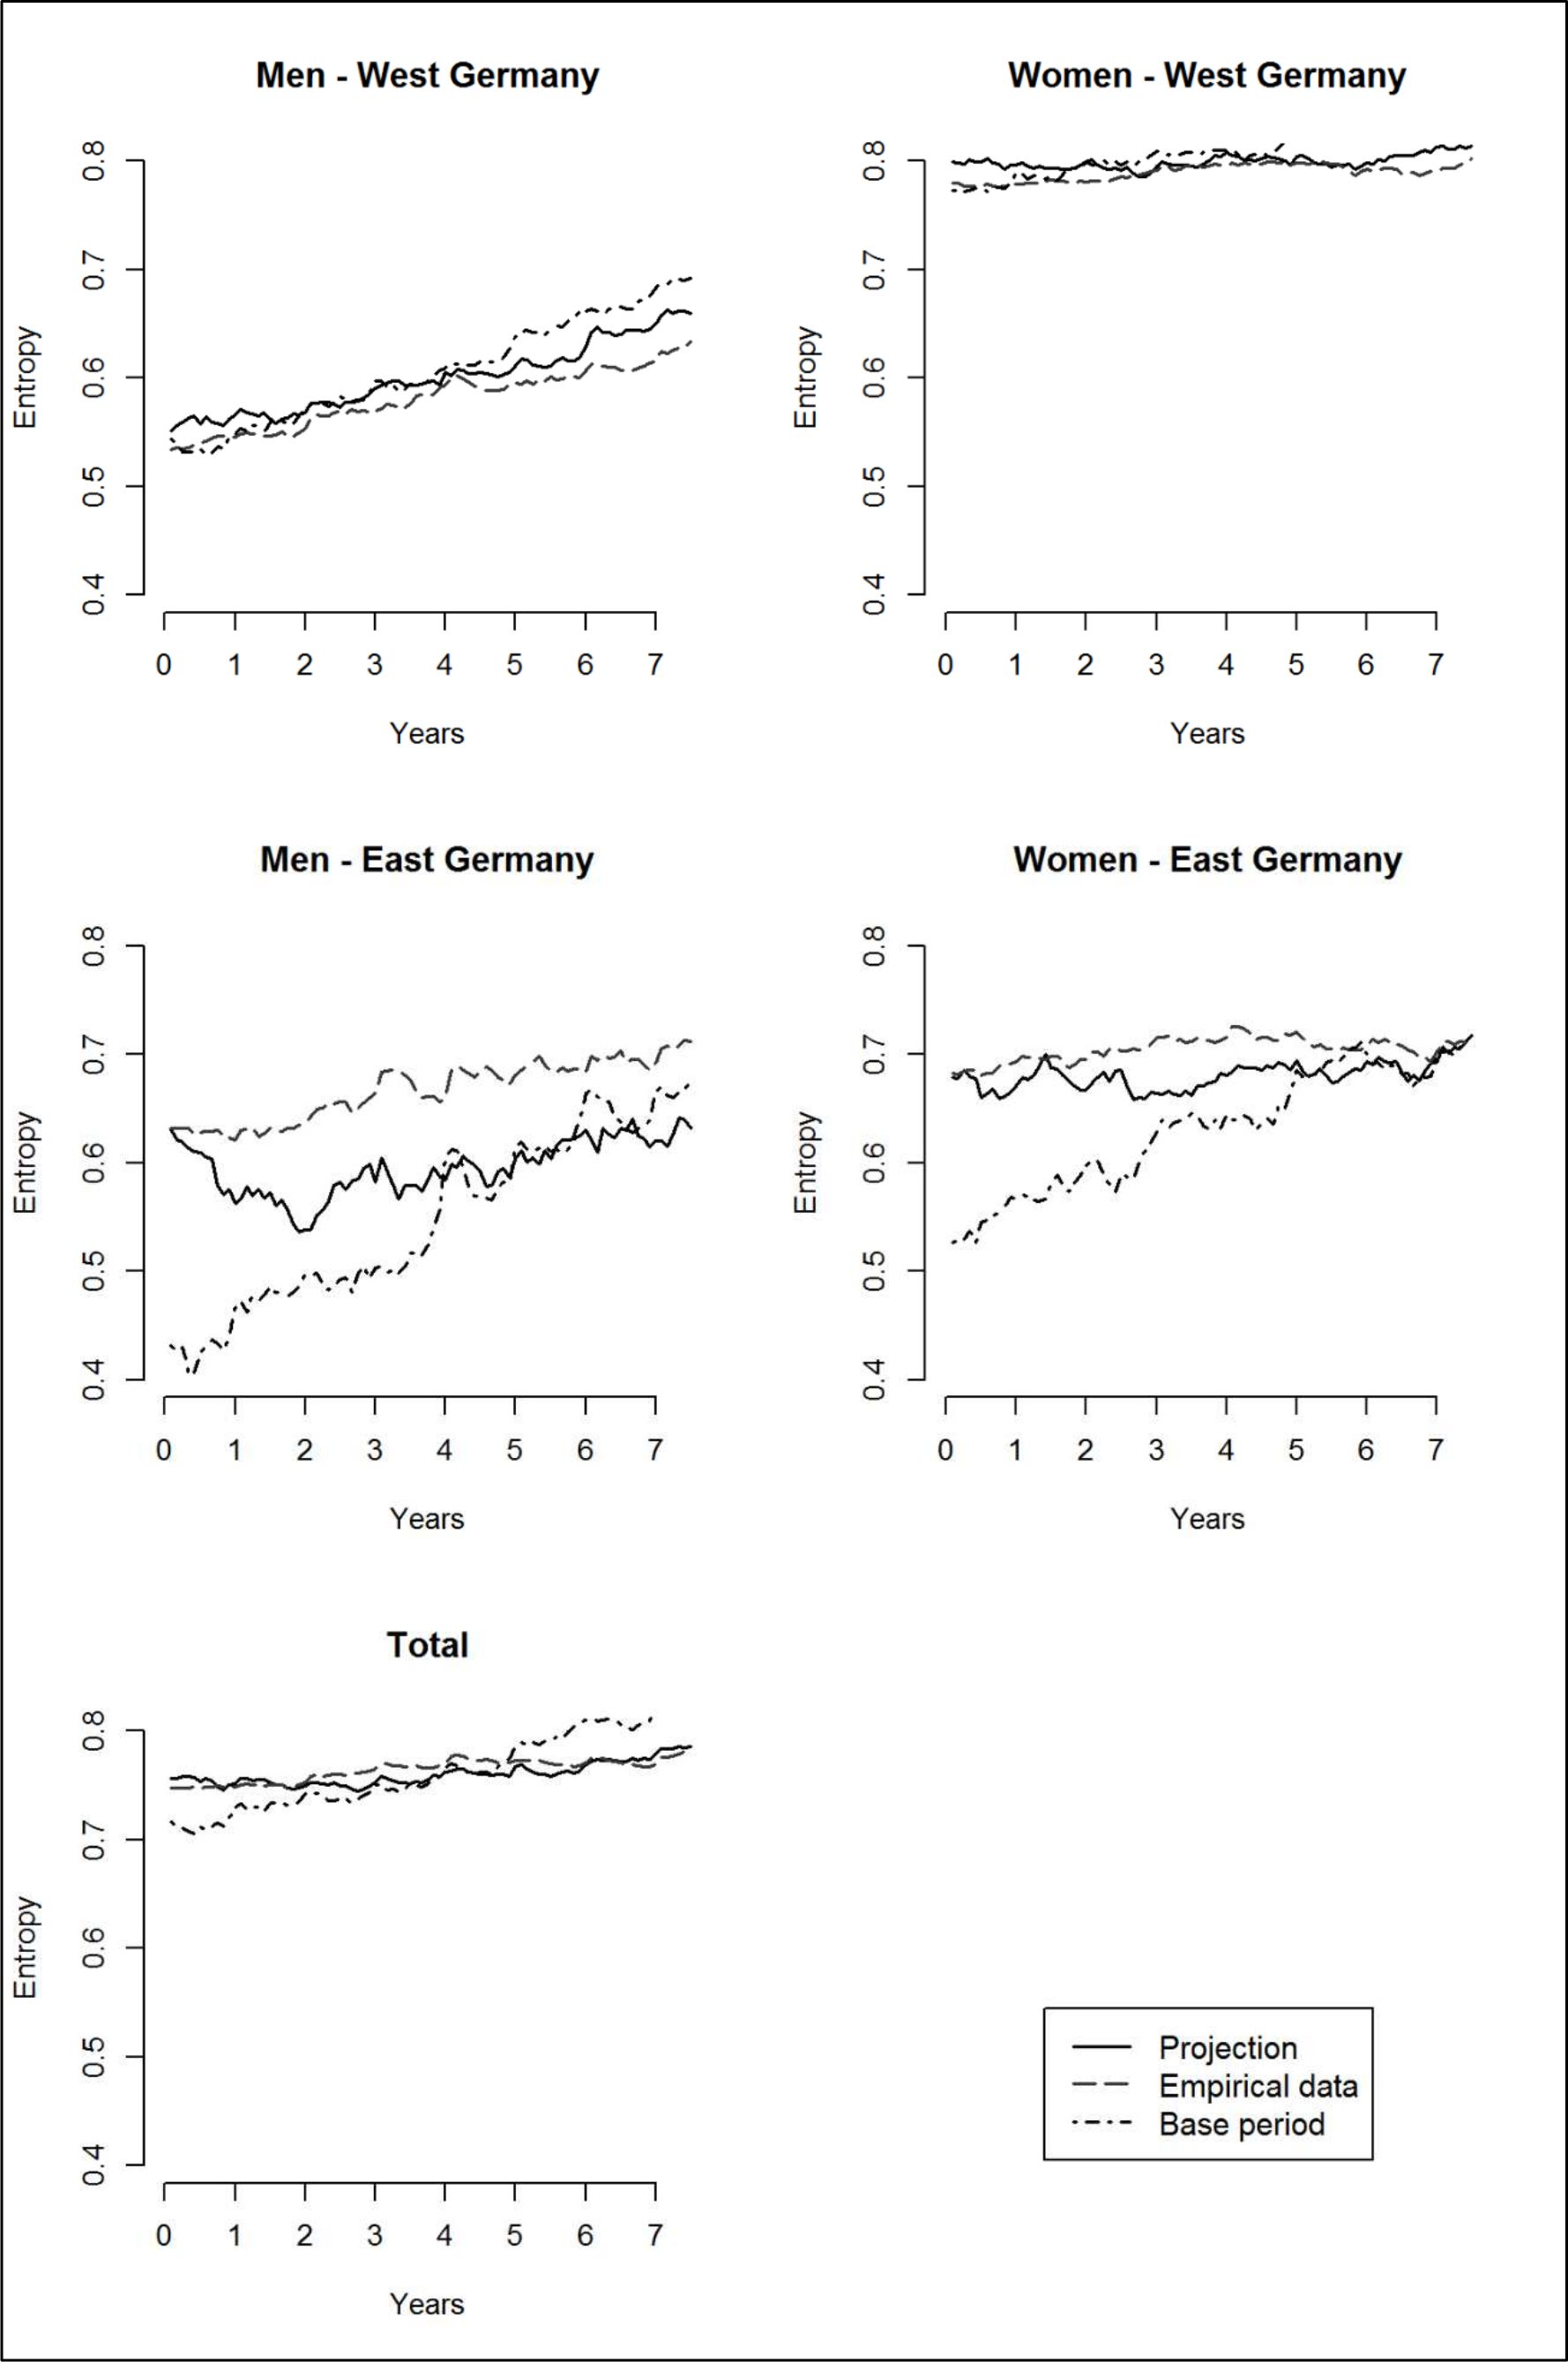
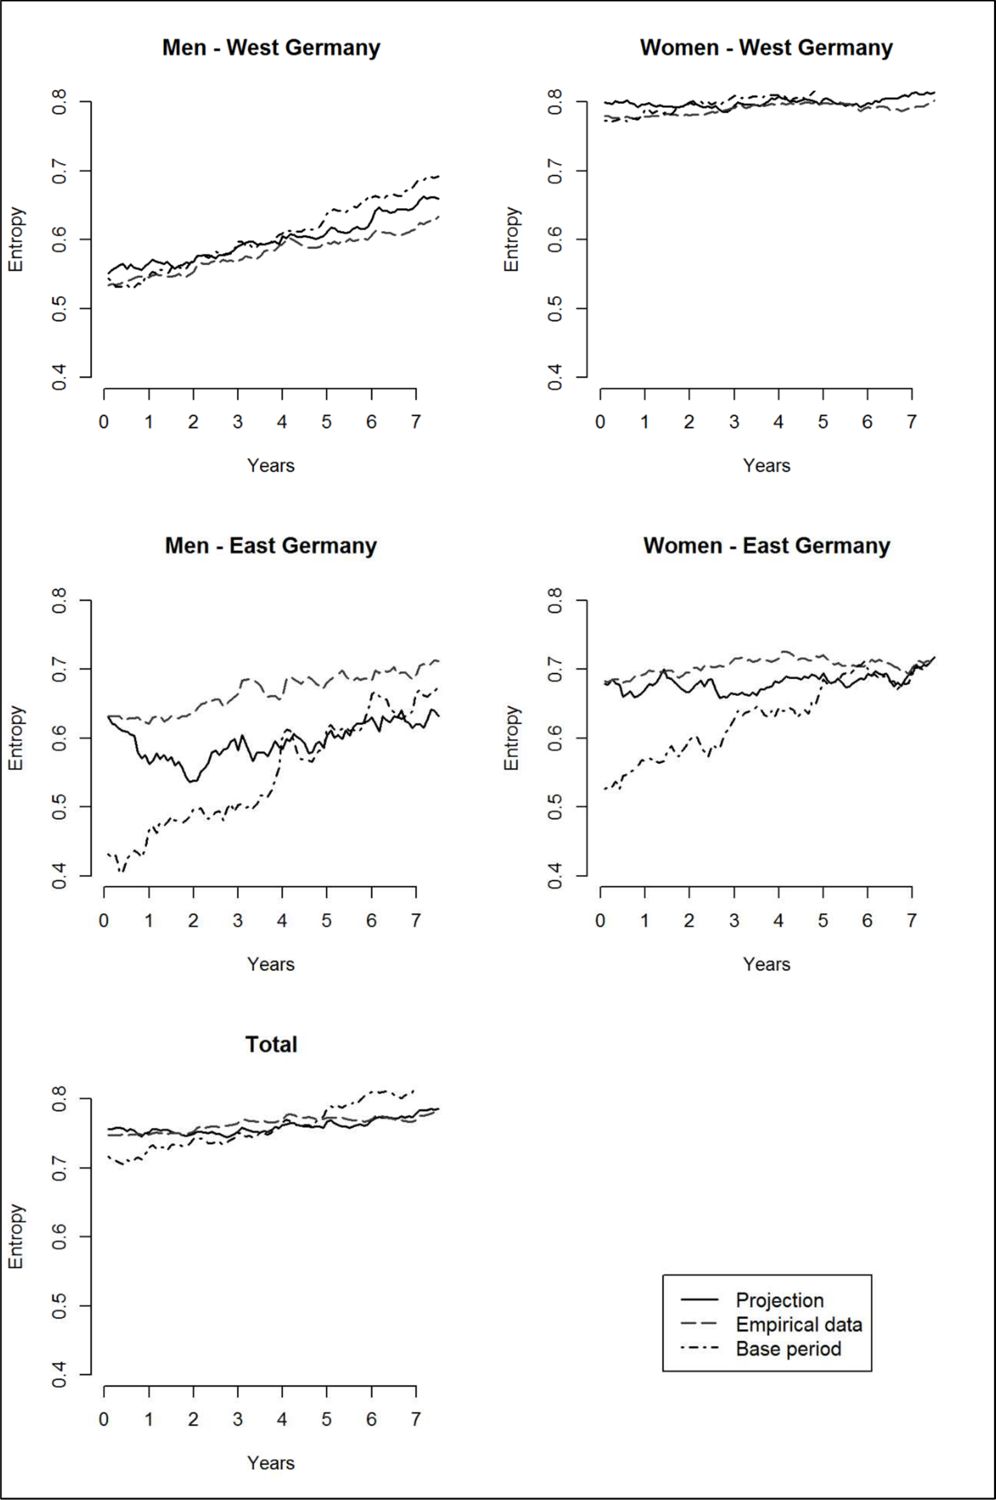
Transversal entropies.
Source: AVID 2005 and IAV 2009, own calculations.
Tables
Table 1
Indicators.
| Level | Orientation | Content | Structure | |
|---|---|---|---|---|
| Step 1 | Aggregate | Cross-sectional | States per month | Transversal entropy |
| Step 2 | Individual | Longitudinal | Cumulative duration | Complexity index |
| Step 3 | Individual | Longitudinal | Extreme values | Extreme values |
-
Source: Own description.
Table 2
Comparison groups.
| Start date | End date | Birth cohorts | n | |
|---|---|---|---|---|
| Projection | 01/2002 | 06/2009 | 1950–1961 | 4,883 |
| Empirical data | 01/2002 | 06/2009 | 1950–1961 | 4,883 |
| Base period | 01/1992 | 06/1999 | 1942–1951 | 4,951 |
-
Source: Own description.
Table 3
Population of comparison groups.
| Projection / Empirical data | Base period | |||
|---|---|---|---|---|
| Frequency | Percent | Frequency | Percent | |
| Men West Germany | 1,761 | 36.1 | 2,117 | 42.8 |
| Women West Germany | 2,170 | 44.4 | 1,692 | 34.2 |
| Men East Germany | 427 | 8.7 | 609 | 12.3 |
| Women East Germany | 525 | 10.8 | 533 | 10.8 |
| TOTAL | 4,883 | 100.0 | 4,951 | 100.0 |
-
Source: AVID 2005 and IAV 2009, own calculations.
Table 4
Cumulative duration of states (in months).
| Projection | Empirical data | Base period | |||||
|---|---|---|---|---|---|---|---|
| Mean | SD | Mean | SD | Mean | SD | ||
| Men West | Employment – Social insurance | 56.8 | 40.0 | 57.4 | 41.3 | 55.1 | 40.9 |
| Employment – Other | 23.4 | 37.8 | 23.6 | 38.7 | 25.2 | 39.3 | |
| Unemployment | 4.3 | 14.1 | 3.1 | 13.2 | 4.2 | 13.6 | |
| Family work | 0.2 | 4.2 | 0.1 | 2.4 | 0.2 | 3.6 | |
| Other states | 5.2 | 17.0 | 5.7 | 19.8 | 5.3 | 17.0 | |
| Women West | Employment – Social insurance | 48.3 | 38.1 | 46.6 | 42.6 | 44.7 | 41.2 |
| Employment – Other | 7.7 | 23.9 | 9.2 | 26.4 | 7.9 | 24.6 | |
| Unemployment | 4.6 | 12.7 | 2.0 | 9.3 | 3.9 | 12.7 | |
| Family work | 14.6 | 27.9 | 14.0 | 30.8 | 21.8 | 35.9 | |
| Other states | 14.7 | 26.6 | 18.2 | 33.3 | 11.7 | 25.9 | |
| Men East | Employment – Social insurance | 61.1 | 35.5 | 55.9 | 39.3 | 63.7 | 29.5 |
| Employment – Other | 6.1 | 20.8 | 9.1 | 25.7 | 5.7 | 19.5 | |
| Unemployment | 14.0 | 22.2 | 15.8 | 29.2 | 15.3 | 21.1 | |
| Family work | 0.0 | 0.0 | 0.2 | 3.5 | 0.1 | 1.8 | |
| Other states | 8.7 | 19.9 | 9.1 | 24.0 | 5.2 | 15.0 | |
| Women East | Employment – Social insurance | 55.8 | 32.6 | 54.5 | 39.6 | 57.4 | 31.9 |
| Employment – Other | 4.8 | 17.6 | 5.6 | 20.8 | 3.0 | 13.3 | |
| Unemployment | 17.1 | 24.6 | 17.6 | 30.7 | 20.4 | 25.1 | |
| Family work | 1.8 | 9.0 | 2.4 | 13.4 | 1.8 | 11.2 | |
| Other states | 10.6 | 21.7 | 10.0 | 24.4 | 7.3 | 19.7 | |
-
Source: AVID 2005 and IAV 2009, own calculations.
Table 5
Complexity index.
| Projection | Empirical data | Base period | ||
|---|---|---|---|---|
| Men West | Mean | 0.02 | 0.01 | 0.03 |
| SD | 0.04 | 0.03 | 0.05 | |
| Maximum | 0.27 | 0.26 | 0.35 | |
| % Minimum 0 | 66.6 | 84.3 | 70.7 | |
| Women West | Mean | 0.05 | 0.02 | 0.03 |
| SD | 0.05 | 0.04 | 0.06 | |
| Maximum | 0.27 | 0.26 | 0.37 | |
| % Minimum 0 | 43.2 | 77.5 | 62.3 | |
| Men East | Mean | 0.09 | 0.03 | 0.08 |
| SD | 0.12 | 0.06 | 0.08 | |
| Maximum | 0.46 | 0.25 | 0.32 | |
| % Minimum 0 | 51.3 | 67.4 | 33.8 | |
| Women East | Mean | 0.07 | 0.03 | 0.08 |
| SD | 0.07 | 0.05 | 0.08 | |
| Maximum | 0.30 | 0.24 | 0.30 | |
| % Minimum 0 | 29.7 | 66.3 | 33.6 |
-
Source: AVID 2005 and IAV 2009, own calculations.
Table 6
Distribution of cumulative duration of states (in %).
| Months | Projection | Empirical data | Base period | |||||||
|---|---|---|---|---|---|---|---|---|---|---|
| 0 | 1–89 | 90 | 0 | 1–89 | 90 | 0 | 1–89 | 90 | ||
| Men West | Employment – Social insurance | 26.6 | 30.2 | 43.2 | 31.4 | 13.0 | 55.6 | 31.1 | 24.9 | 44.0 |
| Employment – Other | 69.6 | 9.7 | 20.7 | 71.0 | 5.3 | 23.7 | 68.8 | 7.1 | 24.1 | |
| Unemployment | 82.3 | 17.4 | (0.3) | 90.2 | 8.7 | 1.1 | 83.6 | 15.9 | 0.5 | |
| Family work | 99.4 | (0.4) | (0.2) | 99.6 | (0.4) | - | 99.7 | (0.2) | (0.1) | |
| Other states | 79.0 | 18.8 | 2.2 | 88.5 | 7.5 | 4.0 | 78.3 | 19.5 | 2.2 | |
| Women West | Employment – Social insurance | 27.4 | 47.4 | 25.2 | 41.1 | 16.2 | 42.8 | 39.1 | 29.0 | 31.9 |
| Employment – Other | 88.9 | 4.8 | 6.3 | 88.0 | 3.4 | 8.6 | 89.7 | 3.3 | 7.0 | |
| Unemployment | 76.6 | 23.2 | (0.2) | 91.6 | 8.0 | (0.4) | 84.4 | 15.3 | (0.3) | |
| Family work | 66.7 | 27.2 | 6.1 | 79.6 | 8.2 | 12.2 | 66.8 | 16.4 | 16.8 | |
| Other states | 61.3 | 33.3 | 5.4 | 71.3 | 15.2 | 13.5 | 69.6 | 24.2 | 6.2 | |
| Men East | Employment – Social insurance | 8.9 | 47.1 | 44.0 | 25.8 | 29.3 | 45.0 | 5.4 | 65.0 | 29.6 |
| Employment – Other | 88.5 | 7.0 | 4.4 | 87.4 | 4.4 | 8.2 | 88.8 | 7.9 | 3.3 | |
| Unemployment | 55.5 | 44.5 | - | 64.9 | 26.5 | 8.7 | 43.0 | 57.0 | - | |
| Family work | 100.0 | - | - | 99.5 | (0.5) | - | 99.7 | (0.3) | - | |
| Other states | 67.0 | 30.2 | 2.8 | 80.6 | 13.8 | 5.6 | 67.7 | 31.2 | (1.1) | |
| Women East | Employment – Social insurance | 9.5 | 68.6 | 21.9 | 26.5 | 28.6 | 45.0 | 8.4 | 63.4 | 28.1 |
| Employment – Other | 88.8 | 8.4 | 2.9 | 91.8 | 3.0 | 5.1 | 92.7 | 6.6 | (0.8) | |
| Unemployment | 47.0 | 51.8 | (1.1) | 65.0 | 26.1 | 9.0 | 40.7 | 58.2 | (1.1) | |
| Family work | 93.9 | 5.9 | (0.2) | 96.2 | 2.3 | (1.5) | 95.7 | 3.4 | (0.9) | |
| Other states | 53.1 | 43.2 | 3.6 | 77.7 | 16.6 | 5.7 | 69.0 | 28.3 | 2.6 | |
-
Source: AVID 2005 and IAV 2009, own calculations, ( ) n < 10, – n = 0.
Download links
A two-part list of links to download the article, or parts of the article, in various formats.