Measuring small area inequality using spatial microsimulation: Lessons learned from Australia
- University of Canberra, Australia
- Curtin University, Australia
- Article
- Figures and data
- Jump to
Figures

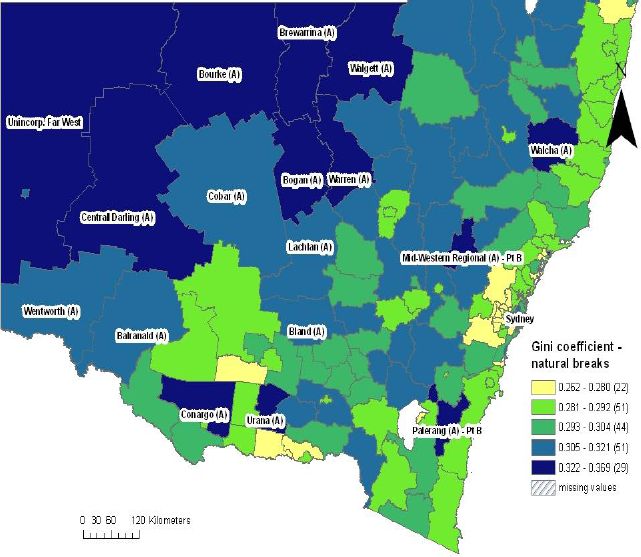
Gini coefficients by statistical local area, new south wales.
Source: SpatialMSM/09C applied to 2003–04 and 2005–06 SIH, ABS Census Population and Housing 2006.
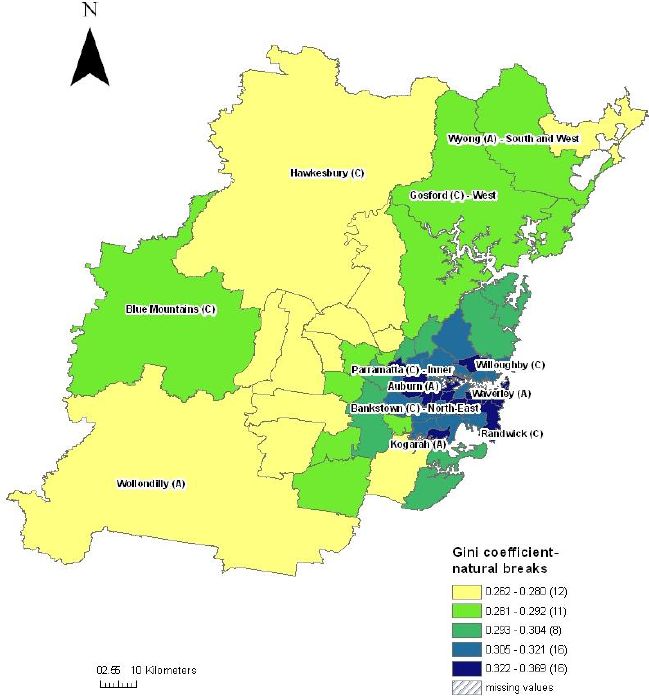
Gini coefficients by statistical local area, Sydney.
Source: SpatialMSM/09C applied to 2003–04 and 2005–06 SIH, ABS Census Population and Housing 2006.

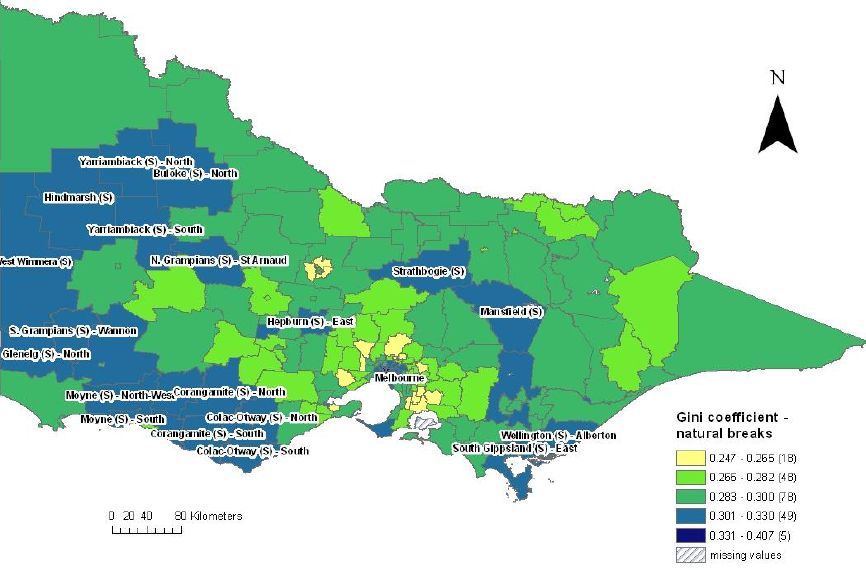
Gini coefficients by statistical local area, Victoria.
Source: SpatialMSM09C applied to 2003–04 and 2005–06 SIH, ABS census population and housing 2006.

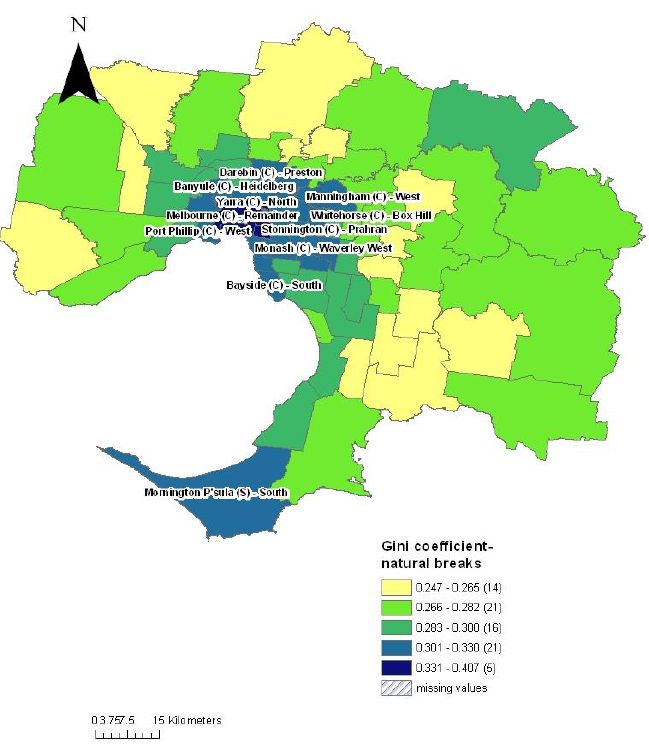
Gini coefficients by statistical local area, melbourne.
Source: SpatialMSM09C applied to 2003–04 and 2005–06 SIH, ABS Census Population and Housing 2006
Tables
Benchmark tables used for SpatialMSM
| N° | Benchmark table | Level |
|---|---|---|
| 1 | All household type | Household |
| 2 | Age by sex by labour force status | Person |
| 3 | Tenure by weekly household rent | Household |
| 4 | Tenure by household type | Household |
| 5 | Tenure by weekly household income | Household |
| 6 | Persons in non-private dwellings | Person |
| 7 | Monthly household mortgage by weekly household income | Household |
| 8 | Dwelling structure by household family composition | Household |
| 9 | Number of children aged under 15 usually resident in household | Household |
| 10 | Number of adults usually resident in household | Household |
| 11 | Weekly household rent by weekly household income | Household |
| 12 | Gross equivalised weekly household income by age | Person |
Number and characteristics of failed SLAs
| State/Territory | Total SLAs | Failed SLAs | Proportion of failed SLAs | Proportion of persons living in failed SLAs out of all persons within state/territory |
|---|---|---|---|---|
| New South Wales | 200 | 2 | 1.0% | 0.34% |
| Victoria | 210 | 7 | 3.3% | 0.52% |
| Queensland | 479 | 45 | 9.4% | 0.75% |
| South Australia | 128 | 7 | 5.5% | 0.32% |
| Western Australia | 156 | 17 | 10.9% | 0.87% |
| Tasmania | 44 | 2 | 4.5% | 0.15% |
| Northern Territory | 96 | 53 | 55.2% | 28.37% |
| Australian Capital Territory | 109 | 16 | 14.7% | 0.61% |
| AUSTRALIA | 1422 | 149 | 10.5% | 0.79% |
-
Source: SpatialMSM/09C applied to SIH2003–04 and SIH2005–06, ABS Census Population and Housing 2006.
Comparison of Gini coefficient estimates from the 2005–06
Survey of Income and Housing and SpatialMSM
| State | Capital City/Balance of state | SpatialMSM/09C | 2005–06 SIH |
|---|---|---|---|
| New South Wales | All | 0.322 (+) | 0.317 |
| Sidney | 0.324(+) | 0.321 * | |
| Balance of state | 0.300(+) | 0.287 * | |
| Victoria | All | 0.306 | 0.306 |
| Melbourne | 0.308(−) | 0.309 * | |
| Balance of state | 0.290(+) | 0.274 * | |
| AUSTRALIA | 0.308(+) | 0.307 |
-
+(−)
indicates where the estimates from spatial microsimulation are higher or lower than the estimates directly from 2005–06 SIH;
-
*
Indicates that the coefficients have been calculated by authors. The Gini data at the capital city and balance of state level are not available from the ABS publication.
Average proportion of persons in each Gini coefficient group by selected characteristics, all New South Wales, 2006.
In %
| Gini coefficient – natural breaks* | Immigrants | Indigenous | Managers and professionals | Female LFPR | Bachelor + | Public Housing |
|---|---|---|---|---|---|---|
| 1 lowest inequality | 16.37 | 2.61 | 28.56 | 56.25 | 21.43 | 3.42 |
| 2 | 12.21 | 3.27 | 30.59 | 51.28 | 20.27 | 3.94 |
| 3 | 12.73 | 3.06 | 33.97 | 51.12 | 22.13 | 3.54 |
| 4 | 15.53 | 4.62 | 39.70 | 52.04 | 25.55 | 3.33 |
| 5 highest inequality | 23.79 | 7.19 | 46.17 | 54.59 | 33.46 | 4.51 |
-
Source: ABS Census Population and Housing 2006.
Average proportion of persons in each Gini coefficient group by selected characteristics, all Victoria, 2006.
In %
| Gini coefficient – natural breaks* | Immigrants | Indigenous | Managers and professionals | Female LFPR | Bachelor + | Public Housing |
|---|---|---|---|---|---|---|
| 1 lowest inequality | 17.98 | 0.56 | 25.48 | 59.97 | 22.09 | 1.57 |
| 2 | 14.29 | 0.71 | 30.11 | 55.43 | 23.71 | 2.47 |
| 3 | 14.13 | 1.07 | 33.41 | 51.41 | 21.96 | 2.55 |
| 4 | 16.99 | 0.53 | 44.22 | 53.17 | 32.62 | 2.08 |
| 5 highest inequality | 30.18 | 0.31 | 56.23 | 60.79 | 54.69 | 9.69 |
-
Source: ABS Census Population and Housing 2006.