The quantitative and qualitative evaluation of a multi-agent microsimulation model for subway carriage design
- Tsinghua University, China
- The University of Melbourne, Australia
- Shanghai University of Finance and Economics, China
- Lab MAS, France
Cite this article
as: L. Cao, X. Li, F. Kang, C. Liu, F. Sun, R. Kotagiri; 2015; The quantitative and qualitative evaluation of a multi-agent microsimulation model for subway carriage design; International Journal of Microsimulation; 8(3); 6-40.
doi: 10.34196/ijm.00120
- Article
- Figures and data
- Jump to
Figures
Figure 1

The essential components and concepts of a typical multi-agent microsimulation model.
Figure 2

The interior layout and exterior appearance of the SL Bombardier C20 subway carriage.
Figure 3
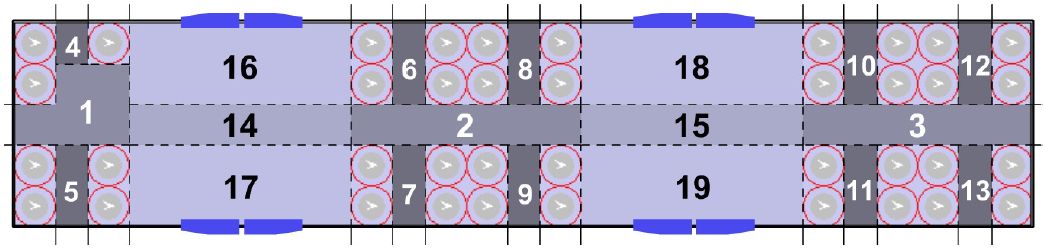

The manual zone partition (No. 1 ∼ 19) of the focused part of an SL C20 carriage.
Figure 4
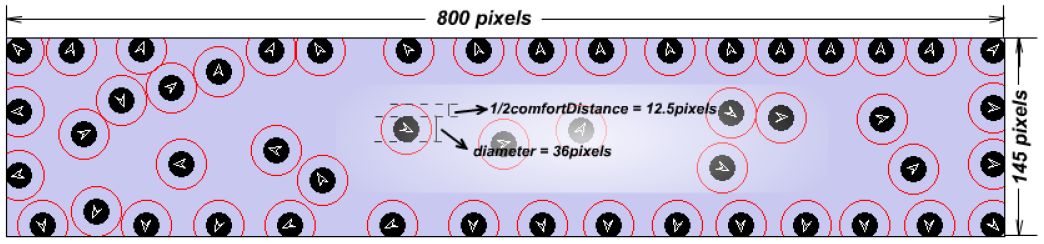

The measurements of the simulated environment space E and the agent attributes p, q.
Figure 5
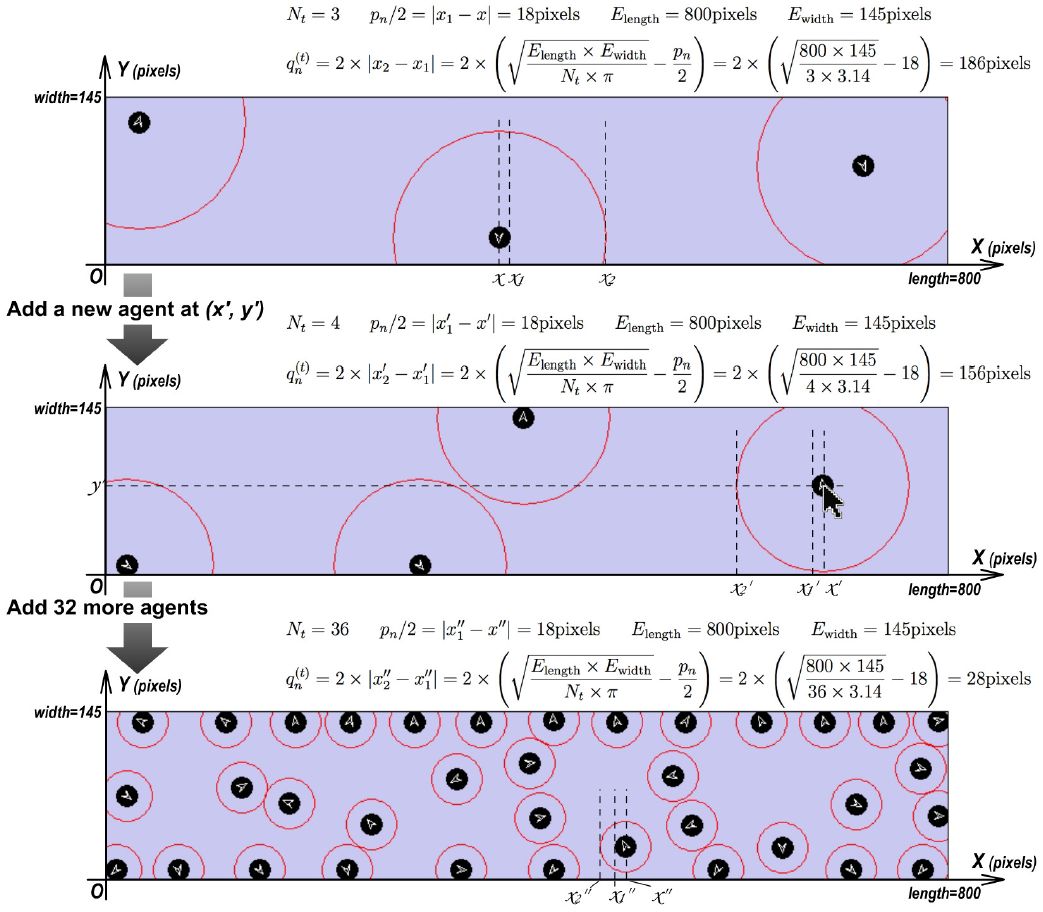
An calculation example of dynamic comfort distance : auto-adaptation according to Nt.
Figure 6
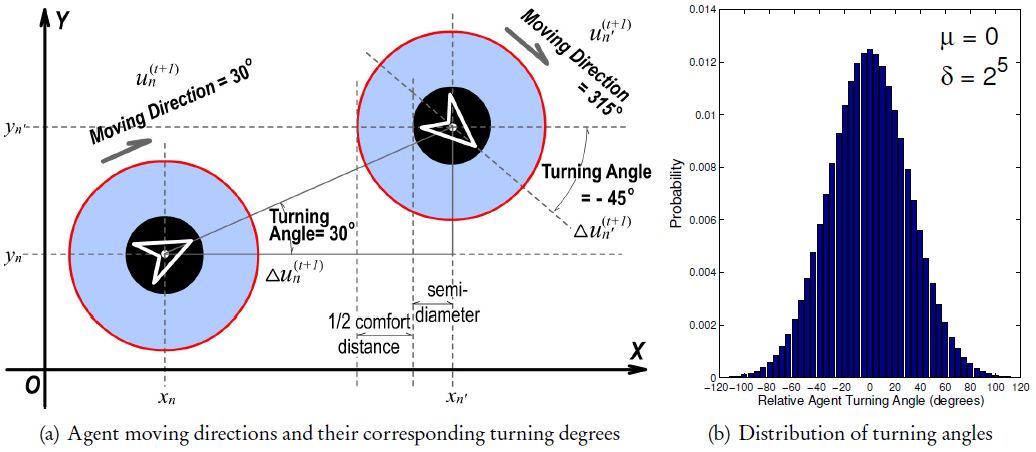

Illustration of agent turning angle that is selected obeying a discrete Gaussian distribution.
Figure 7
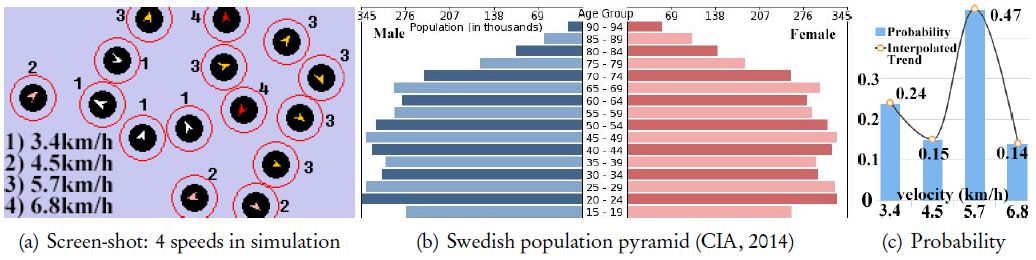

The heterogeneous agent moving speeds are mapped to groups of Swedish population.
Figure 8
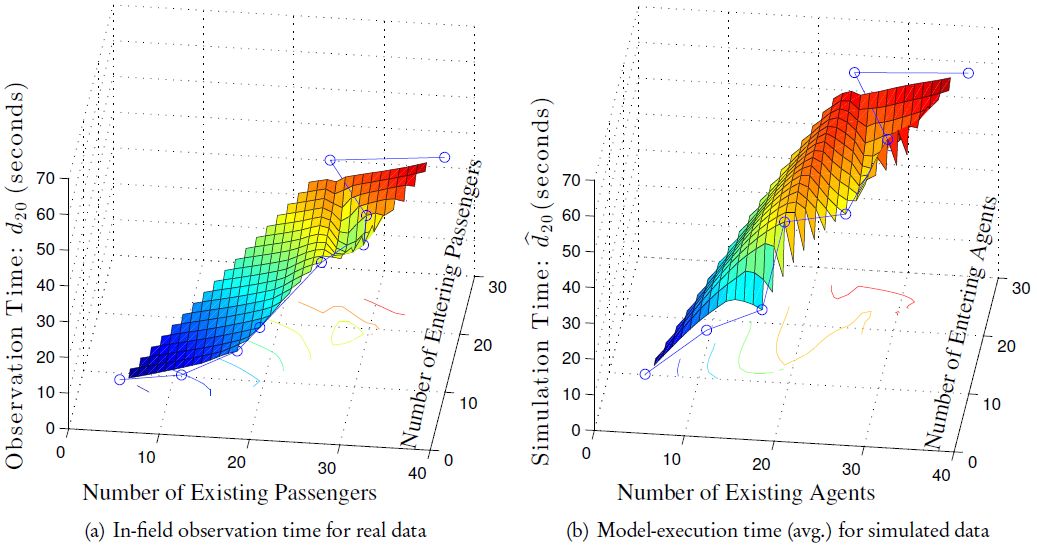

The observation/simulation time (blue line) and the corresponding cubic interpolations (3D surface) as a function of existing and entering passengers/agents.
Figure 9
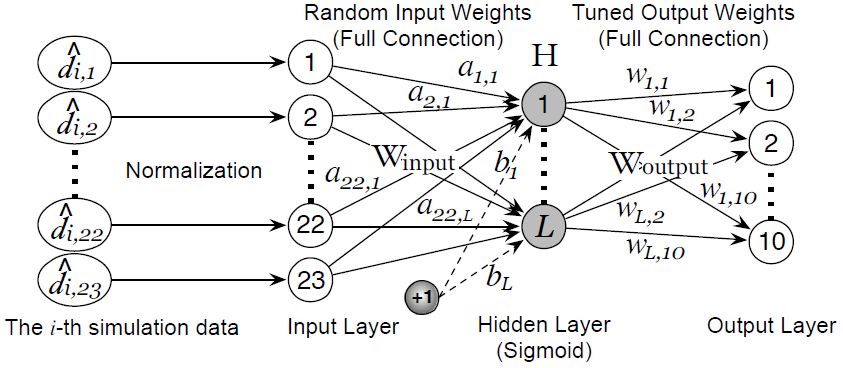

The structure of a typical ELM network with one hidden layer (with L nodes), one input layer (with 23 nodes), and one output layer (with 10 nodes representing 10 categories).
Figure 10
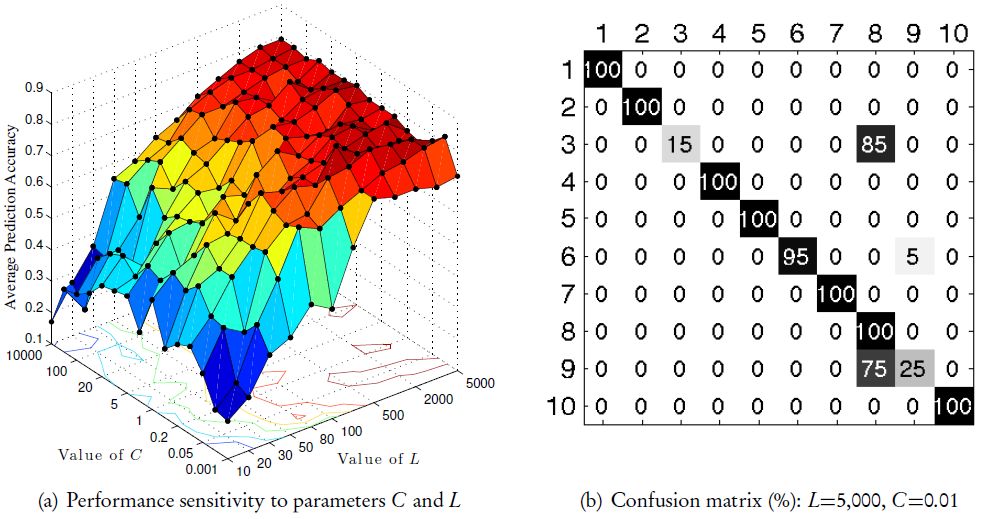

The evaluation results obtained via an unified multinomial classifier: (a) the performance sensitivity obtained via grid searching; (b) the class-wise confusion matrix of prediction accuracy.
(18)

Figure 11
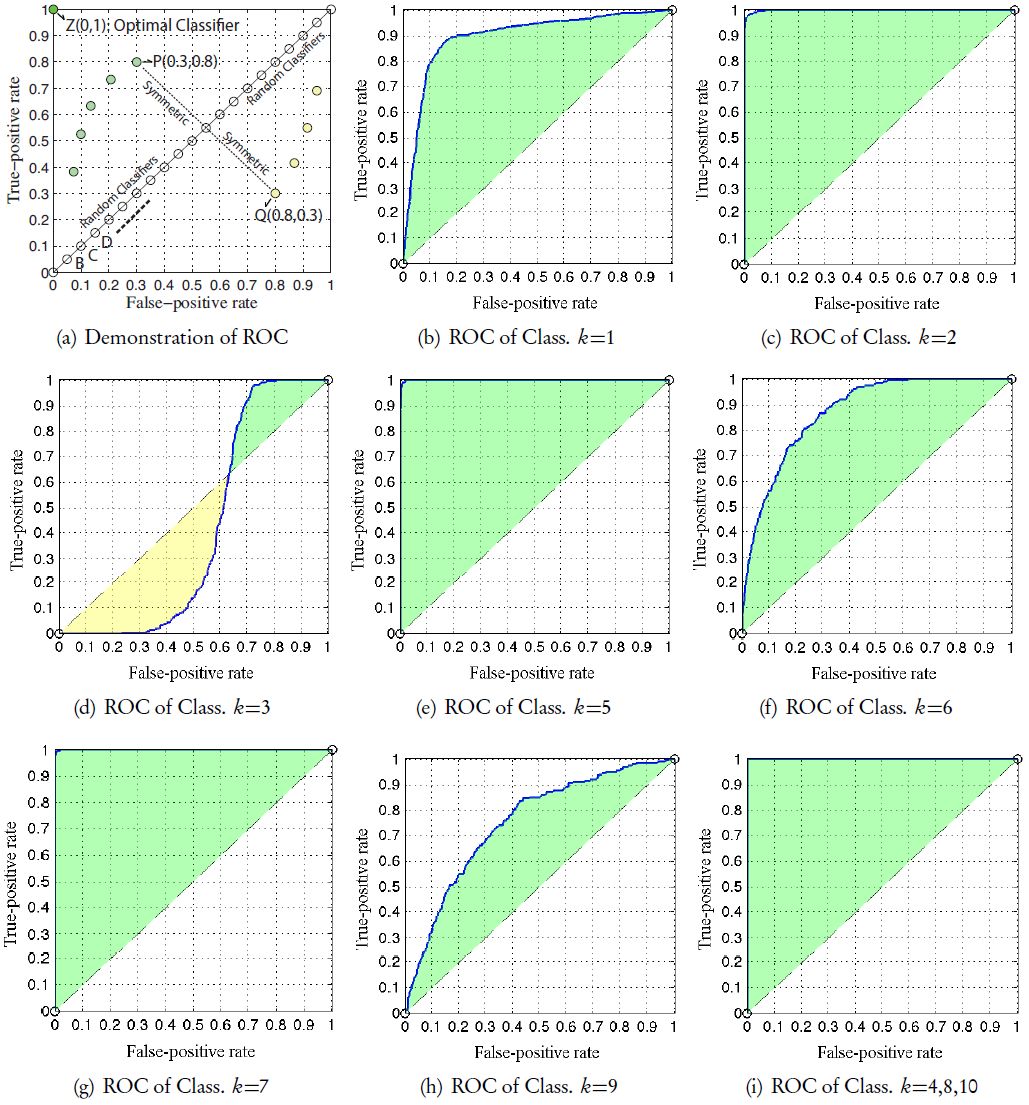

The quantitative evaluation results using receiver operating characteristics (ROC) graph:
Figure 12

A screen-shot of “left-right sub-carriage imbalance” in the SL C20 subway carriage.
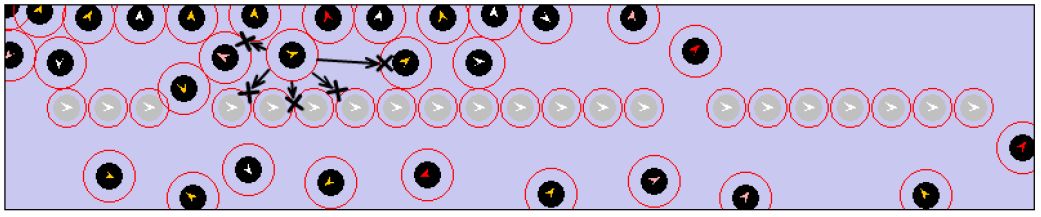
Figure 13

A screen-shot of “doorway jam” phenomenon in the SL C20 subway carriage.
Figure 14

A new design of seat layout by emptying wall areas in the SL C20 subway carriage.
Figure 15
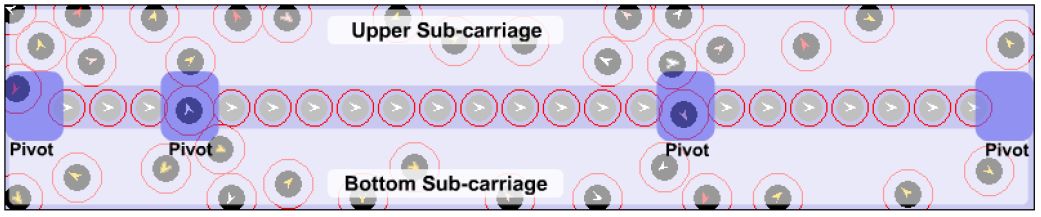

An example of “pivot blocking” in the SL C20 carriage with the new seat distribution.
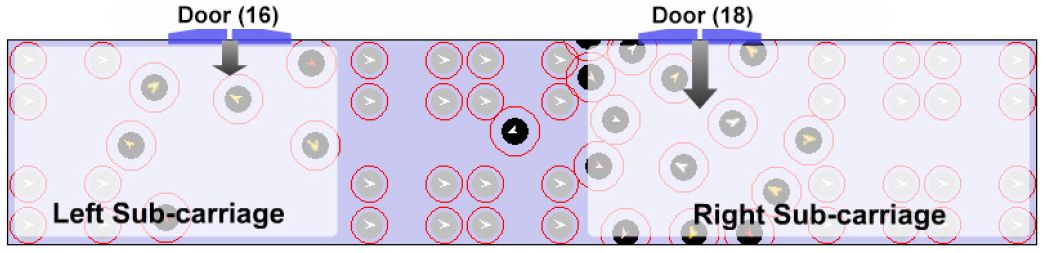
Figure 16
The “left-right sub-carriage imbalance” problem caused by “vertical detour difficulty”.
Tables
Table 1
Real data collected from in-field observation.
| di | Initial Status (entering|existing passengers) | Real-data Dimensions (i.e. di,1, di,2,…, di,23) |
| d1 | 17-01,19-03|16:1,17:2,18:1,19:1 | 1,0,0,0,0,0,0,0,0,0,0,0,0,1,1,2,1,2,1,08,0,1,0 |
| d2 | 17-03,19-00|14:1,16:3,17:2,18:2,19:4 | 0,1,0,0,0,0,0,0,0,0,0,0,0,2,1,1,2,4,4,12,4,3,0 |
| d3 | 16-01,18-03|9:1,14:3,15:3,16:4,17:3,18:2,19:2 | 1,1,1,0,0,0,0,0,1,0,0,0,0,3,3,2,4,3,3,18,1,1,0 |
| d4 | 16-02,18-05|1:1,14:3,15:3,16:4,17:2,18:4,19:3 | 3,2,3,0,0,0,0,0,0,0,0,0,0,4,4,3,3,2,3,20,3,1,1 |
| d5 | 16-07,18-05|1:1,2:2,14:3,15:2,16:5,17:5,18:5,19:3 | 4,2,3,0,0,1,0,0,0,0,0,0,0,5,7,4,2,6,4,31,6,3,2 |
| d6 | 17-09,19-08|1:2,2:4,14:2,15:2,16:7,17:3,18:4,19:4 | 3,3,2,0,0,1,1,0,0,0,1,0,0,6,7,6,5,4,6,28,3,1,1 |
| d7 | 16-10,18-06|1:4,3:1,4:1,7:1,14:4,15:2,16:5,17:4,18:4,19:4 | 3,2,2,0,0,0,1,0,0,0,0,0,0,5,9,7,6,4,7,30,7,4,3 |
| d8 | 17-08,19-10|1:2,2:2,3:2,4:1,8:1,14:2,15:2,16:5,17:2,18:6,19:5 | 4,4,3,1,0,0,0,1,0,0,0,0,0,5,8,3,8,7,4,35,0,3,5 |
| d9 | 17-11,19-13|1:2,2:2,3:1,6:1,8:1,14:3,15:3,16:4,17:3,18:2,19:3 | 2,4,2,0,1,0,0,0,1,1,0,0,0,6,8,6,5,5,8,40,3,3,4 |
| d10 | 16-10,18-11|1:3,2:4,3:2,6:1,7:1,10:1,14:5,15:4,16:5,17:4,18:4,19:5 | 4,6,3,0,0,1,1,1,0,1,0,0,0,8,9,8,7,5,6,46,4,6,5 |
Table 2
Partial simulation data samples generated from 100 valid micro-model executions.
| Model Initialization (entering|existing agents) | Features of Simulation Data | |
| 17–01,19–03|16:1,17:2,18:1,19:1 | 1,0,0,0,0,0,0,0,0,0,0,0,0,0,0,4,0,3,1,05,00,1,1 | |
| 17–01,19–03|16:1,17:2,18:1,19:1 | 1,0,1,1,0,0,0,0,0,0,0,0,0,1,0,1,1,0,3,10,00,0,4 | |
| 17–01,19–03|16:1,17:2,18:1,19:1 | 1,0,1,0,0,0,0,0,0,0,0,0,0,1,0,3,1,1,1,13,00,2,3 | |
| 17–01,19–03|16:1,17:2,18:1,19:1 | 1,0,3,1,0,0,0,0,0,0,0,0,0,0,0,1,1,1,1,18,04,4,4 | |
| 17–01,19–03|16:1,17:2,18:1,19:1 | 1,0,2,1,0,0,0,0,0,0,0,0,0,1,0,1,1,1,1,10,02,3,5 | |
| 17–01,19–03|16:1,17:2,18:1,19:1 | 1,0,3,1,0,0,0,0,0,0,0,0,0,0,0,1,1,1,1,09,03,3,4 | |
| 17–01,19–03|16:1,17:2,18:1,19:1 | 1,0,3,1,0,0,0,0,0,0,0,0,0,0,0,1,1,1,1,10,02,2,4 | |
| 17–01,19–03|16:1,17:2,18:1,19:1 | 1,0,1,1,0,0,0,0,0,0,0,0,0,0,0,1,1,1,3,08,01,1,3 | |
| 17–01,19–03|16:1,17:2,18:1,19:1 | 1,0,0,0,0,0,0,0,0,0,0,0,0,0,0,3,1,3,1,05,00,1,2 | |
| 17–01,19–03|16:1,17:2,18:1,19:1 | 1,0,0,0,0,0,0,0,0,0,0,0,0,0,0,4,0,1,3,07,00,1,1 | |
| 17–03,19–00|14:1,16:3,17:2,18:2,19:4 | 1,0,1,0,1,0,0,0,0,0,0,0,1,0,0,3,4,2,2,23,05,5,0 | |
| 16–01,18–03|9:1,14:3,15:3,16:4,17:3,18:2,19:2 | 1,1,1,0,1,0,0,0,0,0,0,0,1,1,2,5,1,4,4,27,02,3,1 | |
| 16–02,18–05|1:1,14:3,15:3,16:4,17:2,18:4,19:3 | 3,2,2,0,0,1,0,0,0,0,0,1,0,4,4,2,3,2,3,43,05,1,1 | |
| 16–07,18–05|1:1,2:2,14:3,15:2,16:5,17:5,18:5,19:3 | 3,3,2,0,0,1,0,0,1,0,1,0,1,5,5,4,3,6,3,46,07,2,2 | |
| 17–09,19–08|1:2,2:4,14:2,15:2,16:7,17:3,18:4,19:4 | 4,2,3,0,1,2,0,0,0,1,0,0,0,6,5,7,5,6,3,47,05,2,1 | |
| 16–10,18–06|1:4,3:1,4:1,7:1,14:4,15:2,16:5,17:4,18:4,19:4 | 3,1,2,1,0,1,0,1,0,1,0,0,0,4,7,8,6,5,6,52,10,3,4 | |
| 17–08,19–10|1:2,2:2,3:2,4:1,8:1,14:2,15:2,16:5,17:2,18:6,19:5 | 3,5,3,0,2,0,1,0,0,1,0,0,1,5,6,4,6,6,5,56,01,3,5 | |
| 17–11,19–13|1:2,2:2,3:1,6:1,8:1,14:3,15:3,16:4,17:3,18:2,19:3 | 2,5,3,0,0,1,1,0,1,0,0,1,1,7,5,6,5,5,6,63,04,2,4 | |
| 16–10,18–111:3,2:4,3:2,6:1,7:1,10:1,14:5,15:4,16:5,17:4,18:4,19:5 | 5,6,2,0,2,1,1,0,1,0,1,0,1,7,7,8,6,6,6,69,04,5,5 |
Table 3
Parameters and measures of 10 one-vs.-rest binary classifiers (200 trials); the scores labeled with bold, asterisk, and underline represent the best, 2nd best, and the worst results respectively.
| Parameters & Measures | Class. k=1 | Class. k=2 | Class. k=3 | Class. k=4 | Class. k=5 | Class. k=6 | Class. k=7 | Class. k=8 | Class. k=9 | Class. k=10 | Mean |
| Lk | 103 | 102 | 500 | 103 | 2,000 | 200 | 200 | 103 | 50 | 500 | N/A |
| Ck (baseline) | 106 | 103 | 102 | 103 | 103 | 102 | 102 | 1 | 10 | 102 | N/A |
| Mean Acc. | 0.879 | 0.916 | 0.897 | 0.996∗ | 0.991 | 0.906 | 0.992 | 0.998 | 0.872 | 0.996∗ | 0.944 |
| Dev. | 0.074 | 0.036 | 0.015∗ | 0.021 | 0.029 | 0.037 | 0.027 | 0.012 | 0.074 | 0.02 | 0.034 |
| Precision | 0.852 | 1 | 0.1 | 1 | 0.942 | 0.643 | 1 | 0.985∗ | 0.291 | 1 | 0.781 |
| Recall | 0.799 | 0.16 | 0.005 | 0.965 | 0.97∗ | 0.135 | 0.92 | 1 | 0.195 | 0.955 | 0.61 |
Download links
A two-part list of links to download the article, or parts of the article, in various formats.