Fiscal space and public spending on children in Burkina Faso
- and Université Laval Pavillon J.-A.-DeSève, Canada
- Université du Havre, France
- Université Laval Pavillon J.-A.-DeSève, Canada
Abstract
Despite experiencing high growth rates in recent decades, Burkina Faso remains a poor country. Poverty among children is particularly worrying, as it has long term (and often irreversible) effects on individuals. Furthermore, it can be transmitted from one generation to the next and significantly reduce economic growth. To address this issue requires fiscal and budgetary policies supporting health, education and improving the household economy. At the same time, the Burkina Faso’s budget deficit has grown in recent years as a result of various crises, which have hit the country.
This study uses a macro-micro model to evaluate three different policy interventions aimed at reducing child poverty in Burkina Faso under given budgetary constraints. The results indicate that increased public education spending helps raise school participation and promotion rates. This increases the supply and education level of skilled workers, leading to a reduced incidence and depth of both monetary and caloric poverty. A cash transfer scenario reduces child poverty even more.
1. Introduction
Burkina Faso has experienced consistently high economic growth over the last two decades. Despite a relatively solid economic performance, Burkina Faso remains a poor country and lags significantly in terms of infrastructure and human development. Since the beginning of the 2000s, Burkina Faso has made commendable efforts to promote development and to reduce poverty by developing a strategic framework for the fight against poverty (CSLP). However, assessments of the implementation of the CSLP indicate that it was largely undermined by the weakness of sectoral policies and insufficient budget allocations (Ministry of Economy and Finance 2010).
Child poverty results in huge social and economic losses with long-term effects on individuals and future generations. Intergenerational effects are not limited to poor children, as child poverty also significantly reduce economic growth for society as a whole. For example, child malnutrition imperils the acquisition of basic knowledge and thus productivity as an adult. Public social spending can improve child wellbeing, in the long run contributing to the economic growth of a nation. However, governments face budget constraints and need to make difficult choices concerning allocations of their limited budget between many pressing needs. Moreover, the sustainability and impacts of public spending on different programs depend on the financing mechanism(s) put into place.
The goal of this paper is to evaluate the impacts of three different scenarios that increase public spending on children under given budget constraints. We use a macro-micro framework to quantify the impacts of these scenarios on different education and poverty indicators.
The rest of the paper is organised as follows: the next section consists of an analysis of the poverty and the types of vulnerability and risks affecting children, in addition to a brief review of the existing social protection framework, in Burkina Faso. This is followed by two sections, which respectively present a literature review and the methodology used. The simulation results are then discussed before we conclude.
2. The situation of children in burkina FASO
As in many developing countries, in Burkina Faso children are more likely to be living in poverty than adults. Batana et al. (2012) find that children are 20 percent more likely than adults to live in poverty in developing countries.
Major progress has been accomplished in child education in Burkina Faso since 2000, particularly with respect to the supply of and access to universal primary education. The gross enrollment ratio in primary school went from 40% in 2000 to 87% in 2013. However, the rapid increases in the number of registered students, following the elimination of school fees for primary education, constitute a significant challenge with respect to education quality. Rapid population growth also puts pressures on the system’s capacity. In effect, average per capita public spending has not stopped falling since 2003 and student-teacher ratios have barely budged (World Bank, 2009).
In Burkina Faso, a large share of individuals are excluded from health care, particularly in rural areas. Major improvements have nevertheless been achieved: child vaccination objectives were largely exceeded and the number of health centres and personnel have both increased rapidly. Despite significant progress in health coverage, with a reduction in the average distance to reach a Health and Social Promotion Centre (CSPS), nearly one in ten children dies before the age of five in Burkina Faso1. Furthermore, more than one-third also suffer from delayed height and weight growth.
In terms of nutrition, stunting declined from 43.1% of children under the age of five in 2003 to 35.1% in 2009, with more noteworthy progress in rural areas. The share of children suffering from wasting also fell by nearly half, although the level still remains “severe” according to WHO norms. A strategic plan for 2010–2015 was adopted in order to reduce hunger and illness linked to nutritional deficiency diseases.
3. Literature review
The pursuit of Burkina Faso’s Poverty Reduction Strategy and the recent global Sustainable Development Goals (SDGs) requires for more detailed study of the impacts of public policies and social reforms. The studies reviewed below evaluate the consequences of fiscal reforms and public spending on vulnerable populations (poor households, orphans and other vulnerable children, etc.).
Child wellbeing is affected by fiscal and budgetary policies, notably through public services such as health and education, and improving the household economy (Waddington, 2004). A few pioneering studies are based on evaluation methods for fiscal and budgetary reforms and policies. Ahmad and Stern (1984) use benefit incidence analysis to evaluate the impacts of fiscal reforms on wellbeing and marginal benefit incidence analysis to assess the benefits associated with tax reforms. This approach has seen numerous applications, including contributions on child poverty, e.g. Yitzhaki and Thirsk (1990), Yitzhaki and Slemrod (1991), Mayshar and Yitzhaki (1996), Ray (1997), and Makdissi and Wodon (2002).
Bibi and Duclos (2004) extend benefit incidence analysis to identify the direction of impacts of fiscal reforms when the objective is to reduce poverty. Their approach, illustrated with Tunisian data, consists in deriving the cost-benefit ratio of an increase in a consumption tax by minimizing a poverty indicator.
Recent fiscal reforms in Africa following trade liberalization have rekindled interest for analysis of the impacts of fiscal reform on social welfare (Sahn & Younger, 2003; Chen et al, 2001; Rajemison & Younger, 2000; Alderman & del Ninno, 1999). These analyses are particularly interesting as they can be used to analyse fiscal changes induced by new policy regimes, as well as their impacts on the most vulnerable populations.
Benefit incidence analysis has the advantage of requiring little data, making it relatively easy to carry out (Ray, 1997). This is particularly suitable for developing countries where little data is available. However, it is limited to measuring the direct effect of the fiscal reform and thus ignores indirect effects that the reform may have on individuals and their behavioral responses.
Some authors (Glewwe, 1991; Gertler & Van Der Gaag, 1990), aiming to address the shortcomings of this approach, developed econometric estimations of the impact of fiscal policies on wellbeing by controlling for other variables that may influence the estimations.
The two preceding approaches (marginal incidence and econometric analysis) are partial equilibrium, and thus do not capture the feedback effects induced by other sectors or actors in the economy. These effects need to be considered for major public policy reforms with economy-wide impacts.
Computable general equilibrium (CGE) models are the most comprehensive tool to study the impacts of such policy reforms. They have been used to analyze the impact of a variety of public policies (trade liberalization, fiscal reforms, increased public spending) in developing countries. In order to capture household-level impacts, some such studies combine the CGE model with a microsimulation model (Decaluwé et al., 1999; Cogneau & Robillard, 2001 and 2004; Cockburn, 2006; Bourguignon et al., 2003; Boccanfuso et al., 2003).
The literature provides few applications of CGE models to Burkina Faso (Balma et al., 2011; Sawadogo et al., 2015). Gottschalk et al. (2009) use the MAquette for MDG Simulations (MAMS) model, developed by Lofgren and Diaz-Bonilla (2006), to simulate fiscal space and how it could be used to finance the pursuit of the MDGs. They identify three mechanisms to create fiscal space: establish priorities in public spending, increase foreign borrowing, or increase government revenues. In terms of uses of this space, they analyse an increase in spending on health, education and infrastructure. The authors show that there are trade-offs, for example between impacts on monetary poverty and health/education impacts, between the different spending scenarios. There are also trade-offs between financing mechanisms in terms of the reliance they create on domestic and foreign sources of financing. Investment in infrastructure is shown to not only beneficial for growth, but also for attainment of the MDGs. Health and education spending may run into structural constraints, notably the fact that learning and the training of personnel takes time. Our study complements the literature by contributing a macro-micro analysis that specifically deals with child poverty and schooling.
4. The modelling framework and data
To evaluate the impact of public policies on child well-being, we use a combined CGE (macro) and microsimulation (micro) model. The CGE model captures the macroeconomic effects of the policy and takes into account budgetary constraints. The micro model complements provides information on the specific impacts of the various reform scenarios on children. A detailed description of both models is provided in Cockburn et al. (2013). Here, we will briefly present their main characteristics.
4.1 The macro model
The dynamic computable general equilibrium (CGE) model we use is based on the standard PEP 1-t model (Decaluwé et al., 2010). To account for country-specific characteristics as well as schooling and health components, we made the following modifications.
First we changed the household demand function from an LES in the standard PEP 1-t model to a two-level nested function. The first level represents demand for each food product and for an aggregate non-food product. Demand in this first level is characterized by an AIDS (Almost Ideal Demand System)-type function (Deaton & Muellbauer 1980), which allows us to better account for cross-price elasticities. Note that price and income elasticities were estimated econometrically using the 2009 Integrated Survey on Burkinabe Household Living Conditions (EICVM). Demand for the “non-food aggregate” is then allocated among its components following a Cobb-Douglas function.
To model schooling decisions, we essentially follow the approach proposed by Lofgren and Diaz-Bonilla (2006). We specify the following five educational behaviours:
the primary entry rate, i.e., the share of children of age 6 to enter primary school
the promotion rate, i.e., the share of students who successfully finish a given year in an academic cycle. This rate covers both students who pass a non-terminal year in a cycle and those who pass the final year of the academic cycle in question
the repetition rate, i.e., the share of students repeating a given year
the dropout rate, i.e., the share of students who drop out of school in a given year
the transition rate, i.e., the share of students who, once they have completed an academic cycle, pursue further studies at a higher cycle
All of these shares are calibrated for the base year and then determined endogenously by the model.
Following the MAMS model, the primary entry rate, the promotion rate and the transition rate are determined by a logistic function. The repetition and dropout rates are assumed constant. These three behaviors are influenced by several arguments such as an education quality index (computed as the total spending budget at each cycle of schooling divided by the number of students enrolled in the cycle), the stock of capital in the respective education sectors, the infrastructure capital stock in the economy, the wage differential between skilled and unskilled workers, a health indicator represented by maternal mortality (MDG4), the price of education and, finally, per capita consumption. The value of each of these arguments is determined endogenously within the model. We assume that each of these arguments play a role in student behavior. For instance, an improvement in the education quality index or capital stock in the education sectors will positively impact the different behaviours regarding education.
The model also accounts for two health-related objectives: maternal mortality (MDG4) and child mortality (MDG5). For these two indicators, we use a logistic function to describe their evolution. In the same spirit as the preceding logistic function, the evolution of these two indicators is determined with the help of numerous arguments: per capita public health spending, the level of skills in the population, the value of MDG7 (the percentage of the population with access to drinking water). This last argument is not explicitly modelled: it is an exogenous variable. The final argument of this function is real per capita consumption, which in some form represents the wealth of households.
4.2 The micro-model
In order to evaluate the distributive effects of social policies, the CGE results serve as inputs to the microeconomic analysis at the level of individual households. Behavioural models are estimate so that we can then use the results (prices, employment, revenues) of the CGE to simulate the effects of implementing different social policies on two essential aspects of the living conditions of children: monetary and caloric poverty. Education (level 1 school entry, level 1 graduation and entry to the second level of study) and child mortality behavioural models are also used to estimate certain elasticities used in the macro model. The education models is also used to identify the new sample of skilled and unskilled individuals in each year of the simulation period. All these models affect real household consumption, which is the variable used to simulate the effect of the different proposed policy scenarios on child well-being.
A child is defined as monetarily poor if s/he lives in a household where consumption per adult equivalent, deflated by appropriate temporal and spatial price indices, is below the monetary poverty line. To analyze the level of monetary poverty among children in the initial situation and in the different scenarios, we use the headcount and poverty gap indicators for children aged 0–17. These two indicators respectively measure the percentage of children living in poverty and the average gap of consumption per adult equivalent relative to the poverty line. In this study, we use the monetary poverty line of 142 481 FCFA estimated in May 2011 by the World Bank. Total real consumption per adult equivalent is the principal indicator we use to evaluate the effects of changes brought about by the government interventions simulated in the macro component. This indicator is influenced by consumption prices and household income (wage rates and employment, income from independent work and auto-consumption, as well as education attainments – i.e. skilled and unskilled workers).
The monetary values of household consumption of various purchased or auto-consumed food products are converted into quantities using available information on prices in the geographically nearest market. These quantities are then converted into individual-level figures (per adult equivalent) by dividing by the household equivalence scale. These are converted into calories using nutritional tables, then compared to minimum caloric needs of 2 450 kilocalories per day per adult equivalent in order to measure caloric poverty. This measure allows us to calculate the incidence of caloric poverty among children. Changes in food prices and household incomes both affect the quantities of food products consumed, and thus caloric consumption.
4.3 The data used
We built a SAM for 2009 using the input-output table of that year (Automated Forecasting Instrument (IAP), Burkina Faso). While other SAMs have already been published for Burkina Faso, they do not include major changes in recent years. Indeed, growth in the mining sector has been substantial, particularly its exports. Also, we wanted the data, particularly data linked to the public budget, to reflect the current situation of the economy. The SAM includes two types of workers (skilled and unskilled), one household, 24 products and 17 sectors.
We separate the education system into two levels. Level 1 education includes students in primary school and those in the first cycle of secondary. Students who complete the first level of secondary school are considered as skilled workers when they enter the labour market. However, students who do not manage to complete this level enter the labour market as unskilled workers. Level 2 education includes students in the second level of secondary school and students enrolled in higher education.
The different shares for the above-mentioned student behaviors were calibrated for the base year using data published in the annual report on education statistics (Ministry of Primary Education and Literacy, 2010; Ministry of Secondary and Higher Education and Scientific Research, 2009). The total population of Burkina Faso in 2009 and the population growth rates are both taken from the Population Division, Population Estimates and Projections Section (UNDESA) database for 2009–2033. As for the values relating to the MDGs, we take the values published in SCADD (2010).
The elasticities of the education-related behavior and those on household consumption were estimated econometrically using the EICVM 2009 survey (National Institute of Statistics and Demography, 2009) following the approaches presented above. As for the elasticities of the child mortality model, estimates were made based on matched data from the DHS survey (which provides the information needed to calculate mortality) and the EICVM survey (which includes data on household consumption). A logit model of child mortality is estimated using the DHS survey using only variables found in both surveys. This is then used to predict the probability of death among children under the age of 5 in the EICVM survey. We then used the EICVM data to estimate an OLS model of the probability of death as a function of per capita consumption – which is only available in the EICVM survey – and other variables. This is used to estimate the elasticity probability of death with respect to per capita consumption. For elasticities related to trade the production function, we have taken the values used by Balma et al., 2011.
5. Presentation of scenarios and results
5.1 The reference scenario
First, we build a reference scenario, also called the Business As Usual (BAU) scenario. Between 2009 (the base year in the model) and 2033 (the last year simulated in the model), the BAU scenario is based on IMF forecasts (International Monetary Fund, 2011): increases in foreign demand for cotton and minerals, a reduced deficit-to-GDP ratio, an increase in direct taxes on households and firms, and constant public spending as a share of GDP. On this basis, our model produces, in the reference scenario, an evolution of GDP similar to the forecasts in the IMF document.
The IMF forecasts only go to 2015, so the reference scenario assumes that policies implemented by 2015 will be maintained in following periods. Also, the increase in demand for various export products matches the population growth rate as of 2015, implying that foreign demand will continue to grow, but at a slower pace compared to the 2010–2015 period. All of these base assumptions are maintained throughout all simulation scenarios to allow the results to be compared to the reference scenario.
5.2 The simulation scenarios
The simulation scenarios represent three policies that target child well-being and take account of the financial constraints of the Burkina Faso government. The first scenario involves an increase in current spending on education (Spending). The second scenario introduces an education price subsidy (Subsidy). The third scenario is based on a cash transfer to households with a child aged 0–5 (Transfer). In all cases, the same total amount of money is injected into the economy, making it easier to compare the three scenarios. Each of these scenarios is financed by extending the timeframe to reduce the deficit-to-GDP ratio2. The deficit thus grows relative to the reference scenario, and the government achieves its goal of progressively reducing the deficit-to-GDP ratio by half over ten years, rather than the anticipated five years. It should be noted that the policy is temporary (10 years) in every case. By 2020, public policies return to those forecasted in the reference scenario.
Assumptions for the three simulation scenarios.
| Spending increase (in % of education spending) | Subsidy (CFA per student) | Transfer (CFA per child 0–5 years) | |
|---|---|---|---|
| 2010 | 25% | 24,501 | 17,823 |
| 2011 | 23% | 23,982 | 17,463 |
| 2012 | 21% | 23,380 | 17,135 |
| 2013 | 16% | 18,954 | 14,026 |
| 2014 | 15% | 18,414 | 13,790 |
| 2015 | 14% | 17,867 | 13,568 |
| 2016 | 11% | 13,820 | 10,668 |
| 2017 | 11% | 13,340 | 10,498 |
| 2018 | 5% | 6,436 | 5,166 |
| 2019 | 5% | 6,208 | 5,085 |
5.3 Analysis of results
These different interventions, while equivalent in terms of public spending, will have significantly different impacts in terms of education outputs, GDP and children poverty.
5.3.1 Impact on education
Student behaviors, such as school participation and promotion rates, are affected by different factors (cf. Section 4.1). The different policy interventions, in turn, affect these factors differently: an increase in education spending has a direct impact on the education quality index; a school fees subsidy acts primarily by reducing the relative price of education; cash transfers essentially increases household real per capita consumption.
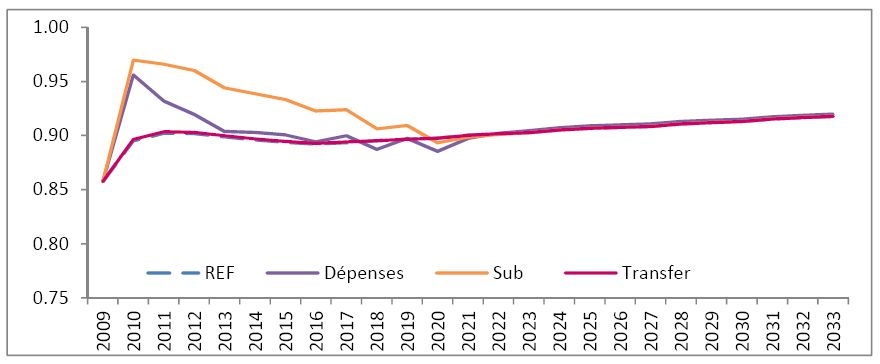
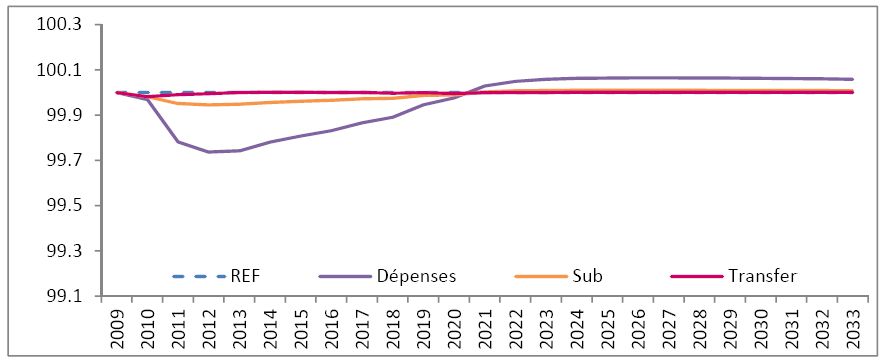
School fees subsidies have a larger beneficial impact on primary school entry but also increase the dropout rate, whereas increasing education spending has a smaller positive impact on entry but simultaneously reduces the dropout rate (Figures 1 and 2). Indeed, subsidizing school fees causes more six-year-old children to join the education system. However, since public spending on education is constant in this scenario, the higher number of students leads to a reduction in the quality of education services received by each student and therefore increases the dropout rate. Under the “spending” scenario, the education quality index increases, thus favouring both primary school enrollment and the duration of studies.
Cash transfers to households increase household real per capita consumption directly. However, our simulation results indicate that this has a negligible impact on education decisions. The different indicators are thus essentially the same as in the reference scenario (Figures 1 and 2).

Entry rate, primary school.

Dropout rate, first level of study.
5.3.2 Impact on labour market and growth
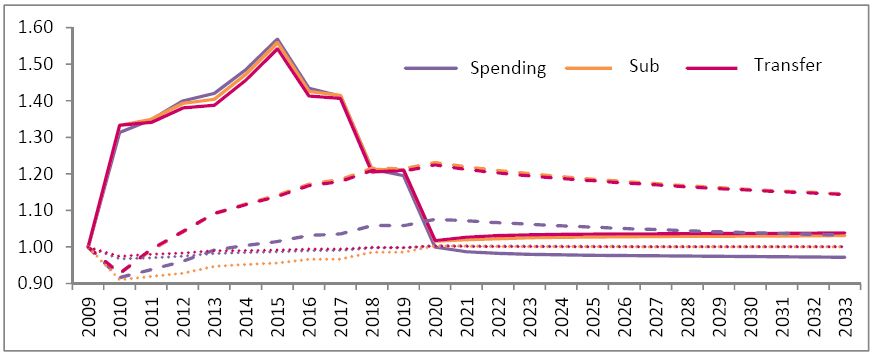
Given the reduction in dropout rates, it is not surprising to find that the supply of skilled workers increases most under the spending scenario. Despite higher entry rates, higher dropout rates in the subsidy scenario imply that the number of skilled workers – those who complete the first level of secondary school – increases by just 3 000 (Figure 3). Given the limited impacts of a cash transfer policy on education decisions, it is unsurprising that it has a negligible impact on the number of skilled workers (less than 400 new workers). As a result, the impacts on growth of these two scenarios are barely perceptible (Figure 4).

Supply of qualified workers index (reference = 100).

Real GDP index (reference = 100).
All of the scenarios have a similar impact on the deficit-to-GDP ratio (solid line in Figure 5): it increases during the period of increased spending and then returns near to reference values. Given that, compared to the reference scenario, the end-of-period ratios are slightly higher in the spending scenario and slight lower in the subsidy and cash transfer scenarios, the end-of-period debt-to-GDP ratios (broken line) are greater for the latter. These results can be explained by the increased economic growth in the spending scenario, which increases the denominator of the debt-to-GDP ratio, as income-to-GDP ratios (dotted line) are practically identical in all scenarios.

Evolution of fiscal ratios to GDP (reference = 1).
5.3.3 Impact on poverty
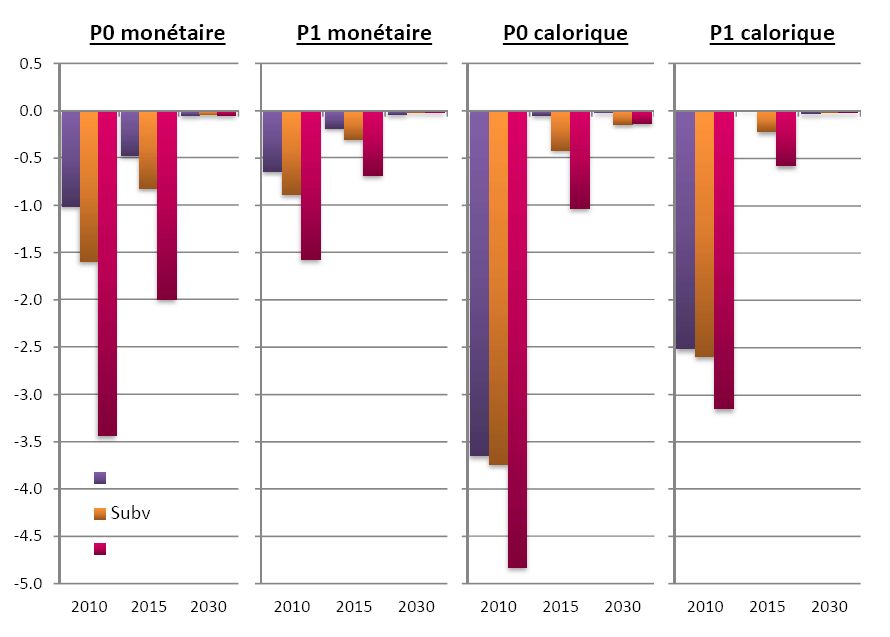
While the cash transfer scenario has little macroeconomic impact, as it directly impacts household real consumption, its effects on poverty are significant. All of the poverty indicators, expressed in both monetary and caloric forms, improve markedly beginning in the first year (Figure 6): the incidence of monetary poverty in 2010 is three percentage points lower than in the reference scenario and the incidence of caloric poverty is nearly five percentage points lower. In other words, there would be three percent fewer children living under the poverty line and five per cent fewer children suffering from caloric poverty. These impacts decline as cash transfers are reduced, and are almost negligible in the long term. The poverty gap progresses similarly.

Variation of poverty incidence (P0) and poverty gap (P1) for monetary and caloric poverty (in percentage points) with respect to reference scenario.
These results can be explained by increased income among households with children, which directly increases their consumption. Given that poor households have, on average, more children, this type of policy benefits them more than the other two policies. The other intervention types have a smaller and more indirect impact on household consumption. Under the spending scenario, the greater demand for teachers pushes wages up, and has positive general equilibrium repercussions on the rest of the economy. Compared to the spending scenario, the school fees subsidy frees up a share of the household consumption budget for the purchase of other products, which explains why the results concerning poverty are better.
6. Conclusions and policy recommendations
Despite high growth rates in recent years, Burkina Faso remains a poor country. The government recognizes the need for a stronger commitment to reduce poverty and improve human development. At the same time, the Burkinabe budget deficit has risen in recent years, in response to the various crises that have hit the country. There are strong pressures to rapidly reduce this budget deficit, but there are grave concerns about how this will be achieved.
In this paper, through a combined CGE-micro simulation model, we analysed three temporary public spending policies: an increase in education spending, a school fees subsidy and a cash transfer to households with children under the age of five. The amount injected into the economy is the same in each of these three cases, making it easy to compare the three scenarios. In all scenarios, the injections are reduced gradually in order to attain the same deficit-to-GDP ratios as a reference – business-as-usual – scenario, but over a slightly longer period: ten years, instead of five. Compared to the reference scenario, the results indicate that higher public education spending increases school participation and promotion rates, leading to an increased supply of skilled workers and higher economic growth, while also reducing the incidence and depth of both monetary and caloric poverty. The school fees subsidies have more differentiated impacts on education, with a larger beneficial impact on primary school entry but a partially offsetting decline in education quality and resulting promotion rates. As a result, the supply of skilled workers and economic growth are practically unaffected. By freeing up part of the household budget for other ends, this type of intervention has a slightly stronger effect on poverty than public spending. Cash transfers have a minimal impact on educational behaviours, and thus on the supply of skilled workers and economic growth, but they directly increase household income thus significantly reducing the incidence and severity of poverty.
In summary, if the objective is to achieve improved educational and economic performance, the best approach would be to increase public education spending. However, cash transfers to families would be more suitable if reducing child poverty is instead prioritized.
Footnotes
1.
Under-five child mortality rate = 88.6 (per 1000) in 2015, down from 149.4 in 2006 (World Development Indicators, databank.worldbank.org/data/home.aspx, accessed March 16, 2016).
2.
For alternative financing mechanisms, refer to Cockburn et al. (2013)
References
-
1
‘The Theory of Reform and Indian Indirect Taxes’Journal of Public Economics 25:259–298.
-
2
‘Poverty issues for zero rating VAT in South Africa’Journal of African Economies 8:182–208.
-
3
‘Public education spending and poverty in Burkina Faso: A calculable general equilibrium approach (Dépenses publiques d’éducation et pauvreté au Burkina Faso: une approche en Équilibre Général Calculable)’. PEP Working Paper 2011-04‘Public education spending and poverty in Burkina Faso: A calculable general equilibrium approach (Dépenses publiques d’éducation et pauvreté au Burkina Faso: une approche en Équilibre Général Calculable)’. PEP Working Paper 2011-04.
-
4
‘Analyse de la situation de la pauvreté et de la vulnérabilité de l’enfant et de la femme au Burkina Faso (Analysis of the situation of poverty and vulnerability of children and women)’. Report commissioned by UNICEF-Burkina Faso‘Analyse de la situation de la pauvreté et de la vulnérabilité de l’enfant et de la femme au Burkina Faso (Analysis of the situation of poverty and vulnerability of children and women)’. Report commissioned by UNICEF-Burkina Faso.
-
5
‘Réformes Fiscales et Réduction de la Pauvreté: Application sur des Données Tunisiennes (Fiscal reforms and poverty reduction: An application to Tunisian data)’. Working paper, Université de Tunis El Manar Faculté des Sciences Economique et de Gestion de Tunis‘Réformes Fiscales et Réduction de la Pauvreté: Application sur des Données Tunisiennes (Fiscal reforms and poverty reduction: An application to Tunisian data)’. Working paper, Université de Tunis El Manar Faculté des Sciences Economique et de Gestion de Tunis, http://www.aed.auf.org/IMG/pdf/S.Bibi.pdf, accessed 29 January 2016.
-
6
Un modèle CGE-Multi-Ménages Intégrés Appliqué à l’économie sénégalaise (An integrated multi-household CGE model applied to the Senegalese economy)Mimeo: CREA, Dakar.
-
7
Representative versus real households in the macroeconomic modeling of inequality. Working Paper DT/2003/10DIAL, Unité de recherche CIRPEE.
-
8
Uganda’s Recovery: The Role of Farms, Firms, and Government‘A Quest for Revenue and Tax Incidence’, (Eds.), Uganda’s Recovery: The Role of Farms, Firms, and Government, Washington DC, World Bank.
-
9
Globalization and Poverty: Channels and Policies‘Trade Liberalisation and Poverty in Nepal: A Computable General Equilibrium Micro Simulation Analysis’, (Eds.), Globalization and Poverty: Channels and Policies, London, Routledge.
-
10
‘Fiscal Space and Public Spending on Children in Burkina Faso’. Working PAPER 13-08CIRPEE, University Laval.
-
11
IFPRI TMD Discussion paper No. 61 and DIAL Working Paper DT/2001-19, IFPRI TMD and DIALIFPRI TMD Discussion paper No. 61 and DIAL Working Paper DT/2001-19, IFPRI TMD and DIAL.
-
12
Poverty Alleviation Policy in Madagascar: A Micro-Macro Simulation Model. Working Paper, DT/2004/11DIAL, Unité de Recherche CIRPEE.
- 13
-
14
Measuring poverty and inequality in a Computable general equilibrium frameworkMeasuring poverty and inequality in a Computable general equilibrium framework, Cahier de recherche no 99-20, CREFA, Université Laval.
-
15
‘The PEP standard computable general equilibrium model single-country, recursive dynamic version PEP-1-t’Accessed January 29, 2016.
-
16
The willingness to pay for medical care: Evidence from two developing countriesBaltimore: The John Hopkins University Press.
-
17
‘Investigating the Determinants of Household welfare in Côte d’Ivoire’Journal of Development Economics 35:307–337.
-
18
Analyzing Fiscal Space Using MAMS: An Application to Burkina Faso. IMF working paper WP/09/227International Monetary Fund.
- 19
-
20
MAMS: An Economy-wide Model for Analysis of MDG Country StrategiesMAMS: An Economy-wide Model for Analysis of MDG Country Strategies, Technical Documentation, DECPG, World Bank.
-
21
‘Consumption Dominance Curves: Testing for the Impact of Indirect Tax Reforms on Poverty’Economics Letters 75:227–235.
-
22
‘Dalton-improving tax reform: When households differ in ability and needs’Journal of Public Economics 62:399–412.
-
23
‘Progrès et acquis du développement du Burkina Faso 2000–2009 (Development progress and gains in Burkina Faso 2000–2009)‘Progrès et acquis du développement du Burkina Faso 2000–2009 (Development progress and gains in Burkina Faso 2000–2009).
-
24
Statistiques de l’éducation de base 2009-2010 (Primary education statistics, 2009–2010)Directorate of studies and planning.
-
25
Annuaire statistique de l’enseignement secondaire 2008–2009 (Annual report on secondary education statistics)Directorate of studies and planning.
-
26
‘Indirect tax in Madagascar: Estimations using the input-output table’. CFNPP Working Paper #106‘Indirect tax in Madagascar: Estimations using the input-output table’. CFNPP Working Paper #106.
- 27
-
28
Evaluating the poverty and distributional impact of economic policies‘Estimating the Incidence of Indirect Taxes in Developing Countries’, Evaluating the poverty and distributional impact of economic policies, New York, Oxford University Press.
-
29
‘Impact de l’expansion économique et commerciale de la Chine sur la croissance et l’emploi au Burkina Faso: une analyse en équilibre général calculable’. PEP Working Paper 2015-03, PEP‘Impact de l’expansion économique et commerciale de la Chine sur la croissance et l’emploi au Burkina Faso: une analyse en équilibre général calculable’. PEP Working Paper 2015-03, PEP.
-
30
‘Global diagnostic of SCADD (Rapport sur le diagnostic global de la SCADD 2010)’‘Global diagnostic of SCADD (Rapport sur le diagnostic global de la SCADD 2010)’.
-
31
‘World population prospects’Accessed January 29, 2016.
-
32
‘Linking Economic Policy to Childhood Poverty: A review of the evidence on growth, trade reform and macroeconomic policy’. CHIP Report No.7, CHIP‘Linking Economic Policy to Childhood Poverty: A review of the evidence on growth, trade reform and macroeconomic policy’. CHIP Report No.7, CHIP.
-
33
La Revue des Dépenses Publique dans le secteur de l’éducation (Public expenditure review in the education sector)Burkina Faso: World Bank.
-
34
‘Welfare dominance: An application to commodity taxation’American Economic Review 81:480–496.
-
35
‘Welfare Dominance and the Design of Excise Taxation in the Côte d’Ivoire’Journal of Development Economics 33:1–18.
Article and author information
Author details
Acknowledgements
We thank Lacina Balma, Yiriyibin Bambio and Hervé Jean-Louis Guène for their research assistance. Sarah Hague, Sebastian Levine, Leonardo Menchini, a technical committee of the government of Burkina Faso, as well as Jingqing Chai and colleagues from the Policy and Practice division of UNICEF, provided extremely useful comments. This study was financed by UNICEF-Burkina Faso through the Partnership for Economic Policy (PEP), which receives funding from the Department for International Development (DFID) of the United Kingdom (or UK Aid), and the Government of Canada through the International Development Research Center (IDRC).
Publication history
- Version of Record published: April 30, 2016 (version 1)
Copyright
© 2016, Cockburn
This article is distributed under the terms of the Creative Commons Attribution License, which permits unrestricted use and redistribution provided that the original author and source are credited.