Fiscal space and public spending on children in Burkina Faso
John Cockburn, Hélène Maisonnave, Véronique Robichaud, Luca Tiberti
Partnership for Economic Policy (PEP), and Université Laval Pavillon J.-A.-DeSève, Canada; EDEHN, Department of Economics, Université du Havre, France; Independent researcher and Resource person – PEP network, Université Laval Pavillon J.-A.-DeSève, Canada
Cite as: J. Cockburn, H. Maisonnave, V. Robichaud, L. Tiberti; 2016; Fiscal space and public spending on children in Burkina Faso; International Journal of Microsimulation; 9(1); 5–23. doi: 10.34196/ijm.00126
Abstract
Despite experiencing high growth rates in recent decades, Burkina Faso remains a poor country. Poverty among children is particularly worrying, as it has long term (and often irreversible) effects on individuals. Furthermore, it can be transmitted from one generation to the next and significantly reduce economic growth. To address this issue requires fiscal and budgetary policies supporting health, education and improving the household economy. At the same time, the Burkina Faso’s budget deficit has grown in recent years as a result of various crises, which have hit the country.
This study uses a macro-micro model to evaluate three different policy interventions aimed at reducing child poverty in Burkina Faso under given budgetary constraints. The results indicate that increased public education spending helps raise school participation and promotion rates. This increases the supply and education level of skilled workers, leading to a reduced incidence and depth of both monetary and caloric poverty. A cash transfer scenario reduces child poverty even more.
This article contains 6 figures and 1 table.
Figures
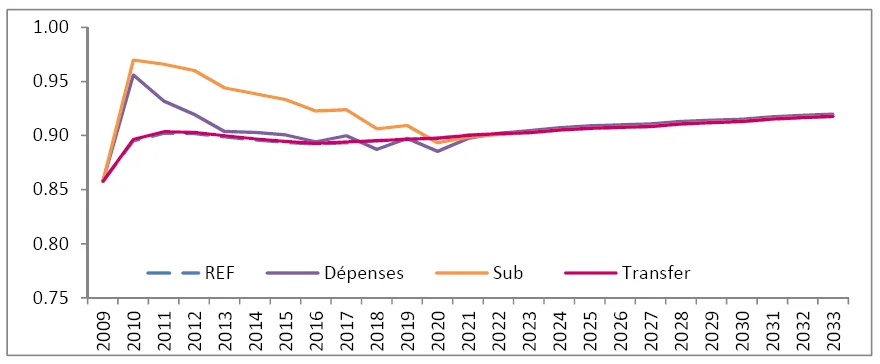
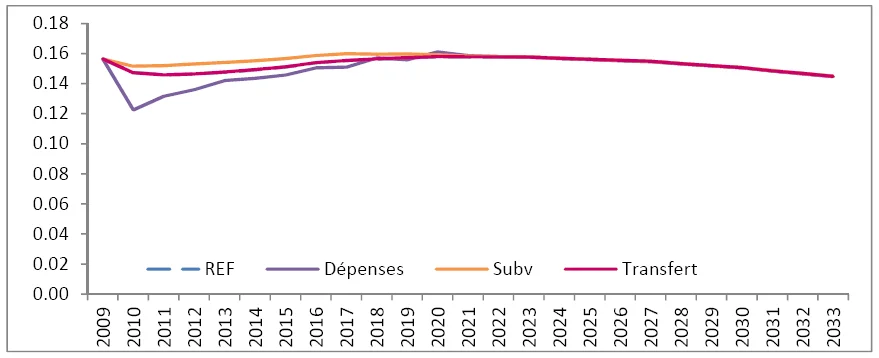
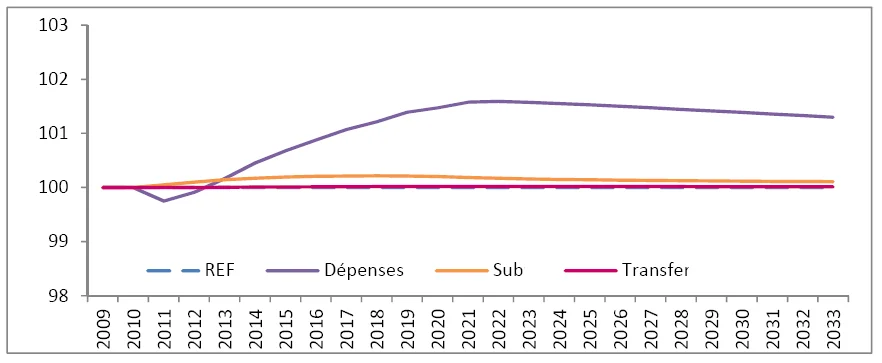
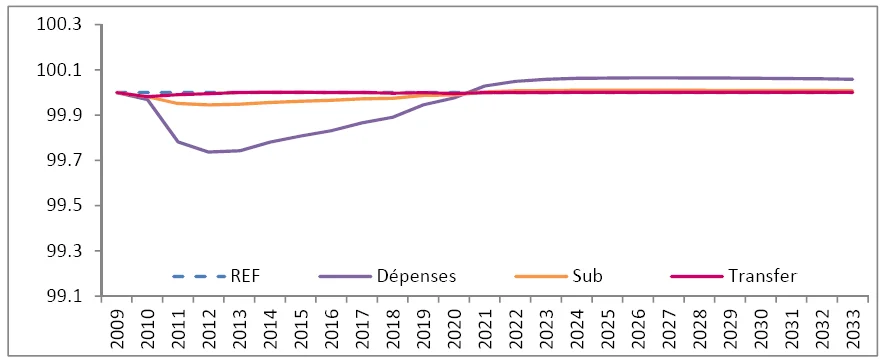
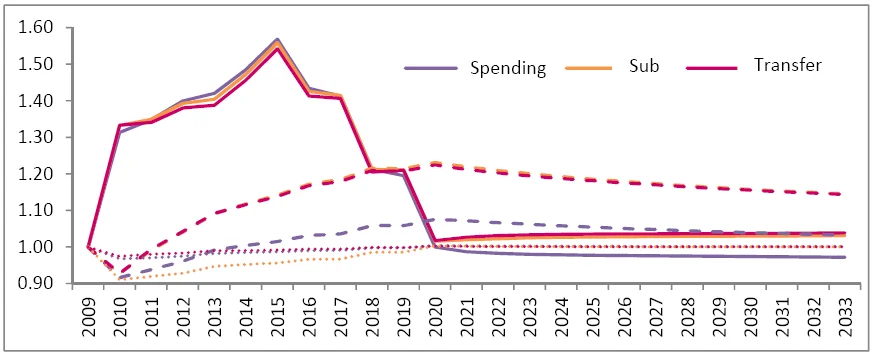
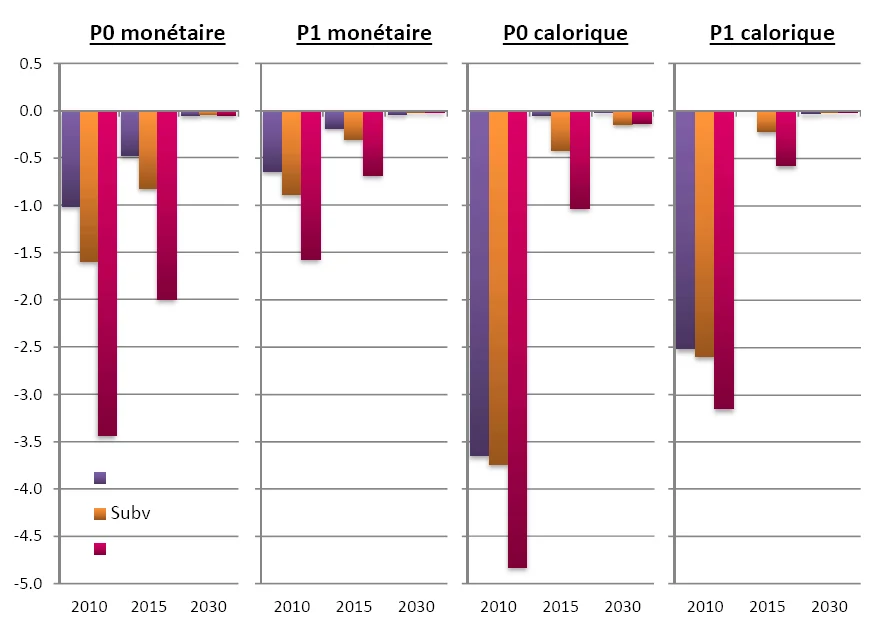
Figure 1. Entry rate, primary school.Figure 2. Dropout rate, first level of study.Figure 3. Supply of qualified workers index (reference = 100).Figure 4. Real GDP index (reference = 100).Figure 5. Evolution of fiscal ratios to GDP (reference = 1).Figure 6. Variation of poverty incidence (P0) and poverty gap (P1) for monetary and caloric poverty (in percentage points) with respect to reference scenario.
Tables
Table 1. Assumptions for the three simulation scenarios.