Impact of trade liberalization on poverty in Ethiopia: A computable general equilibrium microsimulation
- Humboldt University of Berlin, Faculty of Agriculture and Horticulture Invalidenstr, Germany
- BDS-Center for Development Research (BDS-CDR), Ethiopiae
- Addis Ababa University, Ethiopia
Abstract
This study analyses the impact of trade liberalization on poverty in Ethiopia using a computable general equilibrium Microsimulation approach. Two scenarios (complete tariff cut and uniform tariff scheme) suggest that further liberalization of trade has a negative short-run effect on the overall economy. We find that the agriculture-based manufacturing sector (in particular, textile and leather) is likely to be strongly affected by tariff reductions. Poverty estimates show an increase in both scenarios. At the national level, complete tariff cut increases poverty by 2.8%, compared to 2.3% under a uniform tariff scheme. In both scenarios, poverty increases more among entrepreneur households (3.2% in the uniform tariff cut scenario), than farm and wage earner households (0.9% and 1.5%, respectively). This is consistent with the theoretical argument that previously-protected infant industries are highly affected by trade liberalization and may require compensatory policies.
1. Introduction
The overarching importance of trade is recognized as a key element of sustainable development in both developed and developing countries. Inspired by the gains from trade, developing countries have adopted an outward-looking, export-oriented development approach aiming at enhancing the efficiency of resource allocation (Berg & Krueger 2003). Trade liberalization is a policy measure that promotes industrialization and modernization through securing economies of scale, market access, and trade expansion.
Trade and poverty are linked through prices, changes in external terms of trade, government taxes and transfers, as well as investment incentives (Hertel & Reimer 2004). Winters(2002) identifies six trade-to-poverty channels including the extent of price changes and how these affect the poor, changes in government revenue and expenditure, changes in risk and vulnerability, links via factor markets, effects on economic growth, as well as adjustment strains. These effects can be dampened by a host of factors, including stifling policies, high transaction costs, missing markets, and factor immobility. This is particularly the case in developing countries, as domestic capacity constraints may prevent the poor from taking advantage of opportunities created by trade liberalization and export market access.
Trade liberalization leads to increased efficiency of domestic economic sectors depending on: a) the level and extent of initial protection of a given sector; b) the degree of openness of a sector and/or whether the sector is export-oriented or not; and c)the capacity of a given sector to compete against imports. One possible impact of eliminating tariff distortions is increased efficiency in resource use as productive factors flow from initially more protected sectors to less protected ones.1 In addition, it is likely that export-oriented and import-dependent industrial sectors benefit most from trade liberalization efforts (Chitiga et al.2007; Mabugu & Chitiga 2007; Annabi et al.2005; Cororaton & Corong 2006) because of increased supplies of cheaper imported inputs.
Studying the poverty effects of trade liberalization in Ethiopia is timely and relevant as the country is negotiating about the degree and sequence of trade liberalization as part of its accession to the World Trade Organization (WTO). Ethiopia requested WTO accession on January 13, 2003. Ethiopia’s Memorandum on its Foreign Trade Regime was circulated in January 2007. The Working Party on the Accession of Ethiopia held its first meeting in May 2008 and subsequent meetings were held in 2011 and 2012 to examine Ethiopia’s foreign trade regime (WTO 2010).
The rest of this paper is organized as follows: The next section outlines the empirical and conceptual links between trade liberalization and poverty. Section three presents an overview of the Ethiopian economy with details on its structure as well as its economic growth, trade, and poverty trends. The fourth section outlines data sources and methodology. Major findings of this paper are discussed in the fifth section and the last section concludes.
2. Trade liberalization and poverty: empirical and conceptual issues
Many empirical studies assess the impact of trade liberalization on poverty globally and in Ethiopia in particular (Robilliard et al.2003; Bussolo & Lay 2003; Ianchovichina et al.2001; Hertel et al. 2004; Friedman 2001; Ravallion & Lokshin 2004; Chitiga et al.2007; Philip & Ferede 2005; Gelan 2002; Geda & Shimeles 2005; Getnet 2008; Tegene 1991; Taye, 1999). However, the literature is far from being conclusive concerning the effects of trade liberalization on the welfare of different groups of households.
Gelan (2002) investigates the impact of external shocks (namely terms of trade disturbance in the external sector) on the goods and labor market linkages and its differential impact on rural (mainly agriculture) and urban (predominantly industry and services) Ethiopia. Using a CGE model with a dualistic economy (urban and rural sector labor forces) and real wage differentials, Gelan considers three simulations: a 50% nominal devaluation of the Ethiopian currency, a 50% reduction of imported tariffs, and a 50% reduction of export taxes. The results suggest that impacts of trade liberalization depend on wage-setting conditions in urban areas. With a fixed urban real wage, the trade reform adversely affects overall economic growth, while both rural and urban areas experience an expansion in Gross Domestic Product (GDP) with a flexible urban nominal wage. A nominal devaluation combined with a reduction in external trade tariffs would not enhance the structural transformation of the economy. The study concludes that the success of trade liberalization crucially depends on the extent that product and labor market reforms are synchronized.
Philip and Ferede (2005) analyze the possible impact of Ethiopia’s accession to the WTO at the macro-economic and sectoral levels. They used a dynamic Computable General Equilibrium (CGE) model to study the impact of a tariff dismantling policy (against products originating from trade partners) on the main fiscal, economic and social indicators. The analysis shows that tariff dismantling has both negative and positive effects on the economy. The main negative effect is a reduction of government fiscal revenues, while the likely positive effects include an increase in foreign investment and the stimulation of domestic demand that could result in greater economic growth due to an increase in household purchasing power. In the same year, a study by Geda and Shimeles (2005) explored the changes in tax structure over time and the distributional impacts of tax reform in Ethiopia. The results show that most commodity taxes (excise, import duty or sales tax) are progressive, but those on a few commodities–such as salt, sugar and kerosene – tend to be regressive.
In studies on other developing countries, the evidence is mixed. Bussolo and Lay (2003) assess the impact of the 1990s tariff cuts on poverty in Columbia. They find that the rise in unskilled wages as well as the movement of workers from the informal to the formal (higher-wage) sector in rural areas leads to a substantial reduction in rural poverty. The study attributes more than half of the national poverty reduction from 1988 to 1995 to the tariff reforms. Recent studies, however, suggest that trade liberalization may not necessarily lead to reduced poverty and inequality (Berloffa & Segnana 2006). For instance, Cororaton and Corong (2006), using a CGE micro-simulation model applied to the Philippines, demonstrated that both poverty gap and poverty severity could worsen due to trade liberalization, implying that the poorest of the poor could become even poorer.
Chan and Dung (2006) find that trade liberalization could be pro-rich due to a higher share of imported goods consumed by the rich. A study by Siddiqui (2007) finds that trade liberalization (along with a reduction in government expenditure) is not only pro-rich, but that it could also reduce the welfare of women, as compared to men, implying that trade liberalization may have differential impacts within households. A study by Chitiga et al. (2007) on Zimbabwe finds that, although there is no strong evidence that trade liberalization deepens poverty or vulnerability, there is no guarantee that the poor always benefit. The study concludes that trade policies may affect the poverty status of different households differently.
There is consensus that factor markets constitute the essential link between trade, trade policy and poverty for two reasons (Berloffa & Segnana 2006): 1) the “magnification effect,” which means changes in commodity prices due to trade liberalization magnify the resulting change in factor prices; and 2) households appear to be more specialized2 in factor markets than they are with respect to consumption behavior. The combination of complete reliance on one income source together with the magnification effect may, in turn, easily dominate the impact of changes in factor prices on the farm household.
This study contributes to the literature on poverty and trade in two ways. First, it uses representative households and price as a transmission mechanism to create a macro-micro linkage. Secondly, it categorizes households into three major groups in order to analyze the effect of trade liberalization on poverty at a disaggregated level. Finally, this research is timely for Ethiopia given that the country is undergoing trade negotiations, which motivated this research. Hence, understanding the implications of liberalized trade is important for policy-makers. Specifically, this study addresses the following research questions: (1) what are the impacts of unilateral trade liberalization on domestic production, trade, demand, and prices?; (2) what is the effect of trade liberalization on poverty at the national level?; and (3) how is the poverty situation of different household categories affected by trade liberalization?
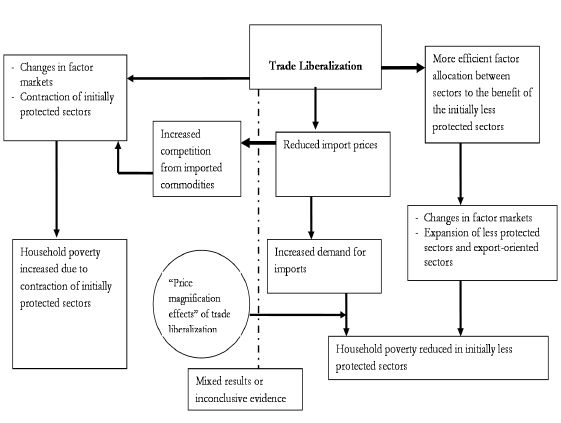
Based on the review of literature, we adopt a conceptual framework that links trade liberalization with growth and poverty. As indicated above, conventional literature suggests two potential ways through which trade liberalization can affect poverty in developing countries. The first way suggests that liberalization, through the expansion of economic sectors and through increased demand for imports, contributes to poverty reduction efforts in a reforming country. The alternative proposes that trade liberalization leads to increased poverty, as some sectors of the economy contract due to exposure to competition from imported commodities with reduced prices.
Drawing on insights from the more recent literature and on specific conditions of developing countries (such as Ethiopia); we propose that the short-run impacts of trade liberalization on poverty may depend on the existing conditions in the country. Developing economies, characterized by weak initial conditions and structural rigidities, may not exhibit significant positive short-run impacts of trade liberalization on poverty. Trade liberalization also may have differential impacts on different types of households (e.g. net buyers and net sellers), or on specific sectors of the economy. We take this as a third “path” as indicated by the dotted line in Figure 1.

A Synopsis of the effects of trade liberalization on poverty: A conceptual framework.
3. Trade and poverty in Ethiopia
3.1 Trade and trade reform in Ethiopia
Trade in Ethiopia is undergoing rapid change with increased exports both in terms of volume and type. As shown in Table 1, the total share of exports in GDP increased from 6.2% in 2003/04 to 17% in 2010/11 (MoFED 2010/11). Over the same period the total share of imports in GDP increased from 26.6% in 2003/04 to 34% in 2010/11. Overall, in 2010/11 the country had a negative trade balance of (-17%) of GDP.
Ethiopia exports raw materials and semi-processed products such as coffee, oilseeds and pulses, Khat,3 gold, hides and skins, leather and leather products, and live animals. The bulk of Ethiopia’s export earnings come from coffee, which accounted for 31.1% of total export value in 2010/11. It is followed by gold and oil seeds. A distinctive feature of Ethiopia’s exports is that, being mainly agricultural commodities, they are vulnerable to weather conditions and adverse terms-of-trade shocks. Moreover, the traditional way of producing exportable items negatively influences the quality of these commodities and, consequently, prices in international markets.
Components of external trade in Ethiopia (2003/04 – 2010/11).
| 2003/04 | 2004/05 | 2005/06 | 2008/09 | 2010/11 | |
|---|---|---|---|---|---|
| Exports (as % of GDP) | 6.2 | 7.6 | 7.7 | 4.6 | 17 |
| Imports (as % of GDP) | 26.6 | 32.5 | 33.9 | 24.5 | 34 |
| Trade balance (as % of GDP) | −20.4 | −24.9 | −26.2 | −19.9 | −17.0 |
| Major export items (Percentage of total value of exports) | |||||
| Coffee | 37.2 | 39.6 | 35.4 | 26.0 | 31.1 |
| Oilseeds | 13.8 | 14.8 | 21.1 | 24.6 | 12.1 |
| Leather and leather products | 7.3 | 8.0 | 7.5 | 5.2 | 3.8 |
| Pulses | 3.8 | 4.2 | 3.7 | 6.3 | 5.1 |
| Meat and meat products | 1.3 | 1.7 | 1.9 | 1.8 | 2.3 |
| Fruits and vegetables | 2.1 | 1.9 | 1.3 | 0.8 | 1.2 |
| Live animals | 0.3 | 1.5 | 2.8 | 3.6 | 5.5 |
| Khat | 14.7 | 11.8 | 8.9 | 9.6 | 8.8 |
| Gold | 8.1 | 7.0 | 6.5 | 6.8 | 15.4 |
| Flowers | 0.4 | 0.9 | 2.2 | 9.0 | 6.5 |
| Others | 11.1 | 8.6 | 8.8 | 6.3 | 8.0 |
| Major import items (by group) (Percentage of total value of imports) | |||||
| Raw materials | 1.0 | 1.4 | 1.8 | 4.6 | 2.2 |
| Semi-finished goods | 16.8 | 18.3 | 18.7 | 14.8 | 14.9 |
| Fuel | 12.0 | 18.4 | 14.9 | 16.3 | 20.1 |
| Capital goods | 33.9 | 33.0 | 33.2 | 32.0 | 33.4 |
| Consumer goods | 34.6 | 27.1 | 29.2 | 30.3 | 27.8 |
| Miscellaneous | 1.7 | 1.8 | 2.3 | 2.0 | 1.6 |
Ethiopia’s major imports include capital goods, such as machinery and equipment, intermediate goods for agriculture and industry, such as fertilizer and fuel, as well as food items, especially grains, and finished consumer goods. Capital goods account for one-third of the total import value, followed by consumer goods and fuel imports. Ethiopia has many trading partners. About 41.7% of Ethiopia’s exports go to Europe while the majority of Ethiopia’s imports come from Asia, accounting for 64.7% of total imports in 2008/09 (Table 2). China is Ethiopia’s main trade partner. About 51% of Ethiopia’s imports come from China and 34.4% of its exports go to China (NBE 2008/09). It is notable that all major trade partners of Ethiopia, except Somalia, are members of the WTO.
Trade partners of Ethiopia by region in 2005/06 – 2008/09.
| 2005/06 | 2008/09 | |||
|---|---|---|---|---|
| Export (percent share) | Import (percent share) | Export (percent share) | Import (percent share) | |
| Asia | 39.3 | 54.9 | 35.6 | 64.7 |
| Europe | 37.8 | 28.9 | 41.7 | 24.8 |
| Africa | 16.9 | 5.96 | 16.6 | 3.9 |
| America | 5.6 | 9.9 | 5.7 | 6.5 |
| Oceania | 0.36 | 0.20 | 0.4 | 0.10 |
Efforts to liberalize trade in Ethiopia started in 1992 with the re-structuring of the economy through the Structural Adjustment Programme (SAP). Through the SAP, Ethiopia has undertaken policy and institutional reforms including devaluation of the domestic currency (the birr) as well as reducing tariff and non-tariff barriers. Both tariff levels and tariff dispersion have been reduced significantly under the tariff reforms, with specific tariffs converted into ad-valorem taxation. By 2002, only 2.7% of the tariff lines had specific rates. The range of tariff rates narrowed from 0–240% before 1992 to 0–80% in 1995 and then to 0–35% in 2002 and the average tariff rate is 17.5% (Table 3). Revenue from trade taxes accounts for about 2.6% of GDP and 18.4% of total revenue. Quantitative import restrictions are applied only to used clothing, harmful drugs, and, for security reasons, armaments.
Trade tariffs and revenues in Ethiopia (%, 2004).
| Maximum tariff | 35 |
| Simple average tariff | 17.5 |
| Trade tax revenue/GDP | 2.6 |
| Trade tax revenue/Total revenue | 18.4 |
| Effective collected tariff rate | 13.7 |
-
Source: International Monetary Fund (IMF, 2004).
In particular, reforms undertaken in the agricultural sector include liberalization of both agricultural output and input markets, removal of substantial taxation on agriculture, removal of restrictions on private sector participation in grain movements and quota system of grain delivery, liberalization of fertilizer markets, and the creation of a multi-channel distribution system. In addition, unprofitable state farms were transferred on favorable terms to farmers operating in the area, to employees, or to private investors.
However, these reforms and various interventions did not increase per capita agricultural production as expected. The overall annual agricultural growth rate remained at only 3.4%, on average, between 1991/92 and 2004/05 (Yu et al. 2007). Moreover, government intervention in agriculture is still significant compared to other developing countries. For instance, land remains public property and the land market is limited; farm inputs, although liberalized, are supplied largely by non-private enterprises; and the prices of some food items are subsidized. World Bank (2004) argues that despite far-reaching reforms implemented by the government, both agriculture and manufacturing in Ethiopia are still protected.
The manufacturing sub-sector, the major branch in the industrial sector, is still trying to find its legs. The sub-sector plays a limited role in creating employment opportunities and contributes only about 15% to foreign exchange earnings, with no significant contribution to industrial value added (MoFED 2010/11). The low level of development of the manufacturing sub-sector is mainly due to its relatively high investment capital requirements, the use of out-dated technology, and the intensive use of imported inputs, which raises the cost of production (Enquobahrie 2004).
In terms of trade protection, the textile and leather manufacturing industries are the most protected. Imports on textile products generate the highest amount of duty, followed by duties on wheat and similar products. Vegetable products, iron/steel bars and vehicles follow at a distance. Among these products, only iron/steel bars and vehicles for public transport can be considered as intermediary products whose tariff reduction could stimulate economic activity (Phillip and Ferede2005). Looking at customs taxes, over the 1998 to 2004 period, there is no consistent trend (Table 4). While there was a significant increase in customs taxes between 2002 and 2003, it was reversed in 2004.
Evolution of customs tax collection (1997–2004).
| Customs taxes (annual percentage changes) | |||||||
|---|---|---|---|---|---|---|---|
| 1998 | 1999 | 2000 | 2001 | 2002 | 2003 | 2004 | |
| Duty tax | 74.97 | −24.92 | −12.08 | 51.73 | −9.51 | 51.79 | −7.54 |
| Excise tax | 215.4 | −41.11 | −19.34 | 59.92 | −37.67 | 120.01 | 12.61 |
| VAT* | − | − | − | − | − | 50.07 | −9.63 |
| Total | 95.00 | −28.65 | −13.46 | 53.18 | 56.70 | 56.03 | −6.36 |
-
VAT refers to Value Added Tax. VAT was introduced in Ethiopia as of January 1, 2003.
-
Source: Phillip and Ferede (2005).
3.2 Poverty in Ethiopia
The proportion of people in poverty in Ethiopia has declined, reflecting an improvement in poverty situation of the country over the years (Table 5). In 2010/2011, the headcount index was 29.6%; a decline of about 10 percentage points compared to 2004/05. Even though rural poverty is, in general, higher than urban poverty; the rural-urban poverty gap is narrowing over time.
Trends of poverty in Ethiopia (1995/96–2010/11).
| National | Rural | Urban | ||
|---|---|---|---|---|
| 1995/1996 | Head count (P0) | 0.455 | 0.475 | 0.332 |
| Depth of poverty (P1) | 0.129 | 0.134 | 0.099 | |
| Severity of poverty (P2) | 0.051 | 0.053 | 0.041 | |
| 1999/2000 | Head count (P0) | 0.442 | 0.454 | 0.369 |
| Depth of poverty (P1) | 0.119 | 0.122 | 0.101 | |
| Severity of poverty (P2) | 0.045 | 0.046 | 0.039 | |
| 2004/2005 | Head count (P0) | 0.387 | 0.393 | 0.351 |
| Depth of poverty (P1) | 0.083 | 0.085 | 0.077 | |
| Severity of poverty (P2) | 0.027 | 0.027 | 0.026 | |
| 2010/2011 | Head count (P0) | 0.296 | 0.304 | 0.257 |
| Depth of poverty (P1) | 0.078 | 0.080 | 0.069 | |
| Severity of poverty (P2) | 0.031 | 0.032 | 0.027 |
-
Source: MoFED (2012a).
Most of the reduction in poverty at the national level is attributed to reductions in rural poverty, which could be explained, in part, by favorable terms of trade for agriculture, increased delivery of public services, and improved infrastructure. The government allocated much of its resources to reducing structural bottlenecks in the economy by investing in basic economic welfare in rural areas.4 The size of the road network increased by 16%, an additional 6.6 million people had access to clean water, while both telephone and primary education coverage increased significantly.
However, it is important to consider the multidimensional nature of poverty and go beyond income and food provision. Poverty in Ethiopia includes many aspects, such as asset depletion, vulnerability, human capabilities, and lack of sustainable livelihoods. Even though improvements are being registered with respects to some indicators of welfare, a closer examination of the poverty situation in Ethiopia shows the prevalence of factors that contribute to the persistence of poverty. These factors include low agricultural production, limited non-farm income, inadequate education, poor health, high population growth, and weak institutional structures.
4. Methodology
4.1 Model description
Computable General Equilibrium (CGE) models are widely used to assess the impact of exogenous shocks and policy changes (such as trade liberalization policies, energy and environmental policies) on endogenous outcome variables (such as growth and poverty). Since CGE models are based on a well-developed neo-classical microeconomic theory, in reasonably simple models the effects that drive the results are known. In particular, CGE models specify the behavior of producers and consumers endogenously and, hence, they are suitable for the analysis of complex price-driven policies.
The model used in this study is based on the EXTER model (Decaluwé et al. 2001) and is calibrated to the 2001/02 Social Accounting Matrix (SAM) for Ethiopia constructed by the International Food Policy Research Institute (IFPRI). The SAM contains10 production sectors and 10 commodities (Table 6). The model uses 4 factors of production namely family labor, wage labor, capital and land. In the model, there is 1 enterprise account, 4 tax accounts (direct tax, indirect tax, import tax and export tax), and an investment-saving account.
Model sectors.
| Name used for sectors in GAMS code and reporting | Full description of Name |
|---|---|
| CROP | Crop farming |
| LIVE | Livestock |
| FOOD | Food processing |
| TELE | Textile and leather |
| OMAN | Other manufacturing |
| MICO | Mining and construction |
| UTLI | Utilities |
| TTCO | Trade, transport and communication |
| PADM | Public administration |
| OSER | Other services |
Production is based on a nested production technology. Factors of production and intermediate inputs are combined with a Leontief technology to constitute output. Value added, in turn, is a Constant Elasticity of Substitution (CES) function of labor and capital. Given the context of Ethiopia, we assume full mobility of labor across sectors in the model, while capital and land are sector specific.
Household consumption demand is specified by a Stone-Geary utility function. On the income side, households receive income from wages, distributed profits (dividend), subsidies (transfer), and remittances from abroad. Household savings are a fixed proportion of total income. The government receives income from taxes and has fixed expenditures. Total governmental expenditures for each good are fixed in real terms. Domestically-produced and imported commodities are combined to produce composite goods in accordance with the Armington hypothesis (Armington 1969), which is tantamount to assuming a degree of imperfect substitution between domestically produced and imported goods. A constant elasticity of transformation (CET) function is used to combine export and domestically consumed local commodities.
Assuming that the Ethiopian economy has no impact on international markets, the world prices of imports and exports are exogenous (small open economy hypothesis). The current account balance is assumed to be in equilibrium, with foreign savings equal to the current account deficit. We have chosen to make public savings exogenous so as to avoid analyzing the welfare impacts of government spending. In addition, total real investment is held fixed in the model and the producer price index is taken as the model’s numeraire.
There are of course, limitations with CGE models. The neo-classical assumptions of CGE models, such as perfect competition, are unrealistic and the role of money in the economy is missing in many models. In addition, these models require refined and enormous datasets and rely on elasticity that can be sometimes difficult to find and/or approximate. We attempt to overcome some of these limitations by using available data and taking elasticity calculated by Global Trade Analysis Project (GTAP) for Ethiopia to get an approximation. In addition, elasticity values, which are not included in the SAM, are taken from other published studies that analyze countries with an economy structure similar to that of Ethiopia. For example, some elasticity are taken from Annabi et al. (2005) who analyze the link between trade liberalization, growth and poverty in Senegal and Chitiga et al. (2007), who analyze impact of tariff removal on poverty in Zimbabwe. Given that both studies analyze similar topics with our study and the countries are found at more or less similar economic status, being a member of Sub-Saharan African countries, justifies the use of elasticities from these studies. Finally, we note that CGE models assume that equilibrium exists in the base year and compare the baseline with the results after some policy shock.
4.2 Liberalization scenario
We take two hypothetical scenarios to analyze the effects of trade liberalization on poverty. The first scenario is full liberalization, i.e. a 100% tariff removal on all imports. The second scenario is a more realistic uniform tariff scheme, where all tariffs are brought to the lowest non-zero tariff rate in Ethiopia (7.3%). For this study, we use direct taxes to compensate for the loss in government tariff revenue after liberalization. This is the general practice in public finance and reflects the fact that many countries increase direct taxation when removing import taxes. The compensatory tax is introduced in such a way that the decline in government revenue due to the tariff cut is fully compensated, while the same amount is deducted from household disposable income.
4.3 Microsimulation model
We link the macro-model to the micro-simulation model in a sequential fashion. The change in the import tariffs in both scenarios produce new simulation values for commodity prices, factor prices, and consumption levels in the CGE model. The simulated change in household consumption from the CGE model is used to adjust the final consumption of households and the simulated prices of each commodity are used to deflate nominal consumption. These are then used to produce poverty indices.
The 1999/2000 Household Income Consumption and Expenditure (HICE) survey, covering 17,332 households, is used. As is common practice in studies on developing countries, poverty is measured using consumption expenditure.5 We categorize households into farm households, wage earner households, and entrepreneur households. Farm households are those households who mainly reside in rural areas and whose main income is derived from agricultural activities. Wage earner households are households earning their income from wages. Entrepreneur households are those households residing in urban areas who earn their income from self-employed activities. The category of entrepreneur households does not include those engaged in the informal sector, but rather only those formally registered as self-employed. This is a limitation in that, although a significant part of the labor force in Ethiopia is engaged in the informal sector, there are no comprehensive data sources that provide information about it.
5. Discussion of results
First, we present some of the base year statistics, which provide the basis to understand the results. In the benchmark year (2001/02), agriculture made up 41% of total value-added in the Ethiopian economy (Table 7), consisting in subsistence and cash crops (21%) and livestock (20%). About 48% of the total value-added was generated by the service sector and 11% by the industrial sector.
Sectoral shares in 2001/02 (%).
| SECTOR | Gross output | Value-added (or GDP) at factor cost | Labour value-added at factor cost | Capital value-added at factor cost | Land value-added at factor cost | Import tariff |
|---|---|---|---|---|---|---|
| CROP | 14.16 | 21.00 | 23.45 | 3.36 | 76.68 | 0 |
| LIVE | 15.83 | 19.66 | 28.97 | 0.90 | 23.32 | 0 |
| Total Agriculture | 29.98 | 40.65 | 52.42 | 4.26 | 100.00 | |
| FOOD | 3.97 | 3.02 | 0.97 | 7.65 | 0.00 | 20.02 |
| TELE | 2.10 | 0.83 | 0.58 | 1.51 | 0.00 | 32.57 |
| OMAN | 3.83 | 1.78 | 0.77 | 4.15 | 0.00 | 7.32 |
| MICO | 9.05 | 5.33 | 1.97 | 13.04 | 0.00 | 0 |
| Total Industry | 18.95 | 10.97 | 4.29 | 26.35 | 0.00 | |
| UTLI | 1.91 | 2.41 | 1.42 | 4.86 | 0.00 | 0 |
| TTCO | 27.01 | 17.86 | 10.29 | 36.54 | 0.00 | 0 |
| PADM | 7.75 | 10.86 | 17.82 | 0.00 | 0.00 | 0 |
| OSER | 14.40 | 17.26 | 13.76 | 27.98 | 0.00 | 0 |
| Total Services | 51.07 | 48.38 | 43.29 | 69.39 | 0.00 | |
| TOTAL | 100.00 | 100.00 | 100.00 | 100.00 | 100.00 | 7.64 |
-
Source: Computed from the 2001/02 Ethiopian SAM.
The sectors subject to import tariffs are food processing (FOOD), textile and leather (TELE), and other manufacturing (OMAN). We expect the tariff reduction and/or removal to directly affect these sectors by the fall in price of imports. Looking at the sectoral shares of imports and exports in total output at the base year is crucial to understand the likely effect of tariff cut on these sectors (Table 1). Cash crops such as coffee, Khat, pulses and oil seeds; textile and leather; and mining exhibit high export to output ratio. For instance, coffee alone accounts for about two-thirds of total exports. Other primary exports include minerals. This confirms that primary products dominate export earnings in Ethiopia. Trade, transport and communication are also other sources of export earnings, with Ethiopian airlines dominating the transport export. Regarding imports, textile, leather, and other manufacturing have relatively higher imported input to total input use ratio. For example, in 2010, the ratio of imported inputs to total input used was 51% for manufacturing sector (CSA, 2011), which shows a relatively high degree of import dependence of the sector.
5.1 Sectoral and macro outcomes
Results on the sectoral and macro outcomes of the two scenarios are presented in Table 8. As expected, imports increase for sectors with initially higher tariff rates. The increase in the volume of imports can be explained in terms of a fall in import prices following a policy of tariff reduction or elimination. In particular, a 100% tariff cut is likely to lead to a substantial reduction in prices of imports of textiles, leather, processed food, and beverages. Sectors such as textile and leather and food processing had previously high protection. After the full tariff removal, imports of textile and leather increase by 20.9% and food processing imports increase by 8.31%. For the uniform tariff scheme, imports of these sectors also increase, although at a lower rate (17.8% for the textile and leather and by 6.21% for food processing). Imports of the sub-sector ‘other manufacturing’ increase only slightly in the complete tariff removal scenario, while it decreases for the uniform tariff scheme scenario, in both cases; the change is by less than 1%.
Volume changes due to trade liberalization.
| 100 % tariff cut | Uniform tariff scheme | ||||||||
|---|---|---|---|---|---|---|---|---|---|
| Sectors | tm | ΔMi | ΔEXi | ΔXSi | ΔDi | ΔMi | ΔEXi | ΔXSi | ΔDi |
| CROP | 0 | −10.77 | 5.56 | 0.84 | −0.29 | −4.9 | 2.4 | 0.34 | −0.14 |
| LIVE | 0 | −10.93 | 4.79 | −1.31 | −1.1 | −5.12 | 2.22 | −0.52 | −0.43 |
| FOOD | 20.02 | 8.31 | 7.41 | −2.2 | −2.52 | 6.21 | 3.78 | −1.49 | −1.66 |
| TELE | 32.57 | 20.96 | 2.28 | −6.63 | −8.96 | 17.86 | −0.03 | −5.87 | −7.37 |
| OMAN | 7.32 | 0.17 | 3.8 | −0.61 | −1.47 | −0.86 | 0.97 | 0.61 | 0.54 |
| MICO | 0 | 0 | 4.51 | −0.17 | −0.41 | 0 | 1.27 | 0.23 | 0.17 |
| UTLI | 0 | 0 | 0 | −1.11 | −1.11 | 0 | 0 | −0.68 | −0.68 |
| TTCO | 0 | −5.98 | 3.52 | 0.68 | 0.37 | −2.6 | 1.45 | 0.25 | 0.12 |
| PADM | 0 | 0 | 0 | −0.02 | −0.02 | 0 | 0 | 0 | 0 |
| OSER | 0 | −6.84 | 4.08 | 0.62 | 0.46 | −3.3 | 2 | 0.37 | 0.3 |
| ALL* | 7.64 | −0.08 | 4.3 | −0.1 | −0.46 | −0.1 | 1.7 | −0.07 | −0.22 |
-
Where: tm is import tariff, M is import, EX is export, XS is sectoral output, D is demanded commodity.
-
*
Average variation for volumes - Laspeyres index variation for prices.
Trade liberalization is found to have a strong and adverse effect on agriculture-based domestic manufacturing industries. A major effect of a uniform tariff scheme scenario is an increase in imports of textile and leather goods, while exports of these sectors are little affected by liberalization (Table 8). The complete elimination of tariffs results in slightly greater imports of manufactured goods than under a uniform tariff rate. Given the fact that textile and leather industry originally experienced a high level of protection (32.5% tariff rate), this result is expected.
Competition from less expensive and, perhaps, better-quality imports, is likely to lead to reduced demand for domestic goods and, consequently, may result in shrinking of domestic manufacturing and subsequent reductions in labor employment. Both scenarios generate a reduction in demand for domestic goods (Table 8); although the magnitudes of changes in quantity demanded remain very small. In addition, domestic manufacturing industries, which are already subject to supply-side constraints, are incapable of taking advantage of cost reductions, despite the fact that imported raw materials and intermediate goods are less expensive.
Trade liberalization leads to an increase in exports of domestic manufacturing industries such as textile, leather, food, and beverage products. However, the magnitude of change in exports is much lower than that of imports (comparing ΔMi and ΔEXi). On the other hand, the results suggest that imports of agricultural commodities decline in both scenarios, while agricultural exports increase.
Output increases in the crop sector, as the demand for its export increases (Table 8). In contrast, output from agro-processing declines, as competition from international goods becomes stiff and labor migrates to other sectors. This is particularly true for agro-processing industries, as they are forced to lay-off workers due to lack of market/reduced demand for products. The overall output in the economy also declines slightly in both scenarios (last row of Table 8). Generally, demand declines for most commodities due to reduced demand for domestically produced materials, such as textile and leather. There is also reduced demand for other agricultural commodities within the farming and livestock sectors.
As explained above, import prices fall significantly, especially for those commodities with high initial import tariffs, which in turn affects other prices due to inter-linkages in the economy. These changes in prices, directly due to import tariff reduction/removal or indirectly due to inter-linkages in the economy, ultimately determine the poverty outcome of the policy shock. Changes in consumer prices, total consumption and equivalent variations are presented in Table 9, disaggregated by the different household groups included in the model. Farm households, which represent more than 80% of the Ethiopian population, face a decline in consumption under both scenarios, while consumption of wage earners and entrepreneur households increases slightly. This is due to the varying degree of reliance of the different household groups on the various sectors. At the same time, the simulation results show that consumer prices increase for all household categories. Notably, the increase in the consumer prices is greater than that of nominal income, which implies that real consumption and welfare (as measured by equivalent variations) decline for all household groups. However, the welfare of farm households (which mainly rely on agricultural commodities) deteriorates more than that of wage earners and entrepreneurs (Table 9).
Changes in consumer price, total consumption and equivalent variation by household group.
| 100% tariff cut | Uniform tariff scheme | |||||||
|---|---|---|---|---|---|---|---|---|
| FHH | WHH | EHH | All | FHH | WHH | EHH | All | |
| Change in total consumption | −0.62 | 0.7 | 0.17 | −0.07 | −0.16 | 0.21 | 0.03 | −0.01 |
| Change in household consumer price | 0.72 | 0.92 | 0.34 | 1.85 | 0.36 | 0.32 | 0.04 | 1.38 |
| Equivalent variation | −1.23 | −0.18 | −0.14 | −0.7 | −0.48 | −0.1 | 0 | −0.27 |
-
Where: FHH is farm households, EHH is entrepreneur households, WHH is wage earner households.
5.2 Poverty measurement and results
To measure poverty, we use aggregate consumption expenditure at the household level deflated by prices from the CGE model and adult equivalence scales to adjust for differences in household composition. Real consumption expenditure per adult equivalent is used to compare households with the threshold poverty line.
The Foster-Greer-Thorbecke (FGT) class of poverty decomposition (FGT 1984) is used to estimate poverty indices as:
Where Pα is a measure of poverty, z is the poverty line (in terms of consumption expenditure or income), n is total population, q is total number of poor households, and Y is the total consumption expenditure. The poverty index, Pα changes when α takes different values. When α is 0, 1, and 2; Pα equals the head count index (P0), the poverty gap index (P1), and the poverty severity measure (P2), respectively. The national poverty line (1,075 Ethiopian birr6) calculated by MoFED (2012), using the 1995/96 base year, is used as a threshold in the analysis. We compute the poverty indices using the software DAD (Duclos et al. 2002).
For all household categories, poverty shows a slight increase in both trade liberalization scenarios (Tables 10 and 11). At the national level, a 100% tariff cut results in an increase in the poverty headcount of 2.8%, while a uniform tariff scheme increases the poverty headcount by 2.3%. By the same token, the poverty gap and poverty severity indices increase at the national level.
Comparing poverty increases across household categories in both scenarios, we find that poverty in entrepreneur households increases most. In both scenarios, poverty increases more among entrepreneur households (3.2% in the uniform tariff cut scenario), than farm and wage earner households (0.9 and 1.5%, respectively). This result is also confirmed by the poverty gap and poverty severity indices.
Poverty results of 100% tariff cut by household group.
| Base (1) | 100% tariff cut (2) | Variation (percentage change from base) (b/n 2 & 1) | ||
|---|---|---|---|---|
| Poverty head count index (α = 0) | All | 0.561 (0.0061) | 0.589 (0.0060) | 2.8 |
| FHH | 0.597 (0.0070) | 0.614 (0.0069) | 1.7 | |
| EHH | 0.263 (0.0134) | 0.295 (0.0138) | 3.2 | |
| WHH | 0.383 (0.0098) | 0.398 0.0098) | 1.5 | |
| Poverty gap (α = 1) | All | 0.169 (0.0024) | 0.182 (0.0025) | 1.3 |
| FHH | 0.181 (0.0028) | 0.189 (0.0029) | 0.8 | |
| EHH | 0.073 (0.0047) | 0.085 (0.0050) | 1.2 | |
| WHH | 0.11 (0.0036) | 0.117 (0.0037) | 0.7 | |
| Poverty severity (α = 2) | All | 0.069 (0.0013) | 0.076 (0.0014) | 0.7 |
| FHH | 0.074 (0.0015) | 0.078 (0.0016) | 0.4 | |
| EHH | 0.029 (0.0023) | 0.034 (0.0026) | 0.5 | |
| WHH | 0.043 (0.0018) | 0.047 (0.0019) | 0.4 |
-
Note: The figures in parentheses are standard deviations.
-
Where: FHH is farm households, EHH is entrepreneur households, WHH is wage earner households
Poverty results of uniform tariff scheme by household group.
| Base (1) | Uniform tariff Scheme (2) | Variation (percentage Change from base) (b/n 2 & 1) | ||
|---|---|---|---|---|
| Poverty head count index (α = 0) | All | 0.561 (0.0061) | 0.584 (0.0060) | 2.3 |
| FHH | 0.597 (0.0070) | 0.606 (0.0069) | 0.9 | |
| EHH | 0.263 (0.0134) | 0.295 (0.0138) | 3.2 | |
| WHH | 0.383 (0.0098) | 0.398 0.0098) | 1.5 | |
| Poverty gap (α = 1) | All | 0.169 (0.0024) | 0.18 (0.0025) | 1.1 |
| FHH | 0.181 (0.0028) | 0.185 (0.0029) | 0.4 | |
| EHH | 0.073 (0.0047) | 0.085 (0.0050) | 1.2 | |
| WHH | 0.11 (0.0036) | 0.117 (0.0037) | 0.7 | |
| Poverty severity (α = 2) | All | 0.069 (0.0013) | 0.075 (0.0014) | 0.6 |
| FHH | 0.074 (0.0015) | 0.076 (0.0016) | 0.2 | |
| EHH | 0.029 (0.0023) | 0.034 (0.0026) | 0.5 | |
| WHH | 0.043 (0.0018) | 0.047 (0.0019) | 0.4 |
-
Note: The figures in parentheses are standard deviations.
-
Where: FHH is farm households, EHH is entrepreneur households, WHH is wage earner households.
This is consistent with the theoretical argument that previously-protected infant industries are more affected by trade liberalization and, hence, entrepreneur households suffer a greater welfare loss. Furthermore, trade liberalization reduces the demand for both locally produced textile/leather and food/beverage goods, thus shrinking the demand for labor in these industries, while having only a limited impact on the other manufacturing sectors and on the agricultural sector. This implies that, in the short run, trade liberalization has an adverse net effect on the macro-economy and welfare of households. This is especially true in a developing economy like Ethiopia, which is predominantly characterized by subsistence production, a weak and small industrial sector, weak inter-sectoral links, and high transaction costs. Moreover, inability of the agricultural sector (which employs about 85% of the country’s population) to take advantage of trade opportunities contributes to these adverse poverty effects.
6. Conclusions
Liberalization of Ethiopia’s major manufacturing sectors – namely textile, leather, food and beverage (which are protected with import tariffs) – results in increased flows of relatively less expensive competing imports and reduces demand for domestic goods. Marginal increases in exports of manufactured goods do not offset these adverse effects. We also find that trade liberalization is likely to contribute to a decline in domestic production (for both exports and domestic consumption) of agro-industries, including textile, leather, and processed food.
We find that entrepreneur households are the most disadvantaged in terms of changes in poverty status following trade liberalization. We also find that wage-earning households in small industries are likely to suffer from welfare loss (due to a contraction of these industries), while better-off urban consumers are likely to benefit from the less expensive imports. Suppliers of raw materials for agriculture-based manufacturing industries are likely to suffer from income loss, as these industries tend to shrink following trade liberalization. The remaining household categories, including the majority of the rural households, are likely to be little affected by liberalization.
Our results are in line with previous findings that the effects of liberalization are not uniform across different types of households (Chitiga et al. 2007). However, it is notable that greater disaggregation of households (for instance into net sellers and net buyers of food) is an issue for further investigation. In addition, the prevalence of structural rigidities in an economy is likely to dampen the effects of price-based reforms (such as trade liberalization) and to limit the use of standard economy-wide models (such as conventional CGE) in explaining the impact of unilateral trade liberalization on poverty in developing countries. The use of more structuralist CGE models to study the economies of developing countries with structural rigidities and institutional constraints is one possible path for further research.
Given that Ethiopia is currently engaged in negotiations to accede to the WTO, as well as the ongoing European Union-African Caribbean Pacific (EU-ACP) regional trade agreements, studying the likely impacts of these trade agreements on the macro economy, in general, and on welfare, in particular, is of paramount importance. Our findings suggest that carefully-designed compensatory mechanisms are important to protect entrepreneur households, which are likely to suffer most from trade liberalization.
Ethiopia’s trade relations with regional blocks and other emerging economies may change radically in the near future. China has become a critical trade partner for Ethiopia. Moreover, Ethiopia is negotiating trade arrangements with the Common Market for East and Southern Africa (CoMESA), the European Union, and with the member states of the Sana Forum for Cooperation (namely Yemen, Sudan, and Somalia).Given the likelihood that these negotiations are likely to be successful, continued investigation is needed on how multilateral regional trade agreements may affect the welfare of different groups of households.
Footnotes
1.
Some studies (e.g. Manson et al. 2007) suggest that it is the more capital-intensive sectors that are likely to benefit most from trade liberalization.
2.
According to Berloffa and Segnana (2006), rural households can be stratified into five categories based on their income specialization (where the primary source of income accounts for 95% of total household income). These include 1) agriculture (specialized households where the poor are over-represented); 2) non-agricultural business (self-employment in non-agriculture); 3) labor (households in wage- and salary-earning categories); 4) diversified income type; and 5) transfer-payment-specialized households.
3.
Khat contains the alkaloid called cathinone, an amphetamine-like stimulant that cause excitement, loss of appetite and euphoria. While it is legal in Ethiopia, in some jurisdictions it is a controlled substance. Source: MoFED (2010/11)
4.
This is shown in the improvements registered in human development indicators such as life expectancy and mortality. Life expectancy at birth increased to 59 years in 2011 from 52 years in 2000. In addition, infant mortality declined from 86 to 52 in 1000 live births between 2000 and 2011. Child mortality rates declined from 139 to 77 in 1000 live births from 2000 to 2011 (World Bank 2013).
5.
Consumption is used as a measure of poverty instead of income because households in developing countries have a tendency to under report or misreport it. For instance, in the 1999/2000 HICE survey, 70% of the sampled households reported that their income level was less than their expenditure, while only 9.3% of households reported that their income was greater than their expenditure (CSA 2001). In addition, consumption directly measures the instantaneous utility obtained from consuming and reveals information about incomes at other dates (past and future), which makes it a good indicator of average well-being
6.
1,075 birr (ETB) is approximately 59 USD, using the December 4, 2012, exchange rate.
References
-
1
Trade Liberalization, Growth and poverty in Senegal: A Dynamic Micro simulation CGE Model Analysis’. CEPII No 2005–07et al, Trade Liberalization, Growth and poverty in Senegal: A Dynamic Micro simulation CGE Model Analysis’. CEPII No 2005–07, May.
-
2
A theory of demand for products distinguished by place of production’. IMF Staff Papers159–178, A theory of demand for products distinguished by place of production’. IMF Staff Papers, 16.
-
3
Trade, Growth, and Poverty: A Selective Survey. IMF Working Paper 03/30Trade, Growth, and Poverty: A Selective Survey. IMF Working Paper 03/30.
-
4
Economic Growth and Distribution: on the Nature and Causes of the Wealth of NationsTrade, Poverty and Two Perspectives one Message, Economic Growth and Distribution: on the Nature and Causes of the Wealth of Nations, Edward Elgar Publishers.
-
5
Globalization and poverty changes in Colombiapaper presented at the World Bank ABCDE Conference.
-
6
The impact of trade liberalization on household welfare in Vietnam. MPIA working paper 2006-02Partnership and Economic Policy (PEP).
-
7
The impact of tariff removal on poverty in Zimbabwe: A computable general equilibrium MicrosimulationThe Journal of Development Studies 43:1105–1125.
-
8
Agriculture-sector policies and poverty in the Philippines: A computable general-equilibrium (CGE) analysis. MPIA working Paper 2006-09Partnership and Economic Policy (PEP).
-
9
258 Statistical BulletinReport on the 1999/2000 Household Income, Consumption and Expenditure Survey, 258 Statistical Bulletin, Addis Ababa, Ethiopia.
-
10
Report on Large and Medium Scale Manufacturing and Electricity Industries SurveyEthiopia: Addis Ababa.
-
11
La Politique Economique du Developement et les Modeles d’Equilibre General CalculableMontreal, Canada: Les Presses de l’Universite de Montreal.
-
12
Socially-Efficient Tax Reforms, Cahier De Recherche 02-01Département d’économique, Université de Sherbrooke.
-
13
Understanding Poverty: The Ethiopian Contextpaper presented at The Gambia AAPAM Roundtable Conference.
-
14
Notes and comments: a class of decomposable poverty measuresEconometrica 52:761–766.
-
15
Differential impacts of trade liberalization on Indonesia’s poor and non-poorpaper presented at the ‘Conference on poverty and the international economy.
-
16
Taxes and tax reform in Ethiopia, 1990-2003, World Institute for Development Economics Research. Research Paper No. 2005/65Taxes and tax reform in Ethiopia, 1990-2003, World Institute for Development Economics Research. Research Paper No. 2005/65, UNU, .
-
17
Trade liberalization and urban-rural linkages: a CGE analysis for EthiopiaJournal of Policy Modeling 24 pp. 707–738.
-
18
From market liberalization to market development: the need for market institutions in EthiopiaEconomic Systems 32:239–252.
-
19
The earnings effects of multilateral trade liberalization: implications for povertyWorld Bank Economic Review 18:205–236.
-
20
‘Predicting the Policy Impacts of Trade Reform’. World Bank Policy Research Working Paper 3444‘Predicting the Policy Impacts of Trade Reform’. World Bank Policy Research Working Paper 3444.
- 21
-
22
‘Poverty and Inequality Impacts of Trade Policy Reforms in South Africa’. MPIA Working Paper 2007-19Partnership and Economic Policy (PEP).
-
23
‘The impacts of trade liberalization on poverty in Nigeria: dynamic simulations in a CGE model’. Working Paper 2007-16Partnership for Economic Policy (PEP).
-
24
Macroeconomic developments in Ethiopia. Annual ReportsMinistry of Finance and Economic Development, Federal Democratic Republic of Ethiopia.
-
25
Ethiopia’s progress toward eradicating poverty: an interim report on poverty analysis study (2011/2012)Accessed August 12, 2012.
-
26
Developments in the External Sector. Annual ReportDevelopments in the External Sector. Annual Report.
-
27
Quantitative Impact Assessment of Trade LiberalizationA research report prepared for the Ministry of Trade and Industry.
-
28
Gainers and losers from trade reform in MoroccoMimeo, paper presented at the Seventh Annual Conference on Global Economic Analysis.
-
29
Examining the social impact of the Indonesian financial Crisis using a Micro-Macro Modelpaper presented at ABCDE-Europe, Effects of Globalization factors on poverty and inequality in National Economies.
-
30
Modelling gender Dimensions of the Impact of Economic Reforms in Pakistan. MPIA Working Paper 2007-13Partnership and Economic Policy (PEP).
-
31
The impact of devaluation on Macroeconomic performance: the case of EthiopiaJournal of Policy Modeling 21:481–496.
-
32
Trade flows, relative prices, and effective exchange rates: a VAR on Ethiopian dataApplied Economics 23:1369–1376.
- 33
-
34
Ethiopia: Trade and Transformation, Diagnostic trade Integration StudyEthiopia: Trade and Transformation, Diagnostic trade Integration Study, 2, Washington, D.C..
- 35
-
36
Accessions: EthiopiaAccessed August 12, 2012.
-
37
An Overview of the Performance of Ethiopian Economypaper presented in the 10th Annual Agricultural Economics.
Article and author information
Author details
Acknowledgements
This work was carried out with financial and scientific support from the Partnership for Economic Policy (PEP), with funding from the Department for International Development (DFID) of the United Kingdom (or UK Aid), and the Government of Canada through the International Development Research Center (IDRC).We are grateful to Bernard Decaluwe, Ismael Fofana and John Cockburn for their technical support. This paper has also benefited from useful comments by Ayele Gelan, Alemayehu Seyoum, Kassu Wamisho, Alemayehu Geda, Tadelle Ferede, Abi Kedir, Sherman Robinson, and Jorgen Levin. The authors would like to thank the International Food Policy Research Institute (IFPRI) for making the SAM available to this research work. Any errors remain our own.
Publication history
- Version of Record published: April 30, 2016 (version 1)
Copyright
© 2016, Sindu W. et al.
This article is distributed under the terms of the Creative Commons Attribution License, which permits unrestricted use and redistribution provided that the original author and source are credited.