Impact of trade liberalization on poverty in Ethiopia: A computable general equilibrium microsimulation
- Humboldt University of Berlin, Faculty of Agriculture and Horticulture Invalidenstr, Germany
- BDS-Center for Development Research (BDS-CDR), Ethiopiae
- Addis Ababa University, Ethiopia
- Article
- Figures and data
- Jump to
Figures

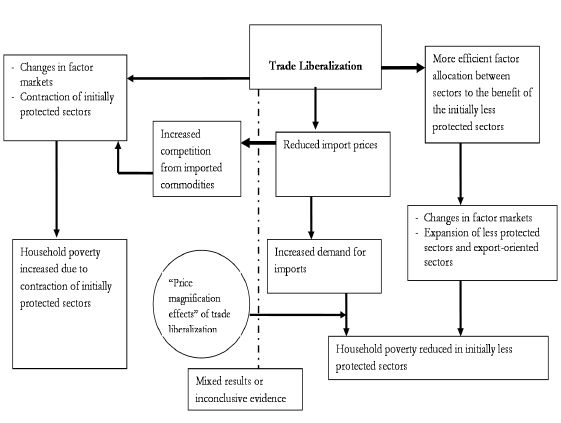
A Synopsis of the effects of trade liberalization on poverty: A conceptual framework.
Tables
Components of external trade in Ethiopia (2003/04 – 2010/11).
| 2003/04 | 2004/05 | 2005/06 | 2008/09 | 2010/11 | |
|---|---|---|---|---|---|
| Exports (as % of GDP) | 6.2 | 7.6 | 7.7 | 4.6 | 17 |
| Imports (as % of GDP) | 26.6 | 32.5 | 33.9 | 24.5 | 34 |
| Trade balance (as % of GDP) | −20.4 | −24.9 | −26.2 | −19.9 | −17.0 |
| Major export items (Percentage of total value of exports) | |||||
| Coffee | 37.2 | 39.6 | 35.4 | 26.0 | 31.1 |
| Oilseeds | 13.8 | 14.8 | 21.1 | 24.6 | 12.1 |
| Leather and leather products | 7.3 | 8.0 | 7.5 | 5.2 | 3.8 |
| Pulses | 3.8 | 4.2 | 3.7 | 6.3 | 5.1 |
| Meat and meat products | 1.3 | 1.7 | 1.9 | 1.8 | 2.3 |
| Fruits and vegetables | 2.1 | 1.9 | 1.3 | 0.8 | 1.2 |
| Live animals | 0.3 | 1.5 | 2.8 | 3.6 | 5.5 |
| Khat | 14.7 | 11.8 | 8.9 | 9.6 | 8.8 |
| Gold | 8.1 | 7.0 | 6.5 | 6.8 | 15.4 |
| Flowers | 0.4 | 0.9 | 2.2 | 9.0 | 6.5 |
| Others | 11.1 | 8.6 | 8.8 | 6.3 | 8.0 |
| Major import items (by group) (Percentage of total value of imports) | |||||
| Raw materials | 1.0 | 1.4 | 1.8 | 4.6 | 2.2 |
| Semi-finished goods | 16.8 | 18.3 | 18.7 | 14.8 | 14.9 |
| Fuel | 12.0 | 18.4 | 14.9 | 16.3 | 20.1 |
| Capital goods | 33.9 | 33.0 | 33.2 | 32.0 | 33.4 |
| Consumer goods | 34.6 | 27.1 | 29.2 | 30.3 | 27.8 |
| Miscellaneous | 1.7 | 1.8 | 2.3 | 2.0 | 1.6 |
Trade partners of Ethiopia by region in 2005/06 – 2008/09.
| 2005/06 | 2008/09 | |||
|---|---|---|---|---|
| Export (percent share) | Import (percent share) | Export (percent share) | Import (percent share) | |
| Asia | 39.3 | 54.9 | 35.6 | 64.7 |
| Europe | 37.8 | 28.9 | 41.7 | 24.8 |
| Africa | 16.9 | 5.96 | 16.6 | 3.9 |
| America | 5.6 | 9.9 | 5.7 | 6.5 |
| Oceania | 0.36 | 0.20 | 0.4 | 0.10 |
Trade tariffs and revenues in Ethiopia (%, 2004).
| Maximum tariff | 35 |
| Simple average tariff | 17.5 |
| Trade tax revenue/GDP | 2.6 |
| Trade tax revenue/Total revenue | 18.4 |
| Effective collected tariff rate | 13.7 |
-
Source: International Monetary Fund (IMF, 2004).
Evolution of customs tax collection (1997–2004).
| Customs taxes (annual percentage changes) | |||||||
|---|---|---|---|---|---|---|---|
| 1998 | 1999 | 2000 | 2001 | 2002 | 2003 | 2004 | |
| Duty tax | 74.97 | −24.92 | −12.08 | 51.73 | −9.51 | 51.79 | −7.54 |
| Excise tax | 215.4 | −41.11 | −19.34 | 59.92 | −37.67 | 120.01 | 12.61 |
| VAT* | − | − | − | − | − | 50.07 | −9.63 |
| Total | 95.00 | −28.65 | −13.46 | 53.18 | 56.70 | 56.03 | −6.36 |
-
VAT refers to Value Added Tax. VAT was introduced in Ethiopia as of January 1, 2003.
-
Source: Phillip and Ferede (2005).
Trends of poverty in Ethiopia (1995/96–2010/11).
| National | Rural | Urban | ||
|---|---|---|---|---|
| 1995/1996 | Head count (P0) | 0.455 | 0.475 | 0.332 |
| Depth of poverty (P1) | 0.129 | 0.134 | 0.099 | |
| Severity of poverty (P2) | 0.051 | 0.053 | 0.041 | |
| 1999/2000 | Head count (P0) | 0.442 | 0.454 | 0.369 |
| Depth of poverty (P1) | 0.119 | 0.122 | 0.101 | |
| Severity of poverty (P2) | 0.045 | 0.046 | 0.039 | |
| 2004/2005 | Head count (P0) | 0.387 | 0.393 | 0.351 |
| Depth of poverty (P1) | 0.083 | 0.085 | 0.077 | |
| Severity of poverty (P2) | 0.027 | 0.027 | 0.026 | |
| 2010/2011 | Head count (P0) | 0.296 | 0.304 | 0.257 |
| Depth of poverty (P1) | 0.078 | 0.080 | 0.069 | |
| Severity of poverty (P2) | 0.031 | 0.032 | 0.027 |
-
Source: MoFED (2012a).
Model sectors.
| Name used for sectors in GAMS code and reporting | Full description of Name |
|---|---|
| CROP | Crop farming |
| LIVE | Livestock |
| FOOD | Food processing |
| TELE | Textile and leather |
| OMAN | Other manufacturing |
| MICO | Mining and construction |
| UTLI | Utilities |
| TTCO | Trade, transport and communication |
| PADM | Public administration |
| OSER | Other services |
Sectoral shares in 2001/02 (%).
| SECTOR | Gross output | Value-added (or GDP) at factor cost | Labour value-added at factor cost | Capital value-added at factor cost | Land value-added at factor cost | Import tariff |
|---|---|---|---|---|---|---|
| CROP | 14.16 | 21.00 | 23.45 | 3.36 | 76.68 | 0 |
| LIVE | 15.83 | 19.66 | 28.97 | 0.90 | 23.32 | 0 |
| Total Agriculture | 29.98 | 40.65 | 52.42 | 4.26 | 100.00 | |
| FOOD | 3.97 | 3.02 | 0.97 | 7.65 | 0.00 | 20.02 |
| TELE | 2.10 | 0.83 | 0.58 | 1.51 | 0.00 | 32.57 |
| OMAN | 3.83 | 1.78 | 0.77 | 4.15 | 0.00 | 7.32 |
| MICO | 9.05 | 5.33 | 1.97 | 13.04 | 0.00 | 0 |
| Total Industry | 18.95 | 10.97 | 4.29 | 26.35 | 0.00 | |
| UTLI | 1.91 | 2.41 | 1.42 | 4.86 | 0.00 | 0 |
| TTCO | 27.01 | 17.86 | 10.29 | 36.54 | 0.00 | 0 |
| PADM | 7.75 | 10.86 | 17.82 | 0.00 | 0.00 | 0 |
| OSER | 14.40 | 17.26 | 13.76 | 27.98 | 0.00 | 0 |
| Total Services | 51.07 | 48.38 | 43.29 | 69.39 | 0.00 | |
| TOTAL | 100.00 | 100.00 | 100.00 | 100.00 | 100.00 | 7.64 |
-
Source: Computed from the 2001/02 Ethiopian SAM.
Volume changes due to trade liberalization.
| 100 % tariff cut | Uniform tariff scheme | ||||||||
|---|---|---|---|---|---|---|---|---|---|
| Sectors | tm | ΔMi | ΔEXi | ΔXSi | ΔDi | ΔMi | ΔEXi | ΔXSi | ΔDi |
| CROP | 0 | −10.77 | 5.56 | 0.84 | −0.29 | −4.9 | 2.4 | 0.34 | −0.14 |
| LIVE | 0 | −10.93 | 4.79 | −1.31 | −1.1 | −5.12 | 2.22 | −0.52 | −0.43 |
| FOOD | 20.02 | 8.31 | 7.41 | −2.2 | −2.52 | 6.21 | 3.78 | −1.49 | −1.66 |
| TELE | 32.57 | 20.96 | 2.28 | −6.63 | −8.96 | 17.86 | −0.03 | −5.87 | −7.37 |
| OMAN | 7.32 | 0.17 | 3.8 | −0.61 | −1.47 | −0.86 | 0.97 | 0.61 | 0.54 |
| MICO | 0 | 0 | 4.51 | −0.17 | −0.41 | 0 | 1.27 | 0.23 | 0.17 |
| UTLI | 0 | 0 | 0 | −1.11 | −1.11 | 0 | 0 | −0.68 | −0.68 |
| TTCO | 0 | −5.98 | 3.52 | 0.68 | 0.37 | −2.6 | 1.45 | 0.25 | 0.12 |
| PADM | 0 | 0 | 0 | −0.02 | −0.02 | 0 | 0 | 0 | 0 |
| OSER | 0 | −6.84 | 4.08 | 0.62 | 0.46 | −3.3 | 2 | 0.37 | 0.3 |
| ALL* | 7.64 | −0.08 | 4.3 | −0.1 | −0.46 | −0.1 | 1.7 | −0.07 | −0.22 |
-
Where: tm is import tariff, M is import, EX is export, XS is sectoral output, D is demanded commodity.
-
*
Average variation for volumes - Laspeyres index variation for prices.
Changes in consumer price, total consumption and equivalent variation by household group.
| 100% tariff cut | Uniform tariff scheme | |||||||
|---|---|---|---|---|---|---|---|---|
| FHH | WHH | EHH | All | FHH | WHH | EHH | All | |
| Change in total consumption | −0.62 | 0.7 | 0.17 | −0.07 | −0.16 | 0.21 | 0.03 | −0.01 |
| Change in household consumer price | 0.72 | 0.92 | 0.34 | 1.85 | 0.36 | 0.32 | 0.04 | 1.38 |
| Equivalent variation | −1.23 | −0.18 | −0.14 | −0.7 | −0.48 | −0.1 | 0 | −0.27 |
-
Where: FHH is farm households, EHH is entrepreneur households, WHH is wage earner households.
Poverty results of 100% tariff cut by household group.
| Base (1) | 100% tariff cut (2) | Variation (percentage change from base) (b/n 2 & 1) | ||
|---|---|---|---|---|
| Poverty head count index (α = 0) | All | 0.561 (0.0061) | 0.589 (0.0060) | 2.8 |
| FHH | 0.597 (0.0070) | 0.614 (0.0069) | 1.7 | |
| EHH | 0.263 (0.0134) | 0.295 (0.0138) | 3.2 | |
| WHH | 0.383 (0.0098) | 0.398 0.0098) | 1.5 | |
| Poverty gap (α = 1) | All | 0.169 (0.0024) | 0.182 (0.0025) | 1.3 |
| FHH | 0.181 (0.0028) | 0.189 (0.0029) | 0.8 | |
| EHH | 0.073 (0.0047) | 0.085 (0.0050) | 1.2 | |
| WHH | 0.11 (0.0036) | 0.117 (0.0037) | 0.7 | |
| Poverty severity (α = 2) | All | 0.069 (0.0013) | 0.076 (0.0014) | 0.7 |
| FHH | 0.074 (0.0015) | 0.078 (0.0016) | 0.4 | |
| EHH | 0.029 (0.0023) | 0.034 (0.0026) | 0.5 | |
| WHH | 0.043 (0.0018) | 0.047 (0.0019) | 0.4 |
-
Note: The figures in parentheses are standard deviations.
-
Where: FHH is farm households, EHH is entrepreneur households, WHH is wage earner households
Poverty results of uniform tariff scheme by household group.
| Base (1) | Uniform tariff Scheme (2) | Variation (percentage Change from base) (b/n 2 & 1) | ||
|---|---|---|---|---|
| Poverty head count index (α = 0) | All | 0.561 (0.0061) | 0.584 (0.0060) | 2.3 |
| FHH | 0.597 (0.0070) | 0.606 (0.0069) | 0.9 | |
| EHH | 0.263 (0.0134) | 0.295 (0.0138) | 3.2 | |
| WHH | 0.383 (0.0098) | 0.398 0.0098) | 1.5 | |
| Poverty gap (α = 1) | All | 0.169 (0.0024) | 0.18 (0.0025) | 1.1 |
| FHH | 0.181 (0.0028) | 0.185 (0.0029) | 0.4 | |
| EHH | 0.073 (0.0047) | 0.085 (0.0050) | 1.2 | |
| WHH | 0.11 (0.0036) | 0.117 (0.0037) | 0.7 | |
| Poverty severity (α = 2) | All | 0.069 (0.0013) | 0.075 (0.0014) | 0.6 |
| FHH | 0.074 (0.0015) | 0.076 (0.0016) | 0.2 | |
| EHH | 0.029 (0.0023) | 0.034 (0.0026) | 0.5 | |
| WHH | 0.043 (0.0018) | 0.047 (0.0019) | 0.4 |
-
Note: The figures in parentheses are standard deviations.
-
Where: FHH is farm households, EHH is entrepreneur households, WHH is wage earner households.