A microsimulation model for risk in Irish tillage farming
- Rural Economy and Development Programme, Ireland
Cite this article
as: J. Loughrey, F. Thorne, T. Hennessy; 2016; A microsimulation model for risk in Irish tillage farming; International Journal of Microsimulation; 9(2); 41-76.
doi: 10.34196/ijm.00135
- Article
- Figures and data
- Jump to
Figures
Figure 1
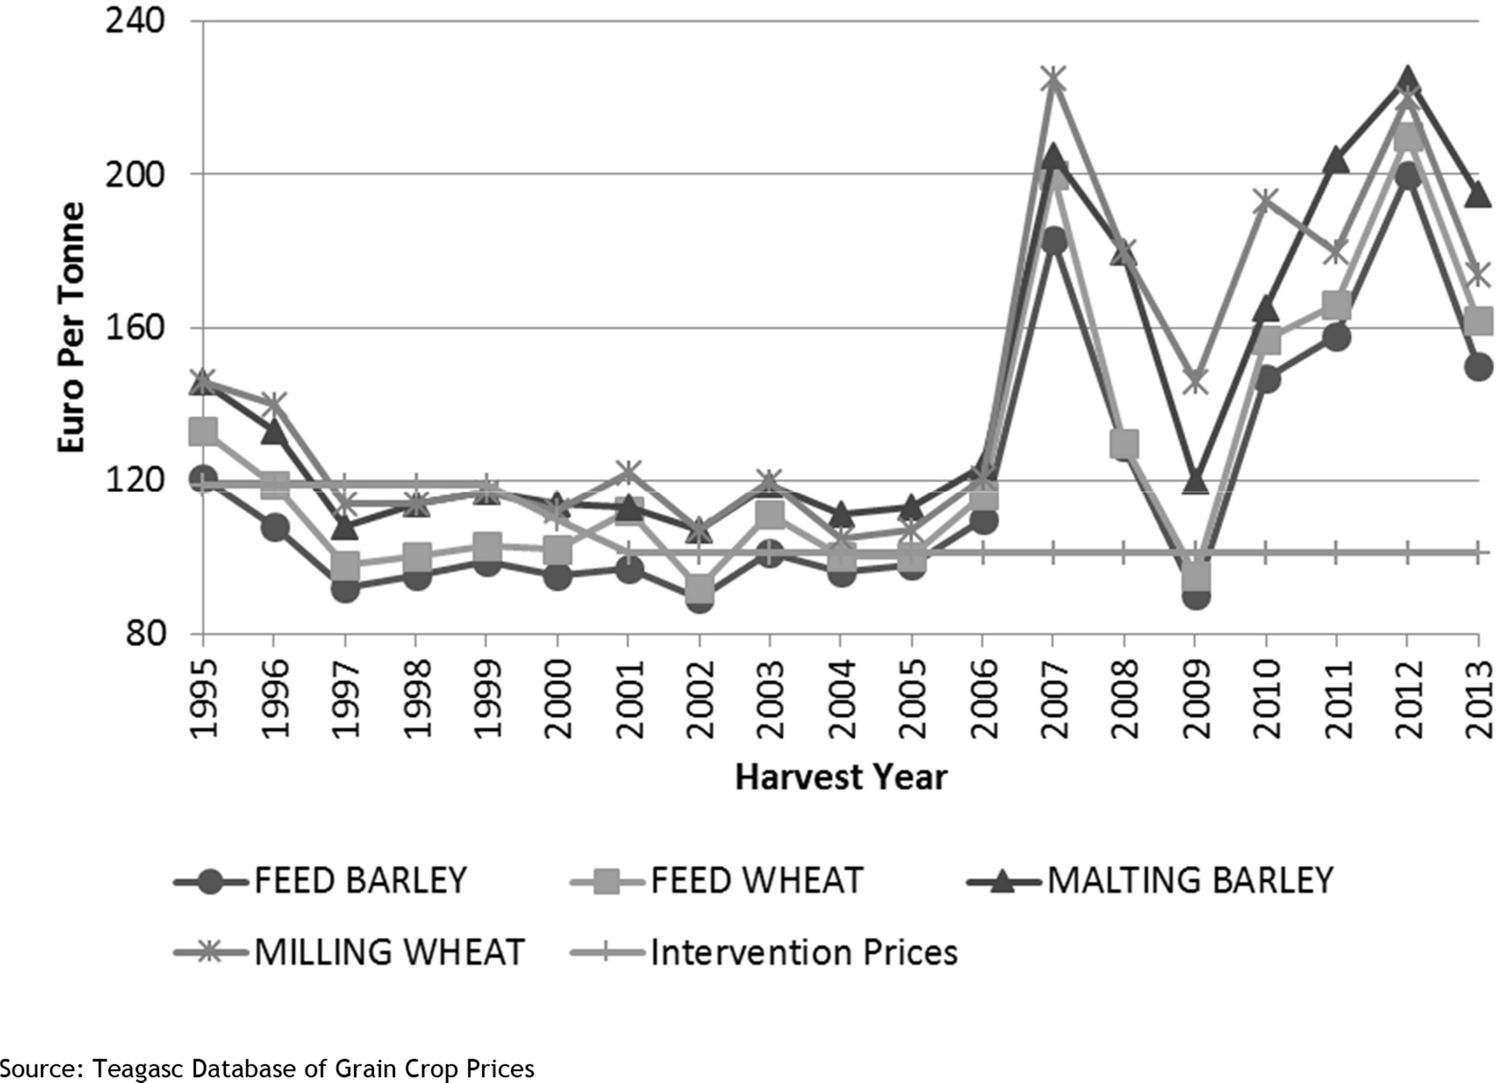
Historical price trends for selected grain crops (€).
Figure 2
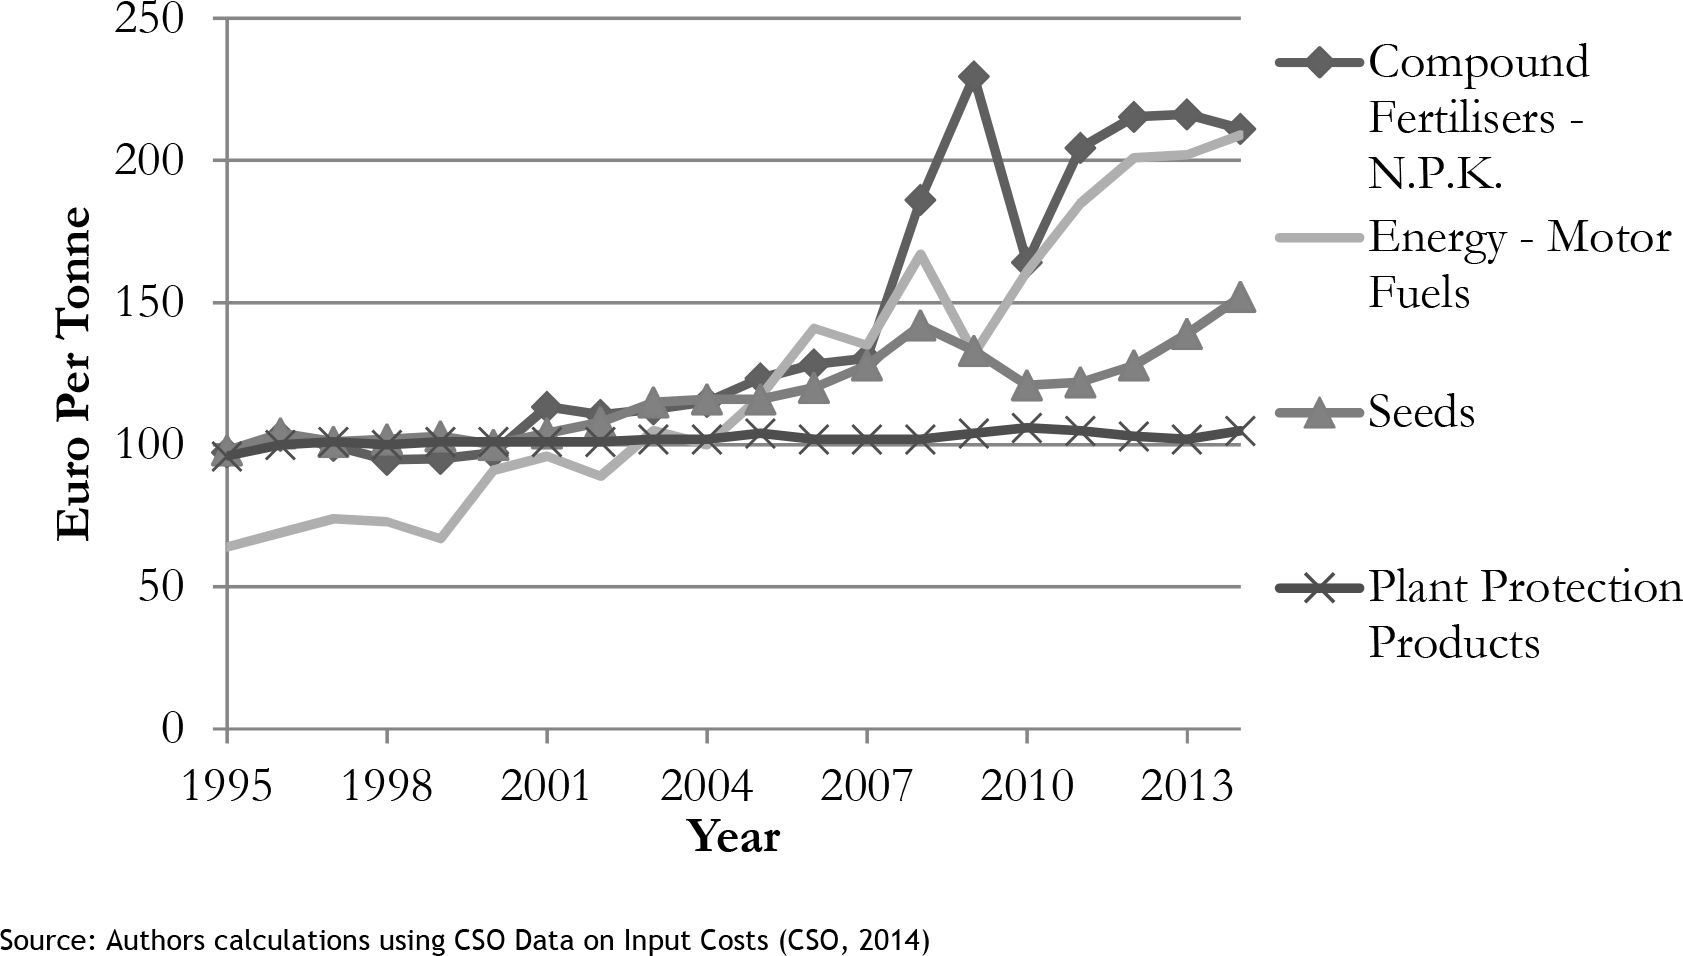

Cost indices for key inputs at sowing time (Index 2000)1.
Figure 3
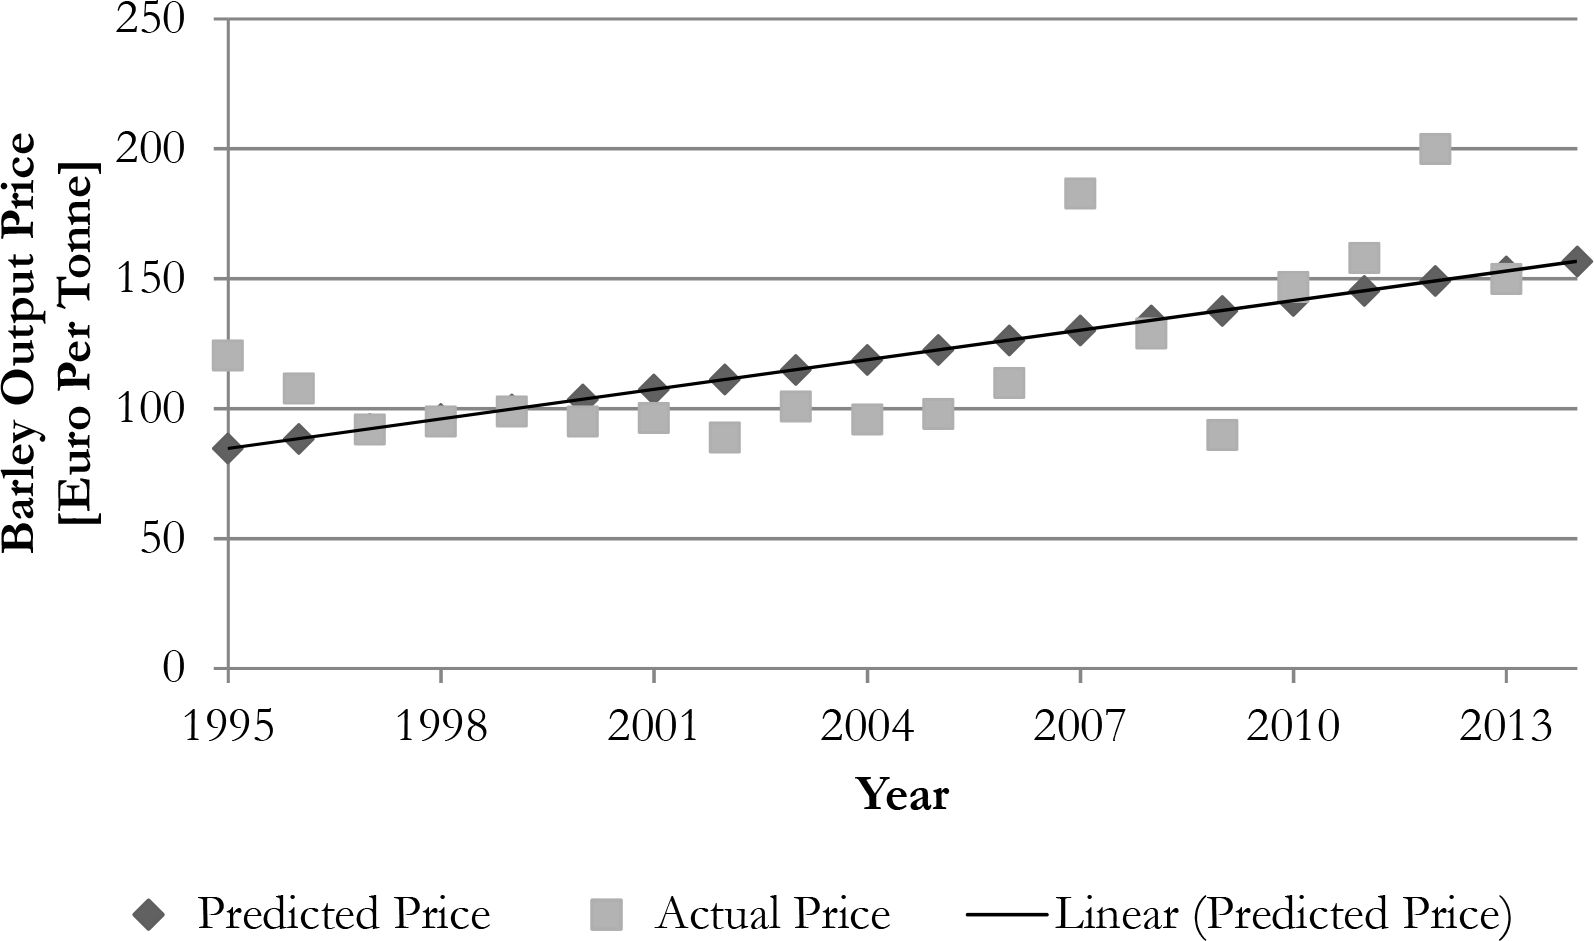
Actual and linear predicted spring barley price (€) 1995–2013.
Figure 4
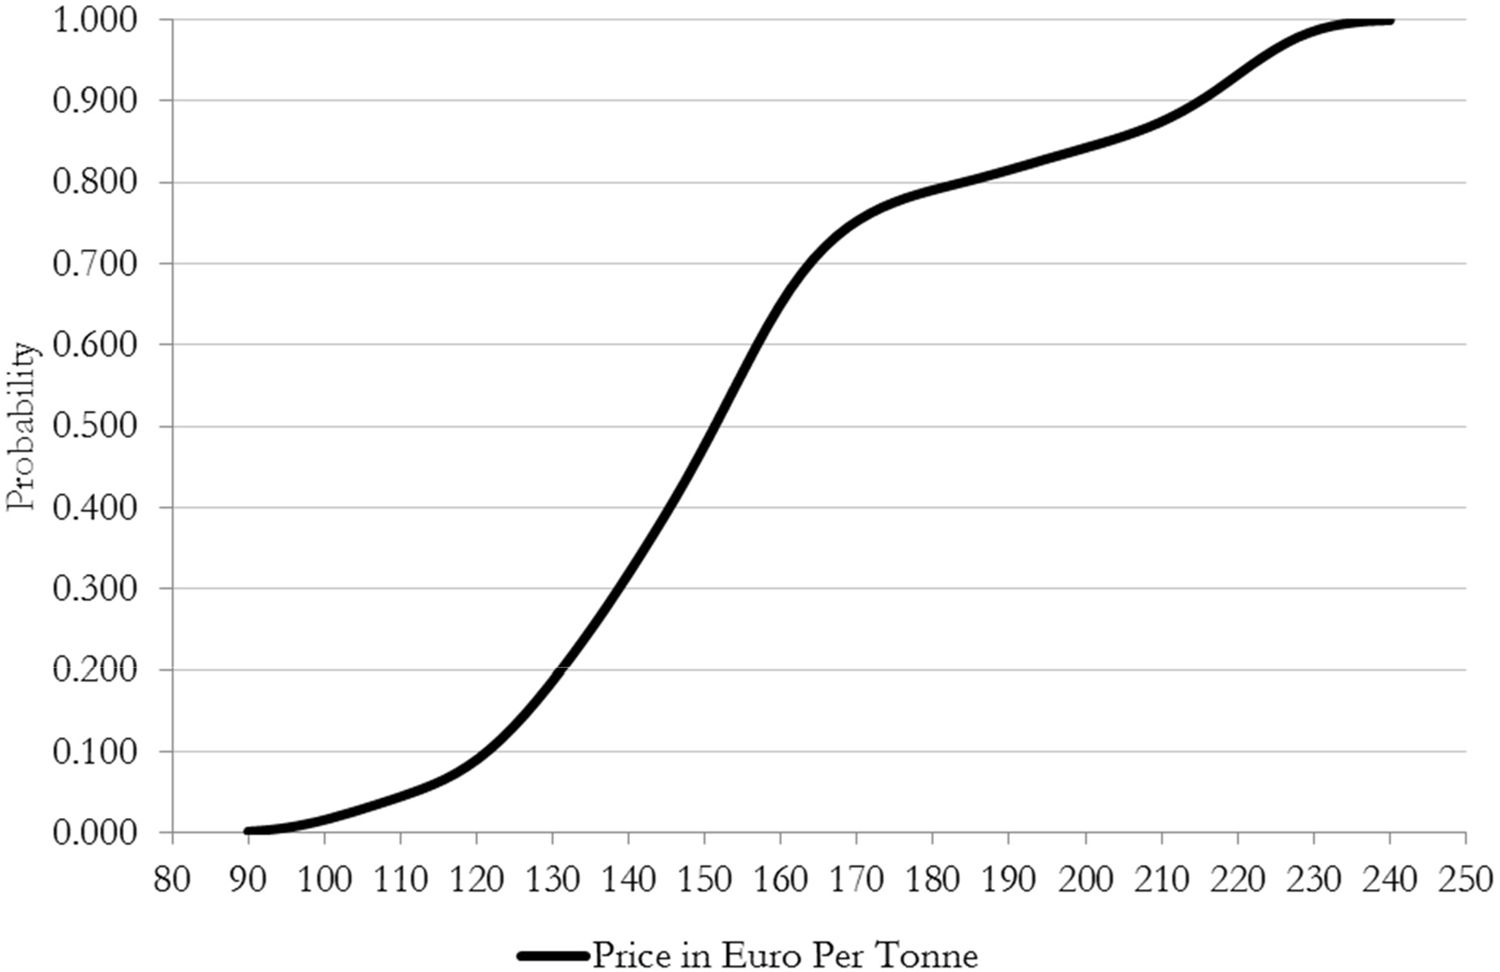
Cumulative distribution function of the feed barley price in 2014.
Figure 5
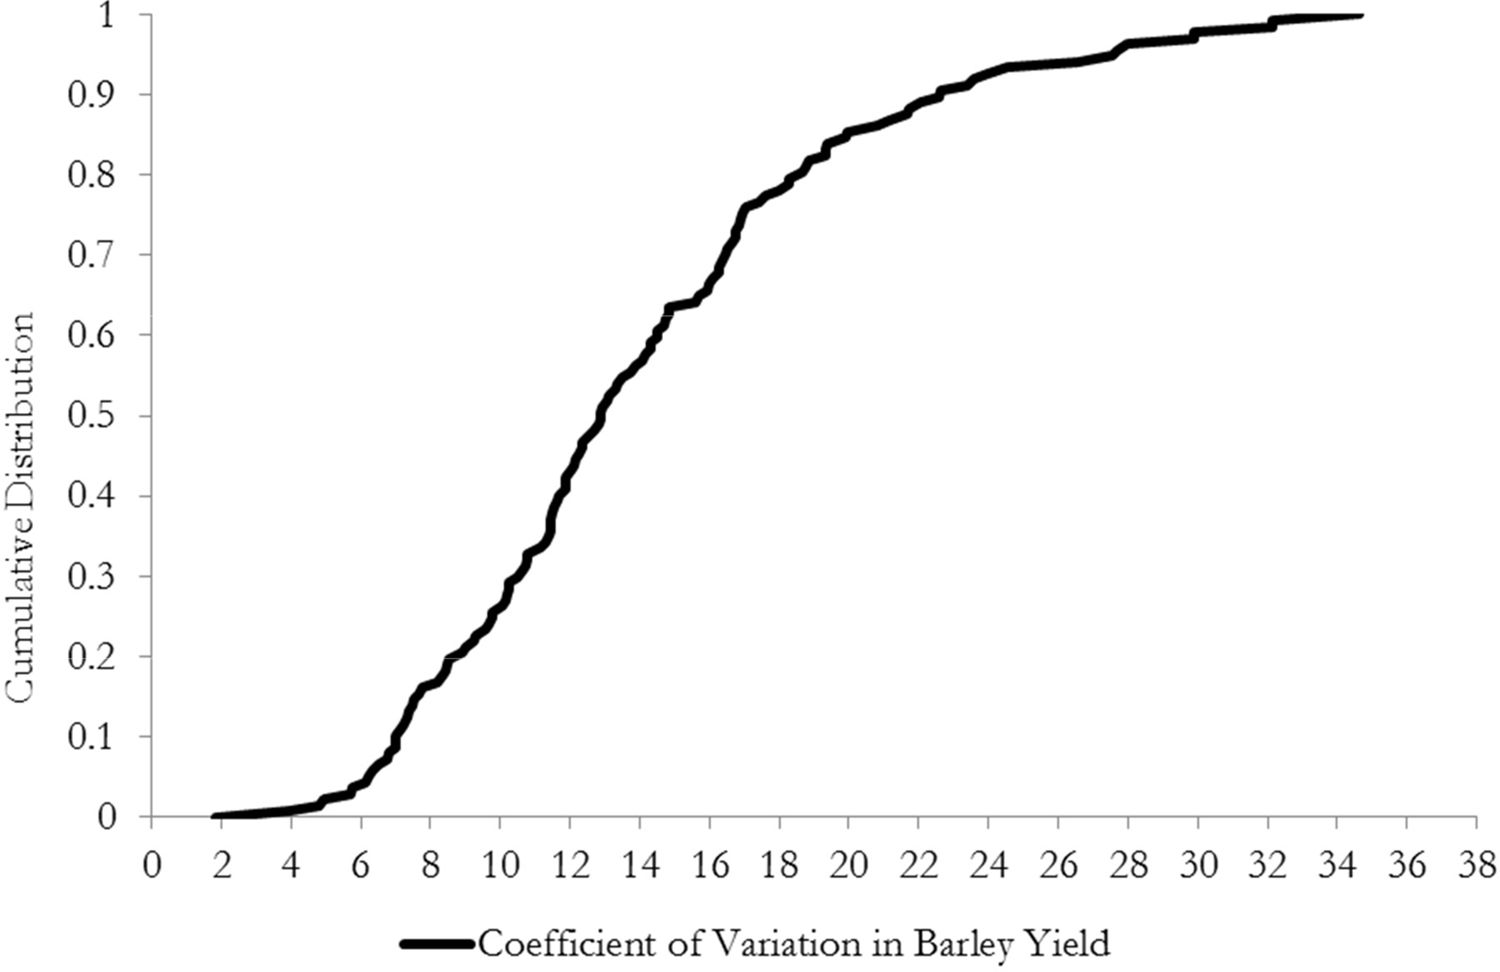
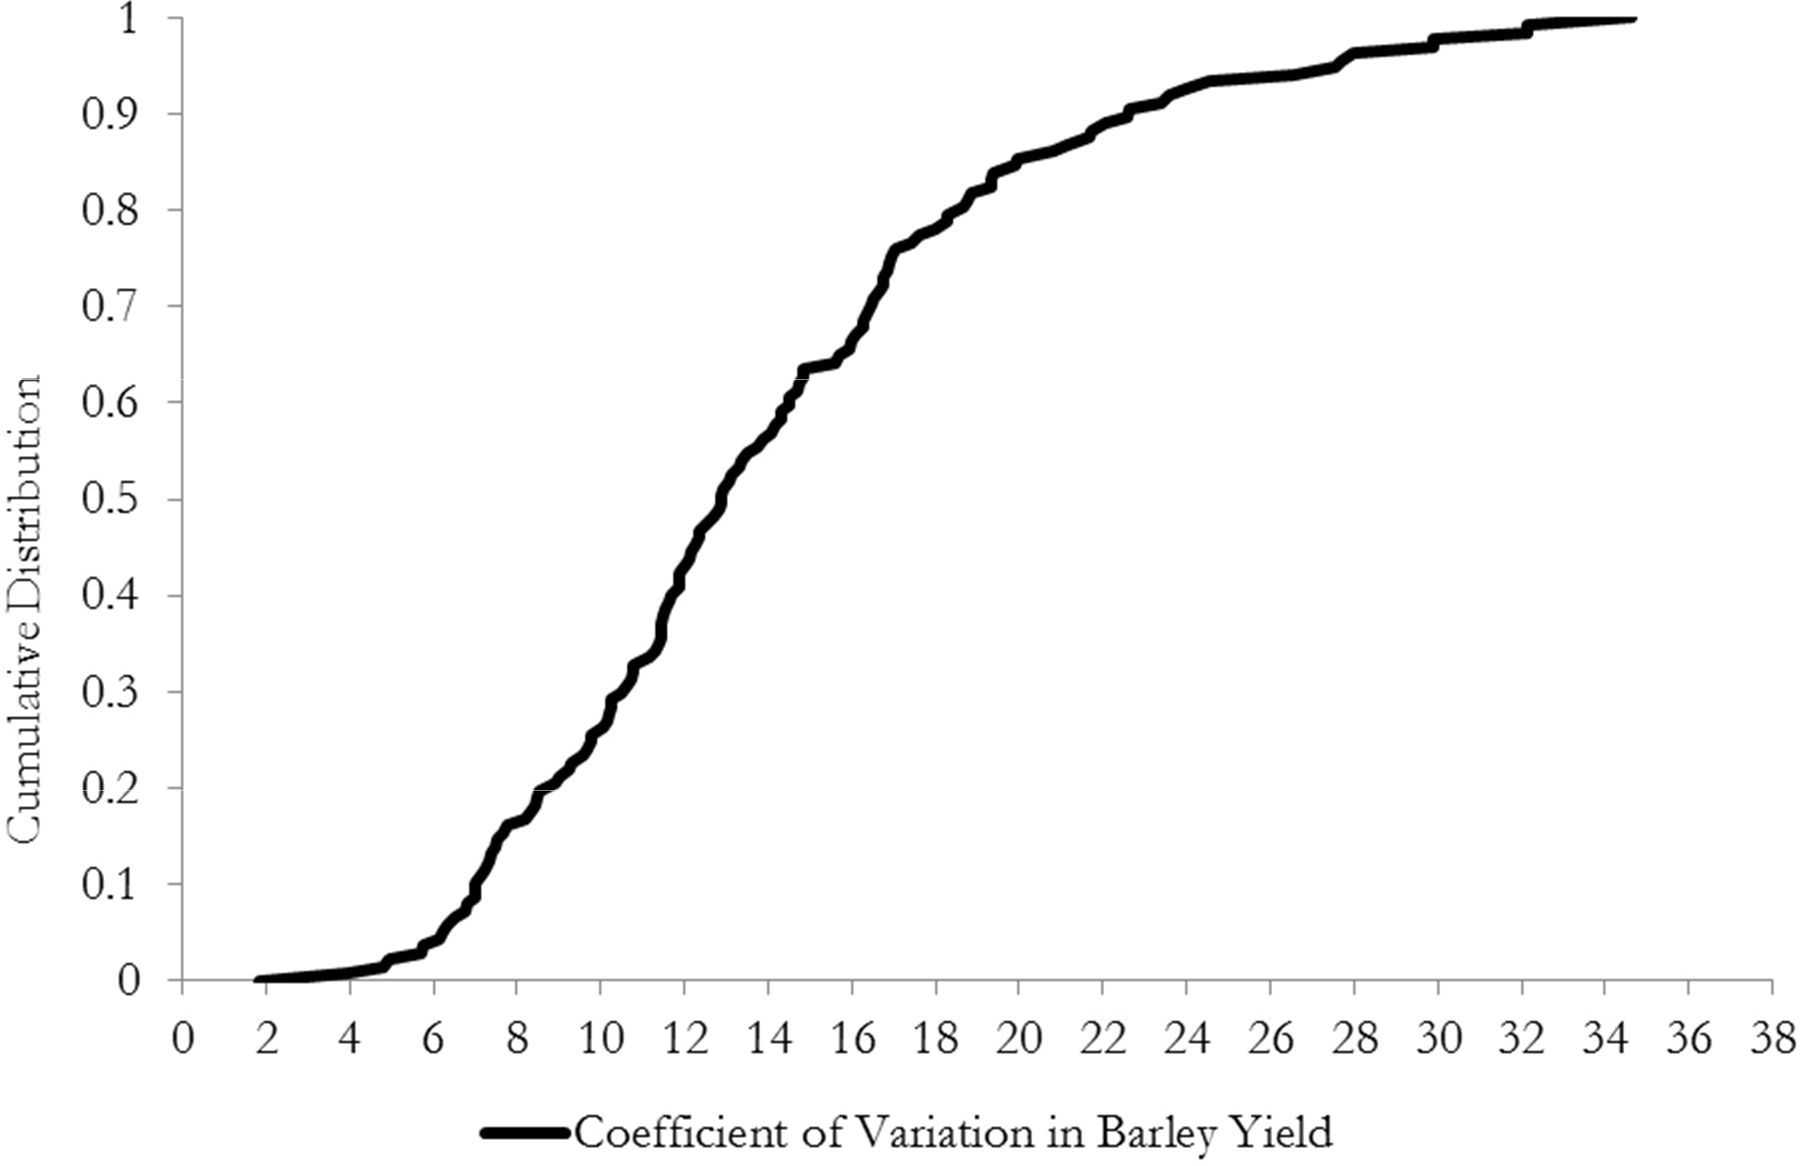
Cumulative distribution of the variability in barley yield in 2014.
Figure 6
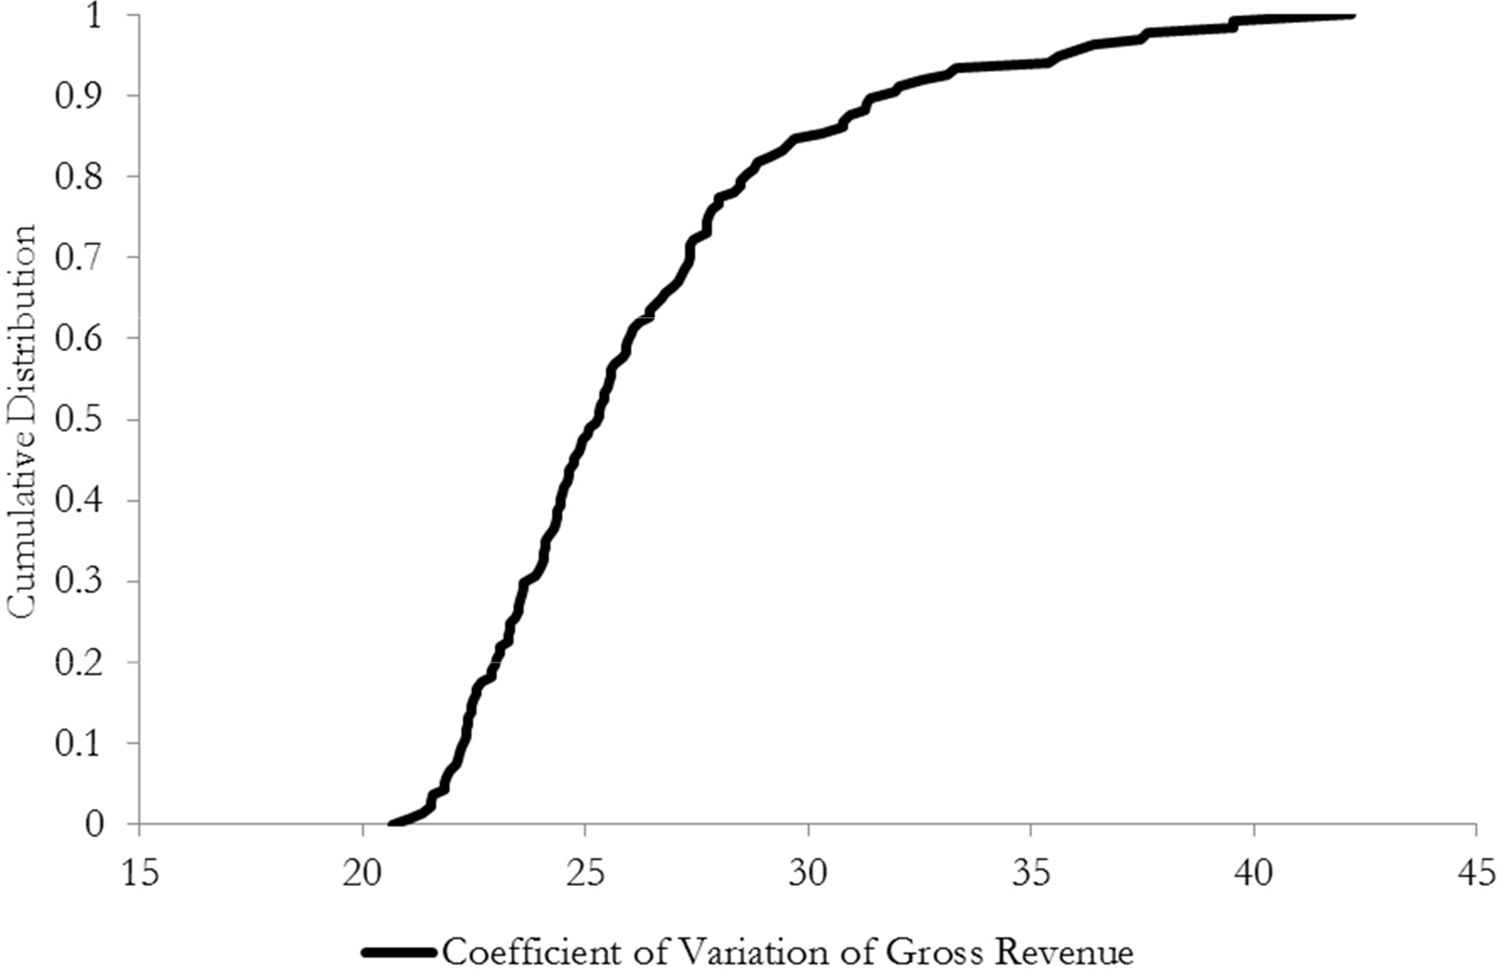
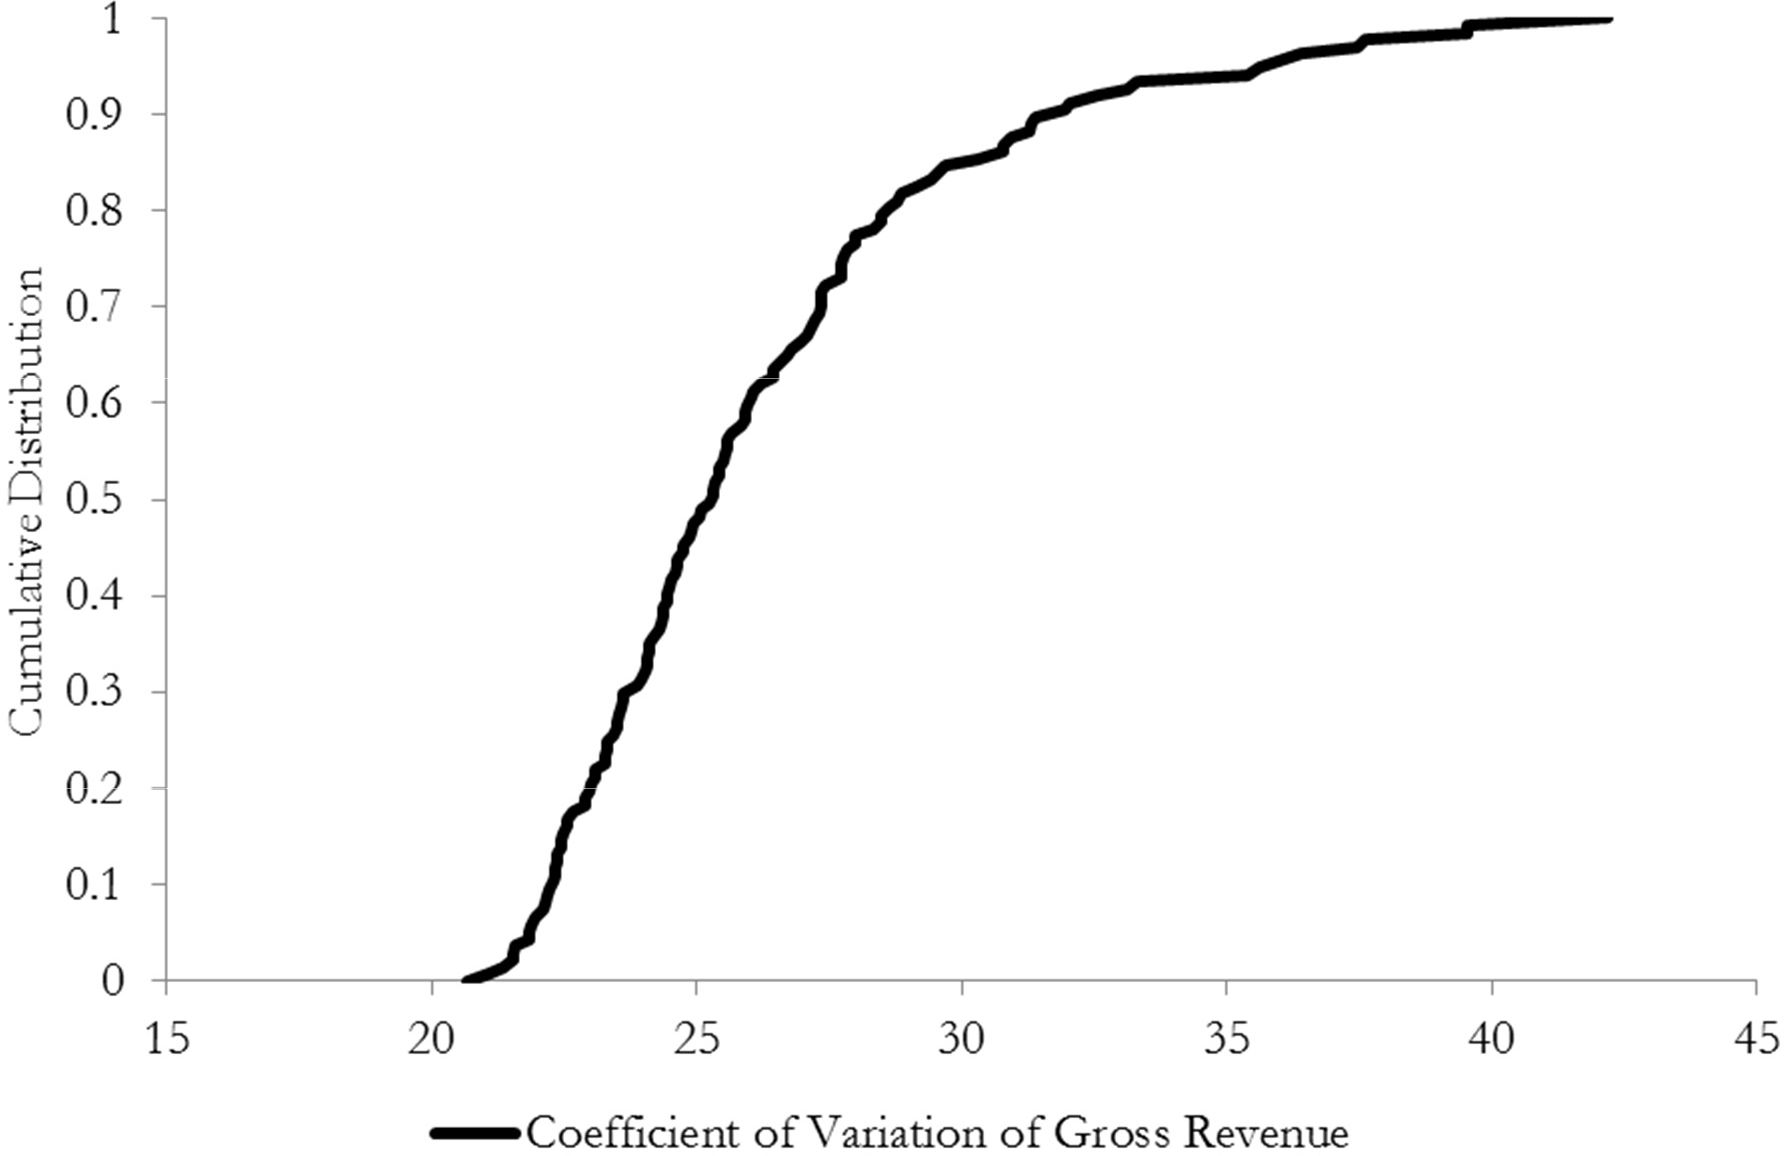
Cumulative distribution of the variability in market gross revenue.
Tables
Table 1
Statistics for the selected sample and other tillage producers.
| Other Tillage Producers | The selected sample | ||
|---|---|---|---|
| No Spring Barley | Less than Five Years of Spring Barley | Five Years Plus of Spring Barley | |
| Spring Barley Yield [Animal Feed] | N/A | 5.69 | 6.04 |
| Average Spring Barley [Animal Feed] Hectares | 0.00 | 6.54 | 10.45 |
| Average Malted Spring Barley Hectares | 5.69 | 1.37 | 0.34 |
| Farm Size [Number of Hectares | 59.23 | 54.03 | 69.71 |
| Land Owned | 51.97 | 44.44 | 59.25 |
| Land Rented In | 11.02 | 14.45 | 15.01 |
| Total Pasture Hectares | 30.43 | 30.63 | 38.50 |
| Total Tillage Hectares | 24.28 | 20.36 | 27.97 |
| Number of Crops in Each Year | 1.11 | 1.38 | 1.59 |
| Mainly Tillage (0,1) | 0.37 | 0.47 | 0.51 |
| Specialist Dairy (0,1) | 0.20 | 0.13 | 0.06 |
| Livestock Units | 59.48 | 56.80 | 69.73 |
| Livestock Units Per Hectare | 1.07 | 1.01 | 0.97 |
| Farm Operator Age | 50.99 | 51.90 | 55.98 |
| Mean Farm Income | 38,353 | 31,140 | 36,750 |
| Mean Market Farm Income | 19,790 | 15,446 | 11,780 |
| Mean Single Farm Payment | 17,482 | 14,722 | 23,991 |
| Off-Farm Employment Operator | 0.34 | 0.38 | 0.24 |
| Off-Farm Employment Spouse | 0.23 | 0.31 | 0.28 |
| Sample size | 49 | 240 | 138 |
-
Source: Authors Calculations using Teagasc National Farm Survey Data 2005–2013.
Table 2
Parameters for an empirical distribution of feed barley price in 2014.
| Historical Ranking | Deterministic Component | Sorted Fractional Deviates Dct | Cumulative Probability (F(Dc) |
|---|---|---|---|
| Min | 156.736 | −0.364135974 | 0 |
| 1 | 156.736 | −0.346796166 | 0.0263 |
| 2 | 156.736 | −0.200781935 | 0.0789 |
| 3 | 156.736 | −0.19998511 | 0.1316 |
| 4 | 156.736 | −0.19211783 | 0.1842 |
| 5 | 156.736 | −0.12981906 | 0.2368 |
| 6 | 156.736 | −0.12203359 | 0.2895 |
| 7 | 156.736 | −0.10178267 | 0.3421 |
| 8 | 156.736 | −0.08118956 | 0.3947 |
| 9 | 156.736 | −0.03725432 | 0.4474 |
| 10 | 156.736 | −0.01925512 | 0.5 |
| 11 | 156.736 | −0.00869402 | 0.5526 |
| 12 | 156.736 | −0.00817022 | 0.6053 |
| 13 | 156.736 | −0.002380722 | 0.6579 |
| 14 | 156.736 | 0.038333195 | 0.7105 |
| 15 | 156.736 | 0.086928907 | 0.7632 |
| 16 | 156.736 | 0.219717674 | 0.8158 |
| 17 | 156.736 | 0.34089299 | 0.8684 |
| 18 | 156.736 | 0.405517738 | 0.9211 |
| 19 | 156.736 | 0.424213082 | 0.9737 |
| Max | 156.736 | 0.445423736 | 1 |
Table 3A
The variability of market gross margin across the distribution.
| Coefficient of Variation | Standard Deviation | |||||
|---|---|---|---|---|---|---|
| 25th Percentile | Median | 75th Percentile | 25th Percentile | Median | 75th Percentile | |
| Market Gross Revenue | 23.31 | 25.25 | 27.76 | 1780.08 | 3420.50 | 6524.20 |
| Market Gross Margin | 54.96 | 69.77 | 119.43 | 1811.45 | 3531.71 | 6556.58 |
Table 3B
Effect of forward contracting on variability of market gross margin.
| Coefficient of Variation (%) | Standard Deviation | |||||
|---|---|---|---|---|---|---|
| 25th Percentile | Median | 75th Percentile | 25th Percentile | Median | 75th Percentile | |
| Market Gross Margin | 54.96 | 69.77 | 119.43 | 1811.45 | 3531.71 | 6556.58 |
| Margin with Forward Selling Option A | 48.04 | 62.32 | 112.57 | 1639.82 | 3195.35 | 5474.91 |
| Margin with Forward Selling Option B | 42.11 | 57.20 | 97.93 | 1433.87 | 2812.42 | 4703.06 |
-
A-20% of expected production @ 150 euro per tonne B-35% of expected production @ 150 euro per tonne.
Table 4
Average coefficient of variation by farm system 2005–20137.
| Farm system | Total Farm Gross Margin (%) | Total Farm Gross Margin (Excluding Subsidies) (%) |
|---|---|---|
| Cattle | 28.75 | 57.29 |
| Specialist Dairy | 22.70 | 29.89 |
| Specialist Tillage | 23.86 | 42.38 |
| Sheep | 22.16 | 64.92 |
| Dairy and Other | 25.85 | 50.00 |
| Total | 26.23 | 52.20 |
| Non-Specialist Tillage8 | 21.49 | 39.16 |
| No. of observations | 927 | 927 |
-
Source: Authors calculations using Teagasc National Farm Survey data.
Table 5
Correlation coefficient between livestock and crop returns.
| Percentile | Correlation Coefficient |
| 10th Percentile | −0.46 |
| 25th Percentile | −0.16 |
| 50th Percentile (Median) | 0.13 |
| 75th Percentile | 0.39 |
| 90th Percentile | 0.61 |
-
Source: Authors calculations using Teagasc National Farm Survey data.
Table 6
Intra-temporal correlation matrix.
| Yields | Prices | |||||||||||||
|---|---|---|---|---|---|---|---|---|---|---|---|---|---|---|
| IR | UK | USA | IR | |||||||||||
| Malt | Feed | Mill | Feed | Mill | Feed | |||||||||
| Oats | Barley | Wheat | Barley | Oats | Rye | Wheat | Soybean | Barley | Wheat | Oats | ||||
| IR Oats Yield | 1 | 0.72 | 0.69 | 0.23 | 0.03 | −0.09 | 0.22 | −0.20 | 0.18 | −0.03 | −0.03 | −0.02 | −0.04 | −0.12 |
| IR Barley Yield | 1 | 0.84 | 0.24 | −0.02 | −0.07 | 0.27 | −0.05 | 0.20 | 0.10 | 0.01 | 0.12 | 0.09 | 0.09 | |
| IR Wheat Yield | 1 | 0.24 | 0.33 | −0.16 | 0.51 | −0.04 | 0.05 | −0.10 | −0.20 | −0.08 | −0.13 | −0.11 | ||
| UK Barley Yield | 1 | 0.54 | 0.60 | 0.65 | 0.00 | −0.11 | −0.09 | −0.09 | −0.14 | −0.04 | −0.08 | |||
| UK Oats Yield | 1 | 0.23 | 0.69 | −0.09 | −0.22 | −0.19 | −0.27 | −0.19 | −0.19 | −0.17 | ||||
| UK Rye Yield | 1 | 0.51 | 0.29 | −0.40 | −0.35 | −0.24 | −0.44 | −0.30 | −0.33 | |||||
| UK Wheat Yield | 1 | −0.21 | −0.17 | −0.23 | −0.23 | −0.34 | −0.20 | −0.25 | ||||||
| USA Soybean Yield | 1 | −0.59 | −0.46 | −0.47 | −0.37 | −0.47 | −0.32 | |||||||
| Price IR Malt Barley | 1 | 0.85 | 0.83 | 0.81 | 0.86 | 0.78 | ||||||||
| Price IR Feed Barley | 1 | 0.95 | 0.97 | 0.99 | 0.97 | |||||||||
| Price IR Mill Wheat | 1 | 0.91 | 0.94 | 0.88 | ||||||||||
| Price IR Feed Wheat | 1 | 0.96 | 0.97 | |||||||||||
| Price IR Mill Oats | 1 | 0.96 | ||||||||||||
| Price IR Feed Oats | 1 | |||||||||||||
Download links
A two-part list of links to download the article, or parts of the article, in various formats.