Validation of spatial microsimulation models: A proposal to adopt the Bland-Altman method
- School of Sport and Exercise Science, University of Lincoln, United Kingdom
- Arthritis Research UK Centre for Sport Exercise and Osteoarthritis, University of Nottingham, United Kingdom
Cite this article
as: K. A Timmins, K. L Edwards; 2016; Validation of spatial microsimulation models: A proposal to adopt the Bland-Altman method; International Journal of Microsimulation; 9(2); 106-122.
doi: 10.34196/ijm.00137
- Article
- Figures and data
- Jump to
Figures
Figure 1

Hypothetical illustrations of Bland Altman plots.
Figure 2
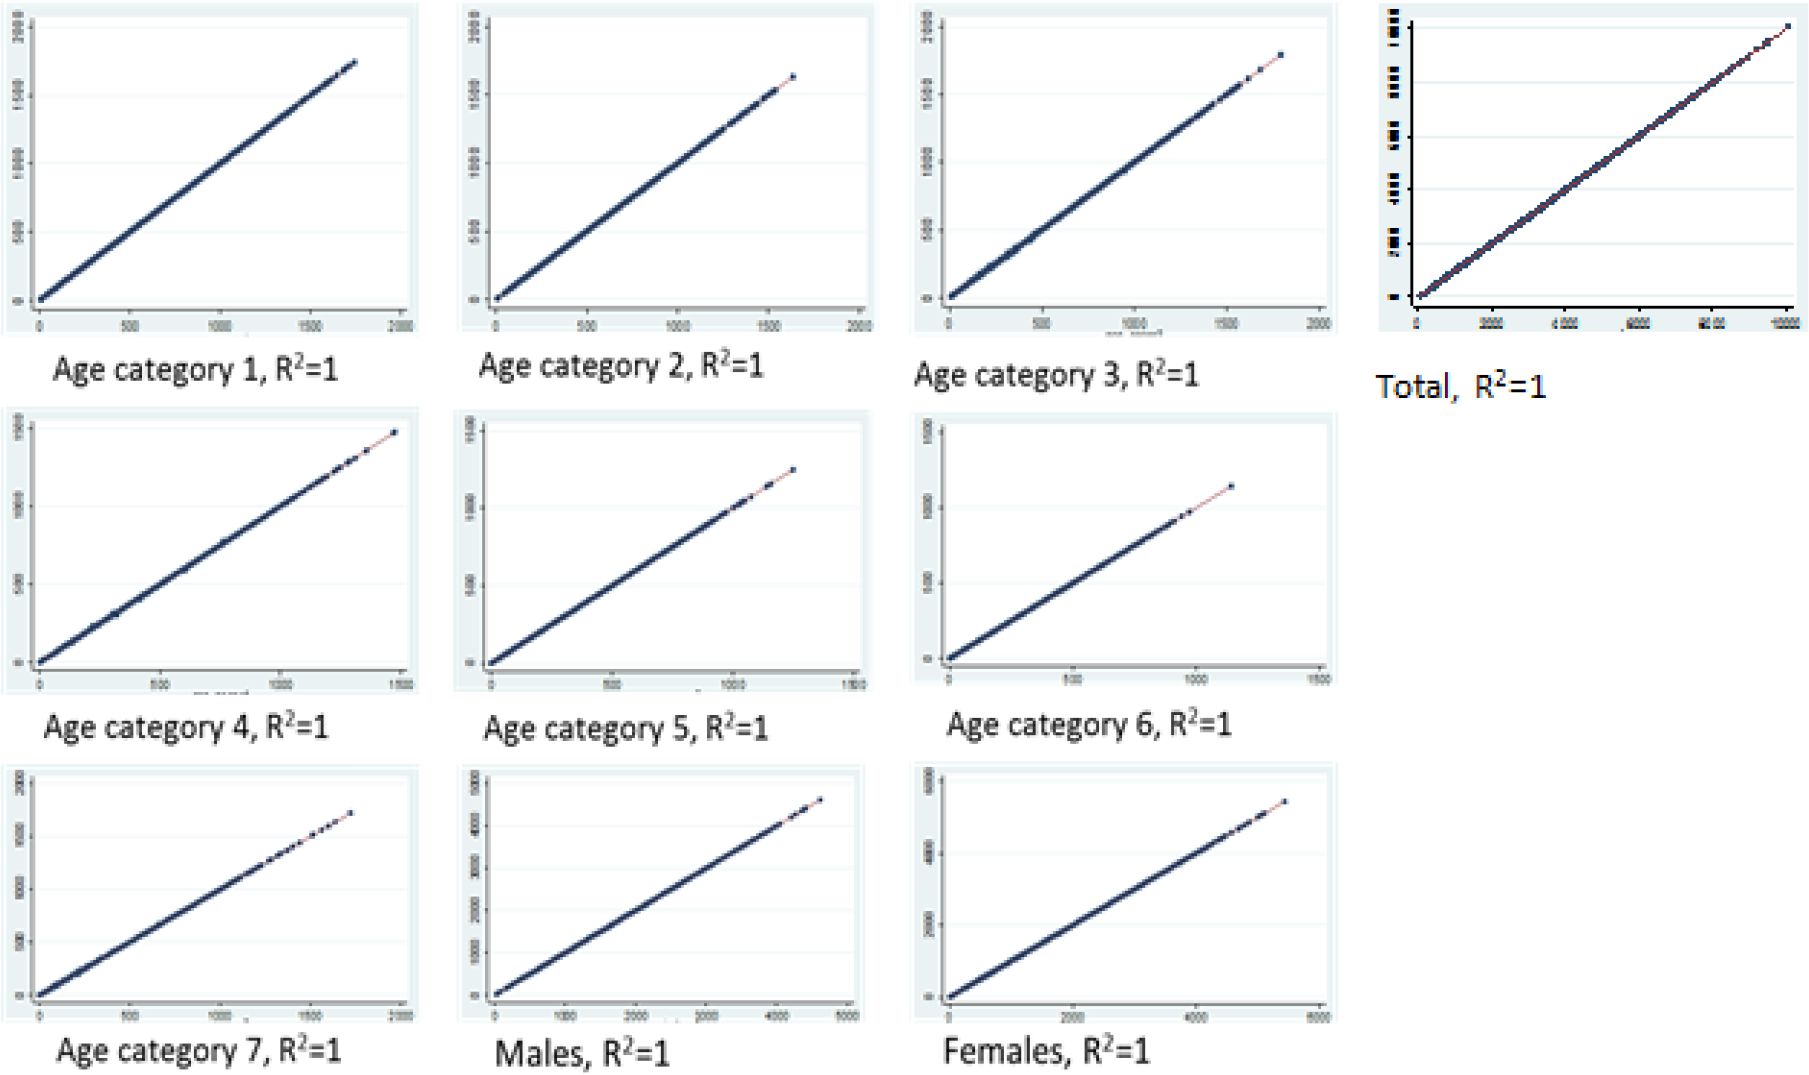
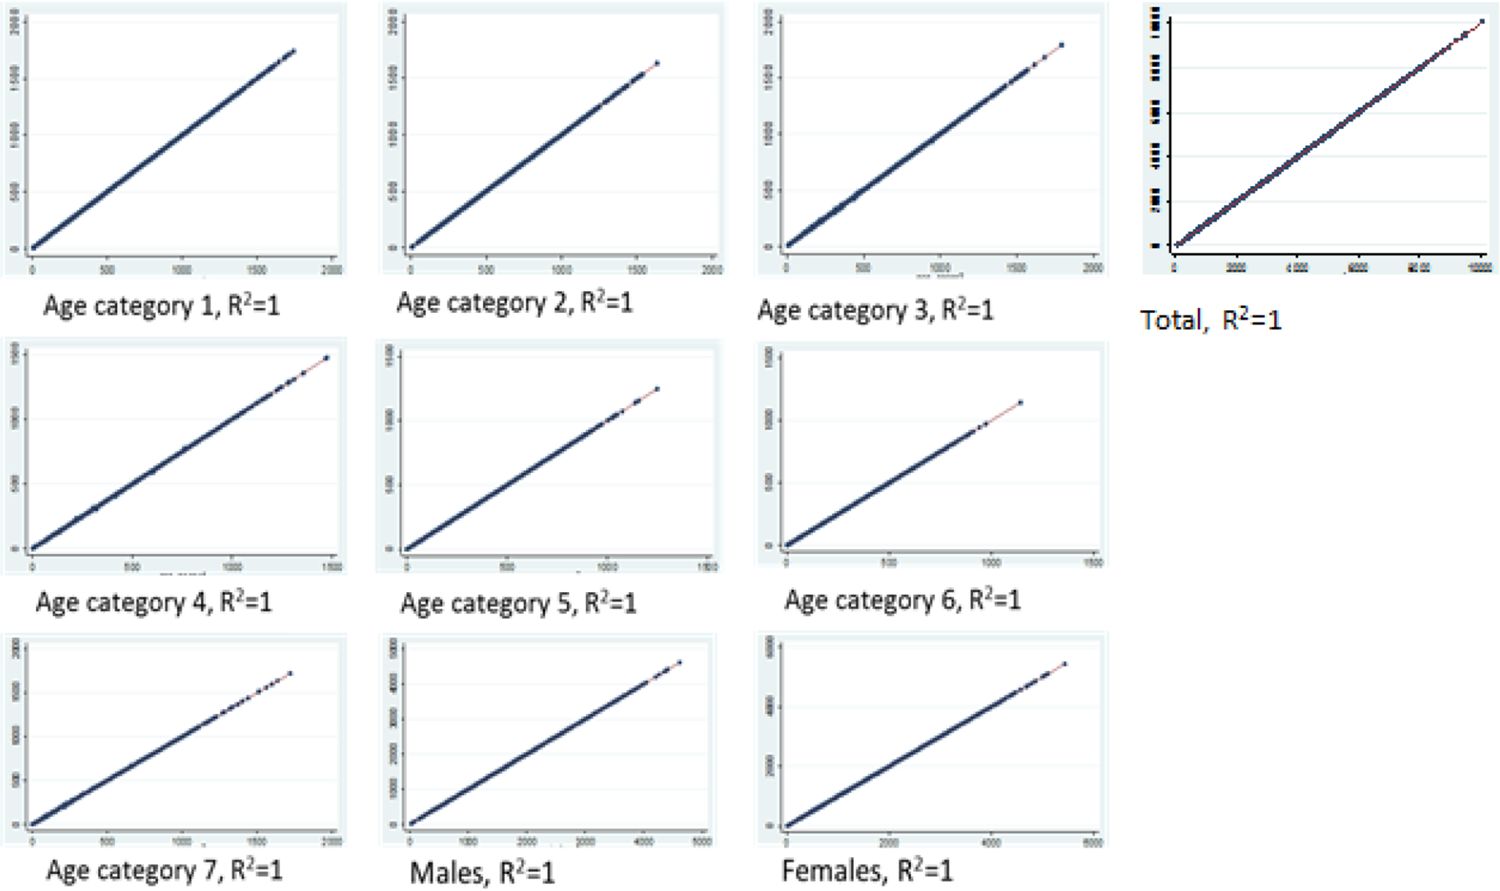
Scatter plots for age and sex categories, simulated counts versus census ward totals.
Figure 3
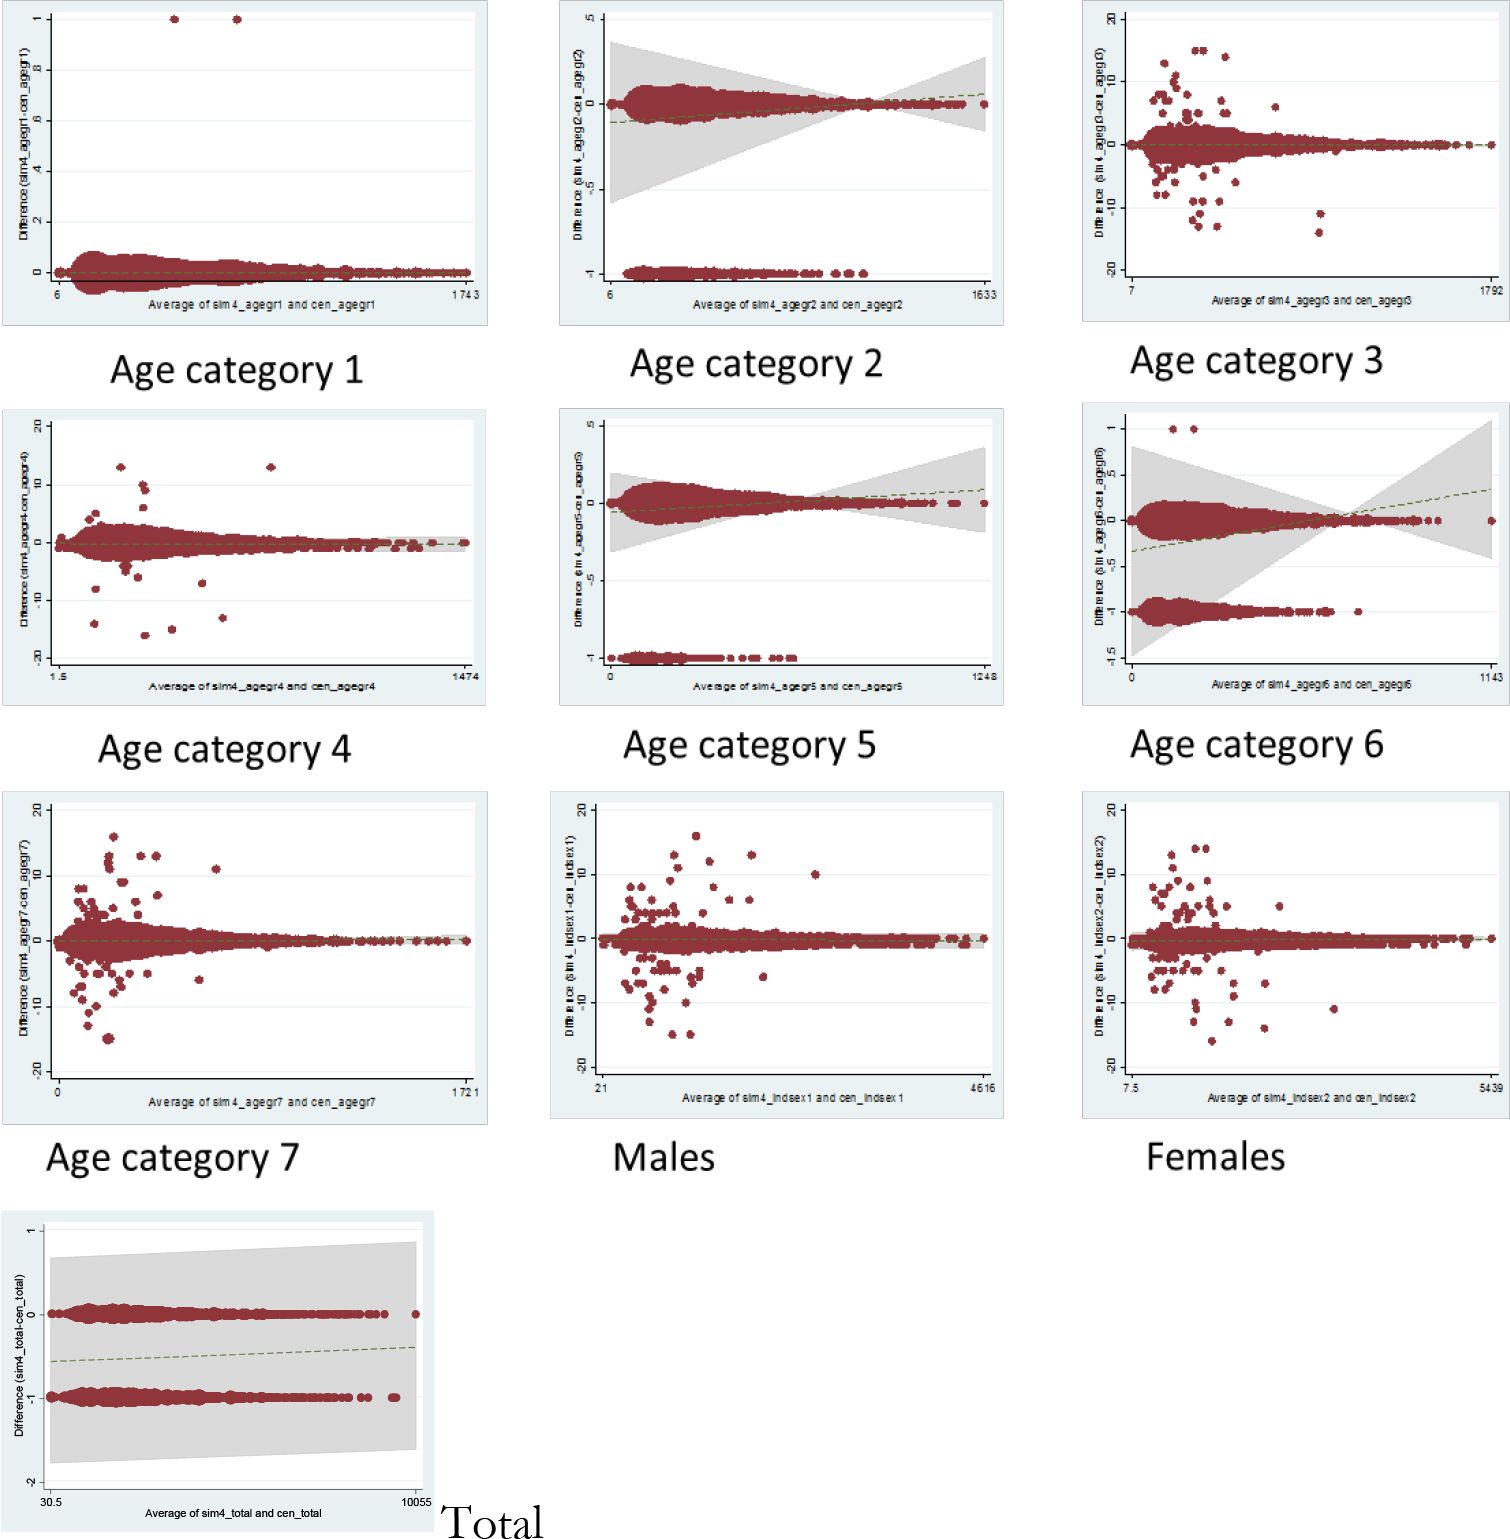

Bland Altman plots for age and sex categories, simulated versus census ward totals.
Tables
Table 1
Methods to assess goodness-of-fit of spatial microsimulation models.
| Method | Description |
|---|---|
| Correlation and R2 | Plots simulated area count against actual area count. The R2, or coefficient of determination, is the square of the Pearson correlation coefficient and gives an indication of fit. |
| Standard Error about Identity (SEI) | In contrast to R2, SEI reflects the error around the line of identity (x=y; also known as the line of equality), rather than the line of best fit. |
| Total Absolute Error (TAE) | A sum of the error (the difference between simulated and actual population counts for each area) across a category. |
| Standardized Absolute Error (SAE) | TAE is divided by the total expected count. The standardization allows comparison between tables. |
| Root Mean Squared Error (RMSE) | The square root of the mean squared error. Gives an indication of error dispersion (if error follows a normal distribution). |
| z-score, modified z-score, and zm2 | The z-score is a cell level statistic that reflects the difference in the relative size of the category between actual and simulated populations. The modified score deals better with small cell counts, though an adjustment still needs to be made where area counts are 0. The zm2 is an overall measure, summing the squared z-scores. |
| E5 | A count of the number of areas where error is greater than 5%. |
Table 2
Validation metrics for the comparison of simulated and census counts in each constraint category.
| Category | R2 | SEI | TAE | SAE | RMSE | zm2 | E5 |
|---|---|---|---|---|---|---|---|
| Age group 1 | 1 | 1 | 2 | 0.0000006 | 0.016128 | 0.003318 | 0 |
| Age group 2 | 1 | 0.999999 | −522 | −0.0001742 | 0.260556 | 2.175607 | 0 |
| Age group 3 | 1 | 0.999991 | −62 | −0.0000195 | 0.688421 | 13.26152 | 6 |
| Age group 4 | 1 | 0.999988 | −1365 | −0.0005442 | 0.626817 | 12.09789 | 6 |
| Age group 5 | 1 | 0.999999 | −221 | −0.0001081 | 0.169536 | 2.005676 | 1 |
| Age group 6 | 1 | 0.999988 | −1591 | −0.0009531 | 0.455455 | 14.59673 | 3 |
| Age group 7 | 1 | 0.999989 | −251 | −0.0001029 | 0.689271 | 22.73108 | 22 |
| Male | 1 | 0.999998 | −1703 | −0.0001987 | 0.809217 | 6.331774 | 0 |
| Female | 1 | 0.999999 | −2307 | −0.0002389 | 0.85425 | 7.099424 | 4 |
| Total | 1 | 1 | −4010 | −0.0002200 | 0.722166 | 2.450981 | 0 |
Table 3
Summary of the strengths and weaknesses of validation methods presented.
| R2 | SEI | TAE | SAE | RMSE | zm | Zm2 | E5 | BA plot | |
|---|---|---|---|---|---|---|---|---|---|
| Indication of individual area error | X | X | X | X | X | √ | X | √ | √ |
| Indication of systematic (overall) bias | X | √ | √ | √ | X | X | √ | X | √ |
| Identify outliers | √ | X | X | X | X | √ | X | √ | √ |
| Indication of error distribution (by area size) | X | X | X | X | √ | X | X | X | √ |
| Handles empty cells (0 counts) | √ | √ | √ | √ | √ | X | X | X | √ |
| Comparable across models (of different sizes) | √ | √ | X | √ | X | √ | X | √ | √ |
| Single overall metric (for each category) | √ | √ | √ | √ | √ | X | √ | √ | X |
Download links
A two-part list of links to download the article, or parts of the article, in various formats.