Evaluating the quality of gross incomes in SILC: Compare them with fiscal data and re-calibrate them using EUROMOD
- Herman Deleeck Centre for Social Policy, University of Antwerp, Belgium
- Research Centre of Public Economics, Belgium
- Article
- Figures and data
- Jump to
Figures

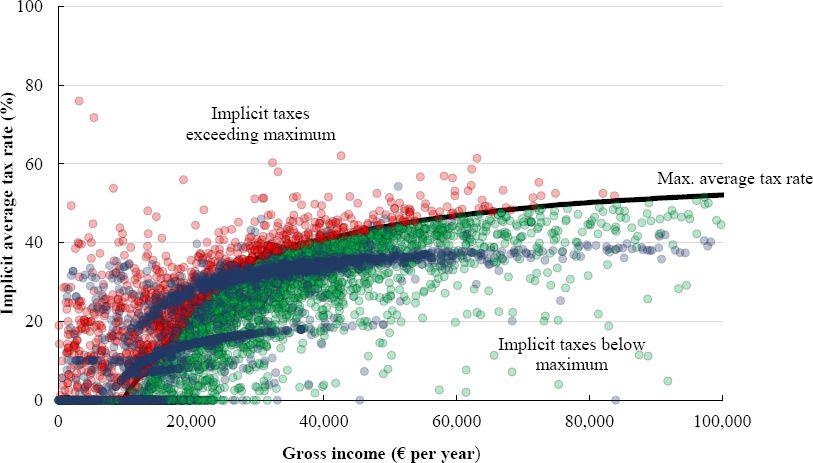
Implicit average tax rates (% of gross income).
Source: SILC 2010, authors’ own calculations.
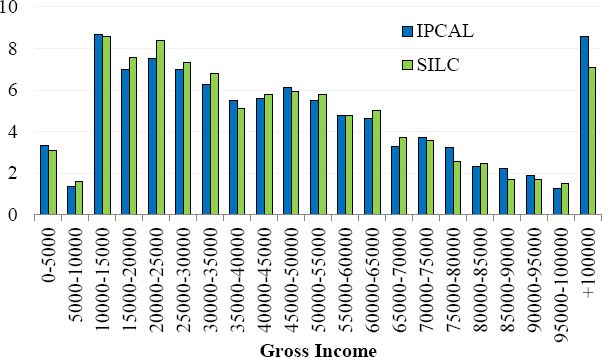
Distribution of total household gross income in IPCAL and SILC (% of observations).
Source: SILC 2010 and IPCAL, authors’ own calculations.

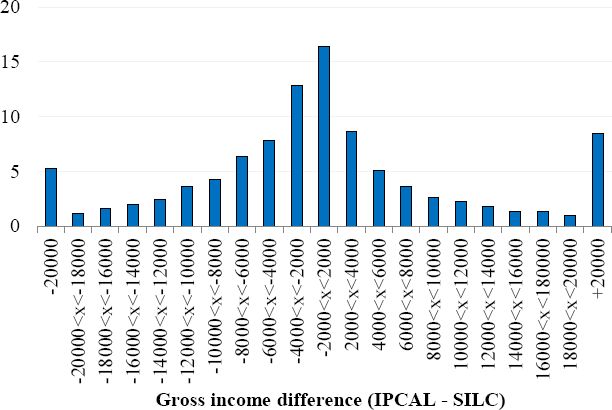
Distribution of differences in total household gross income in IPCAL and SILC (% of observations).
Source: SILC 2010 and IPCAL, authors’ own calculations.

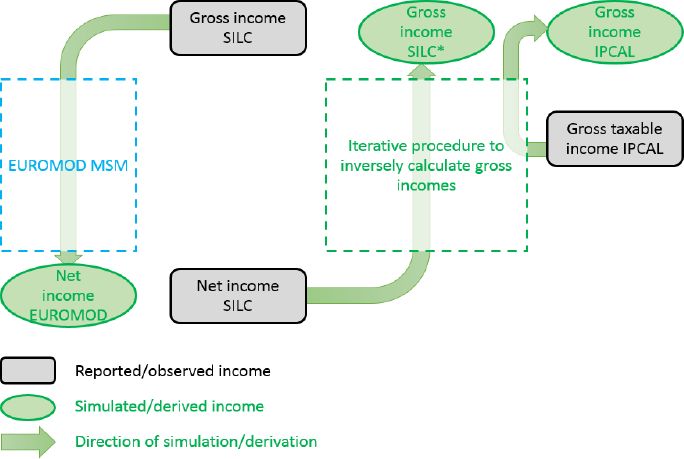
Iterative procedure used to calculate new gross incomes in SILC.

Distribution of household gross income in IPCAL, SILC reported and SILC adjusted (% of observations).
Source: SILC 2010 and IPCAL, authors’ own calculations.

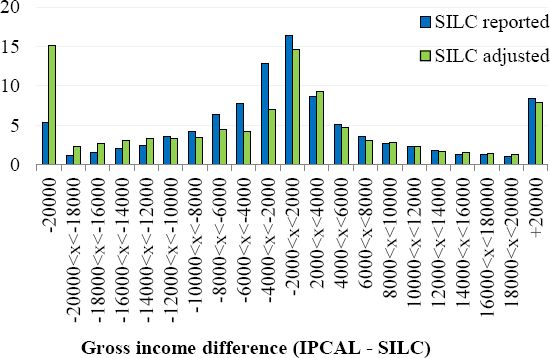
Distribution of differences in household gross income in IPCAL, SILC reported and SILC adjusted (% of observations).
Source: SILC 2010 and IPCAL, authors’ own calculations.
Tables
Imputations per income source.
| Number of observations | Number of imputed values | Imputed values as % of total | |||
|---|---|---|---|---|---|
| Income source | Net | Gross | Net | Gross | |
| Employment | 5,635 | 186 | 424 | 3.3 | 7.5 |
| Self-employment | 714 | 162 | 444 | 22.7 | 62.2 |
| Old age pensions | 2,423 | 331 | 1,165 | 13.7 | 48.1 |
| Survivor pensions | 103 | 7 | 37 | 6.8 | 35.9 |
| Unemployment benefit | 1,441 | 4 | 4 | 0.3 | 0.3 |
| Sickness benefit | 185 | 24 | 99 | 13.0 | 53.5 |
| Disability benefit | 471 | 17 | 202 | 3.6 | 42.9 |
-
Source: SILC 2010.
Number of matched observations.
| Dataset | Matched | Not Matched | Number of observations |
|---|---|---|---|
| EUROMOD | 11,656 | 3,044 | 14,700 |
| SILC (p-file) | 11,656 | 160 | 11,816 |
| IPCAL | 11,656 | 136 | 11,792 |
-
Source: SILC 2010 and IPCAL.
Components of household gross income (HY010) in SILC, included or excluded for comparison with taxable gross income in IPCAL.
| Included | Excluded | ||
|---|---|---|---|
| HY040G | income from rental of a property or land | HY050G | family/children related allowances |
| HY080G | regular inter-household cash transfer received | HY060G | social exclusion not elsewhere classified |
| HY090G | interests, dividends, profit from capital investment in unincorporated businesses | HY070G | housing allowances |
| HY110G | income received by people aged under 16 | PY021G | company car |
| PY010G | employee cash or near cash income | PY140G | education-related allowances |
| PY050G | cash benefits or losses from self-employment | ||
| PY090G | unemployment benefits | ||
| PY100G | old age benefits | ||
| PY110G | survivor benefits | ||
| PY120G | sickness benefits | ||
| PY130G | disability benefits | ||
| PY080G | pension from individual private plans |
Total household gross income: IPCAL vs. SIL.
| Mean income | Mean difference IPCAL – SILC | Standard deviation | Number of observations | ||
|---|---|---|---|---|---|
| IPCAL (€/year) | SILC (€/year) | (€/year) | % | (€/year) | |
| 44,135 | 41,729 | 2,405 | 5.8 | 30,624 | 6,095 |
-
Source: SILC 2010 and IPCAL, authors’ own calculations.
Correspondence of gross income components in SILC and IPCAL (number and % of observations with positive income from income source).
| Number of observations | % of observations | ||||||
|---|---|---|---|---|---|---|---|
| Income source | IPCAL & SILC | IPCAL | SILC | Total | IPCAL & SILC | IPCAL | SILC |
| Employment (1) | 5,592 | 1,298 | 145 | 7,035 | 79.5 | 18.5 | 2.1 |
| Self-employment (2) | 567 | 218 | 307 | 1,092 | 51.9 | 20.0 | 28.1 |
| (1) and (2) | 6,187 | 1,049 | 146 | 7,382 | 83.8 | 14.2 | 2.0 |
| Old age pensions (3) | 2,291 | 298 | 122 | 2,711 | 84.5 | 11.0 | 4.5 |
| Survivor pensions (4) | 92 | 422 | 78 | 592 | 15.5 | 71.3 | 13.2 |
| (3) and (4) | 2,458 | 283 | 50 | 2,791 | 88.1 | 10.1 | 1.8 |
| Unemployment | 1,175 | 847 | 251 | 2,273 | 51.7 | 37.3 | 11.0 |
| Sickness (5) | 142 | 1,213 | 42 | 1,397 | 10.2 | 86.8 | 3.0 |
| Disability (6) | 65 | 498 | 402 | 965 | 6.7 | 51.6 | 41.7 |
| (5) and (6) | 503 | 881 | 136 | 1,520 | 33.1 | 58.0 | 8.9 |
| All | 9,476 | 777 | 164 | 10,417 | 91.0 | 7.5 | 1.6 |
-
Source: SILC 2010 and IPCAL, authors’ own calculations.
Gross income components: IPCAL vs. SILC.
| Mean income | Mean difference IPCAL – SILC | Standard deviation | Number of observations | |||
|---|---|---|---|---|---|---|
| Income source | IPCAL (€/year) | SILC (€/year) | (€/year) | (% of SILC) | (€/year) | |
| Employment (1) | 33,455 | 31,554 | 1,901 | 6% | 8,736 | 5,592 |
| Self-employment (2) | 55,667 | 24,221 | 31,446 | 130% | 66,920 | 567 |
| (1) and (2) | 35,928 | 31,500 | 4,427 | 14% | 22,636 | 6,187 |
| Old age pensions (3) | 17,229 | 17,953 | −723 | −4% | 17,701 | 2,291 |
| Survivor pensions (4) | 14,839 | 13,883 | 955 | 7% | 2591 | 92 |
| (3) and (4) | 18,607 | 17,702 | 904 | 5% | 16,767 | 2,458 |
| Unemployment | 9,270 | 8,767 | 503 | 6% | 7,635 | 1,175 |
| Sickness (5) | 6,097 | 5,591 | 506 | 9% | 3,623 | 142 |
| Disability (6) | 3,907 | 11,914 | -8,007 | -67% | 7,988 | 65 |
| (5) and (6) | 10,608 | 9,932 | 676 | 7% | 5,986 | 503 |
| All | 30,462 | 26,533 | 3,930 | 15% | 23,852 | 9,476 |
-
Source: SILC 2010 and IPCAL, authors’ own calculations.
Gross income components, not imputed: IPCAL vs. SILC.
| Mean income | Mean difference IPCAL – SILC | Standard deviation | Number of observations | |||
|---|---|---|---|---|---|---|
| Income source | IPCAL (€/year) | SILC (€/year) | (€/year) | (% of SILC) | (€/year) | |
| Employment (1) | 33,847 | 31,907 | 1,939 | 6% | 8,491 | 5,019 |
| Self-employment (2) | 63,761 | 27,777 | 35,984 | 130% | 93,942 | 134 |
| (1) and (2) | 34,296 | 31,390 | 2,906 | 9% | 18,281 | 5,390 |
| Old age pensions (3) | 17,395 | 18,370 | -974 | -5% | 19,944 | 1,195 |
| Survivor pensions (4) | 14,839 | 13,883 | 955 | 7% | 2,591 | 92 |
| (3) and (4) | 18,735 | 17,973 | 761 | 4% | 18,682 | 1,321 |
| Unemployment | 9,217 | 8,772 | 444 | 5% | 3,915 | 1,172 |
| Sickness (5) | 6,097 | 5,591 | 506 | 9% | 3623 | 142 |
| Disability (6) | 3,907 | 11,914 | −8,007 | −67% | 7988 | 65 |
| (5) and (6) | 10,608 | 9,932 | 676 | 7% | 5,986 | 503 |
| All | 30,812 | 27,473 | 3,339 | 12% | 22,336 | 7,513 |
-
Source: SILC 2010 and IPCAL, authors’ own calculations.
Gross income components, information used: IPCAL vs. SILC.
| Mean income | Mean difference IPCAL – SILC | Standard deviation | Number of observations | |||
|---|---|---|---|---|---|---|
| Income source | IPCAL (€/year) | SILC (€/year) | (€/year) | (% of SILC) | (€/year) | |
| Employment (1) | 36,293 | 33,991 | 2,302 | 7% | 8,218 | 3,480 |
| Self-employment (2) | 13,040 | 17,194 | −4,154 | −24% | 14,177 | 35 |
| (1) and (2) | 36,488 | 34,076 | 2,412 | 7% | 8,610 | 3,500 |
| Old age pensions (3) | 24,196 | 23,375 | 821 | 4% | 44,093 | 42 |
| Survivor pensions (4) | 15,426 | 13,788 | 1,638 | 12% | 1,871 | 6 |
| (3) and (4) | 23,097 | 21,791 | 1,306 | 6% | 39,898 | 51 |
| Unemployment | 5,731 | 4,926 | 805 | 16% | 4,433 | 268 |
| Sickness (5) | 4,799 | 4,098 | 701 | 17% | 3,111 | 63 |
| Disability (6) | 2,273 | 6,250 | −3,977 | −64% | 5,126 | 23 |
| (5) and (6) | 6,615 | 4,712 | 1,904 | 40% | 5,199 | 98 |
| All | 38,089 | 34,862 | 3,227 | 9% | 16,421 | 3,535 |
-
Source: SILC 2010 and IPCAL, authors’ own calculations.
Gross income components, same socio-economic status throughout the year: IPCAL vs. SILC.
| Mean income | Mean difference IPCAL – SILC | Standard deviation | Number of observations | |||
|---|---|---|---|---|---|---|
| Income source | IPCAL (€/year) | SILC (€/year) | (€/year) | (% of SILC) | (€/year) | |
| Employment (1) | 36,264 | 34,247 | 2,016 | 6% | 14,706 | 4,687 |
| Self-employment (2) | 63,873 | 38,533 | 25,340 | 66% | 73,582 | 325 |
| (1) and (2) | 38,765 | 33,905 | 4,860 | 14% | 23,947 | 5,250 |
| Old age pensions (3) | 17,257 | 17,740 | −483 | −3% | 13,470 | 2,209 |
| Survivor pensions (4) | 15,386 | 14,608 | 778 | 5% | 2,255 | 85 |
| (3) and (4) | 18,682 | 17,524 | 1,158 | 7% | 12,524 | 2,371 |
| Unemployment | 9,544 | 9,356 | 189 | 2% | 4,211 | 567 |
| Sickness (5) | 11,614 | 10,418 | 1,197 | 11% | 4,930 | 31 |
| Disability (6) | 5,216 | 16,065 | −10,850 | −68% | 8,358 | 41 |
| (5) and (6) | 12,942 | 12,472 | 470 | 4% | 6,750 | 343 |
| All | 31,390 | 27,417 | 3,973 | 14% | 22,093 | 8,486 |
-
Source: SILC 2010 and IPCAL, authors’ own calculations.
Gross monthly income from employment, reported gross income vs. adjusted gross income, SILC 2010.
| (1) | (2) | (3) | (4) | (5) | (6) | (7) | |
|---|---|---|---|---|---|---|---|
| Decile | Income | Difference | Implicit tax rate | ||||
| reported net | reported gross | adjusted gross | (3)-(2)in € | (3)-(2) in % of (2) | (2)-(1) in % of (2) | (3)-(1) in % of (3) | |
| 1 | 3,288 | 4,296 | 3,456 | −840 | −19.6 | 23.5 | 4.9 |
| 2 | 10,356 | 13,632 | 12,012 | −1,620 | −11.9 | 24.0 | 13.8 |
| 3 | 14,628 | 20,460 | 19,248 | −1,212 | −5.9 | 28.5 | 24.0 |
| 4 | 17,268 | 24,720 | 24,204 | −516 | −2.1 | 30.1 | 28.7 |
| 5 | 19,224 | 28,116 | 28,908 | 792 | 2.8 | 31.6 | 33.5 |
| 6 | 21,048 | 30,876 | 32,796 | 1,920 | 6.2 | 31.8 | 35.8 |
| 7 | 23,064 | 34,548 | 37,512 | 2,964 | 8.6 | 33.2 | 38.5 |
| 8 | 25,500 | 39,180 | 43,044 | 3,894 | 9.9 | 34.9 | 40.8 |
| 9 | 29,208 | 46,176 | 51,792 | 5,616 | 12.2 | 36.7 | 43.6 |
| 10 | 42,696 | 68,676 | 87,504 | 18,828 | 27.4 | 37.8 | 51.2 |
| Total | 20,616 | 31,056 | 34,032 | 2,976 | 9.6 | 33.6 | 39.4 |
| Number of observations | 5,618 | ||||||
-
Source: SILC 2010, authors’ own calculations.
Gross monthly income from self-employment, reported gross incomes vs. adjusted gross incomes, SILC 2010.
| (1) | (2) | (3) | (4) | (5) | (6) | (7) | |
|---|---|---|---|---|---|---|---|
| Decile | Income | Difference | Implicit tax rate | ||||
| reported net | reported gross | Adjusted gross | (3)-(2)in € | (3)-(2) in % of (2) | (2)-(1) in % of (2) | (3)-(1) in % of (3) | |
| 1 | 1,200 | 1,452 | 4,296 | 2,844 | 195.9 | 17.4 | 72.1 |
| 2 | 5,988 | 7,980 | 9,864 | 1,884 | 23.6 | 25.0 | 39.3 |
| 3 | 10,620 | 13,356 | 16,248 | 2,892 | 21.7 | 20.5 | 34.6 |
| 4 | 14,388 | 18,408 | 22,620 | 4,212 | 22.9 | 21.8 | 36.4 |
| 5 | 17,232 | 21,840 | 27,900 | 6,060 | 27.7 | 21.1 | 38.2 |
| 6 | 19,524 | 25,788 | 35,448 | 9,660 | 37.5 | 24.3 | 44.9 |
| 7 | 22,416 | 28,956 | 41,472 | 12,516 | 43.2 | 22.6 | 45.9 |
| 8 | 27,720 | 35,436 | 55,056 | 19,620 | 55.4 | 21.8 | 49.7 |
| 9 | 34,524 | 46,536 | 72,060 | 25,524 | 54.8 | 25.8 | 52.1 |
| 10 | 58,008 | 76,332 | 128,604 | 52,272 | 68.5 | 24.0 | 54.9 |
| Total | 20,436 | 26,544 | 39,576 | 13,032 | 49.1 | 23.0 | 48.4 |
| Number of observations | 700 | ||||||
-
Source: SILC 2010, authors’ own calculations.
Gross monthly income from an old-age pension, reported gross incomes vs. adjusted gross incomes, SILC 2010.
| (1) | (2) | (3) | (4) | (5) | (6) | (7) | |
|---|---|---|---|---|---|---|---|
| Decile | Income | Difference | Implicit tax rate | ||||
| reported net | reported gross | adjusted gross | (3)-(2)in € | (3)-(2) in % of (2) | (2)-(1) in % of (2) | (3)-(1) in % of (3) | |
| 1 | 3,360 | 3,624 | 3,360 | −264 | −7.3 | 7.3 | 0.0 |
| 2 | 9,576 | 10,068 | 9,576 | −492 | −4.9 | 4.9 | 0.0 |
| 3 | 11,532 | 12,168 | 11,532 | −636 | −5.2 | 5.2 | 0.0 |
| 4 | 12,456 | 13,296 | 12,468 | −828 | −6.2 | 6.3 | 0.1 |
| 5 | 13,380 | 14,448 | 13,428 | −1,020 | −7.1 | 7.4 | 0.4 |
| 6 | 14,544 | 16,128 | 15,144 | −984 | −6.1 | 9.8 | 4.0 |
| 7 | 15,804 | 18,084 | 17,124 | −960 | −5.3 | 12.6 | 7.7 |
| 8 | 17,808 | 21,336 | 21,204 | −121 | −0.6 | 16.5 | 16.0 |
| 9 | 20,448 | 25,16 | 27,276 | 2,160 | 8.6 | 18.6 | 25.0 |
| 10 | 32,856 | 39,324 | 56,712 | 17,338 | 44.2 | 16.4 | 42.1 |
| Total | 15,108 | 17,256 | 18,684 | 1,428 | 8.3 | 12.4 | 19.1 |
| Number of observations | 2,423 | ||||||
-
Source: SILC 2010, authors’ own calculations.
Gross monthly income from a survivor pension, reported gross incomes vs. adjusted gross incomes, SILC 2010.
| (1) | (2) | (3) | (4) | (5) | (6) | (7) | |
|---|---|---|---|---|---|---|---|
| Tertile | Income | Difference | Implicit tax rate | ||||
| reported net | reported gross | adjusted gross | (3)-(2)in € | (3)-(2) in % of (2) | (2)-(1) in % of (2) | (3)-(1) in % of (3) | |
| 1 | 8,916 | 9,120 | 8,916 | −204 | −2.2 | 2.2 | 0.0 |
| 2 | 13,320 | 13,932 | 13,476 | −456 | −3.3 | 4.4 | 1.2 |
| 3 | 17,604 | 19,824 | 19,992 | 168 | 0.8 | 11.2 | 11.9 |
| Total | 13,188 | 14,196 | 14,028 | −168 | −1.2 | 7.1 | 6.0 |
| Number of observations | 103 | ||||||
-
Source: SILC 2010, authors’ own calculations.
Gross monthly income from an unemployment benefit, reported gross incomes vs. adjusted gross incomes, SILC 2010.
| (1) | (2) | (3) | (4) | (5) | (6) | (7) | |
|---|---|---|---|---|---|---|---|
| Decile | Income | Difference | Implicit tax rate | ||||
| reported net | reported gross | adjusted gross | (3)-(2)in € | (3)-(2) in % of (2) | (2)-(1) in % of (2) | (3)-(1) in % of (3) | |
| 1 | 732 | 792 | 792 | 0 | 0.0 | 7.6 | 7.6 |
| 2 | 1,512 | 1,632 | 1,656 | 24 | 1.5 | 7.4 | 8.7 |
| 3 | 2,208 | 2,316 | 2,388 | 72 | 3.1 | 4.7 | 7.5 |
| 4 | 3,324 | 3,480 | 3,552 | 72 | 2.1 | 4.5 | 6.4 |
| 5 | 4,428 | 4,644 | 4,704 | 60 | 1.3 | 4.7 | 5.9 |
| 6 | 5,892 | 6036 | 6,264 | 228 | 3.8 | 2.4 | 5.9 |
| 7 | 8,436 | 8,748 | 8,772 | 24 | 0.3 | 3.6 | 3.8 |
| 8 | 10,392 | 10,584 | 10,716 | 132 | 1.2 | 1.8 | 3.0 |
| 9 | 11,556 | 11,748 | 11,724 | −24 | −0.2 | 1.6 | 1.4 |
| 10 | 15,516 | 15,756 | 15,996 | 240 | 1.5 | 1.5 | 3.0 |
| Total | 6,300 | 6,480 | 6,552 | 72 | 1.1 | 2.8 | 3.8 |
| Number of observations | 1,186 | ||||||
-
Source: SILC 2010, authors’ own calculations.
Gross monthly income from a sickness benefit, reported gross incomes vs. adjusted gross incomes, SILC 2010.
| (1) | (2) | (3) | (4) | (5) | (6) | (7) | |
|---|---|---|---|---|---|---|---|
| Tertile | Income | Difference | Implicit tax rate | ||||
| reported net | reported gross | adjusted gross | (3)-(2)in € | (3)-(2) in % of (2) | (2)-(1) in % of (2) | (3)-(1) in % of (3) | |
| 1 | 1,320 | 1,428 | 1,464 | 36 | 2.5 | 7.6 | 9.8 |
| 2 | 4,596 | 4,872 | 5,100 | 228 | 4.7 | 5.7 | 9.9 |
| 3 | 12,072 | 12,660 | 13,416 | 756 | 6.0 | 4.6 | 10.0 |
| Total | 5,952 | 6,276 | 6,612 | 336 | 5.4 | 5.2 | 10.0 |
| Number of observations | 182 | ||||||
-
Source: SILC 2010, authors’ own calculations.
Gross monthly income from a disability benefit, reported gross incomes vs. adjusted gross incomes, SILC 2010.
| (1) | (2) | (3) | (4) | (5) | (6) | (7) | |
|---|---|---|---|---|---|---|---|
| Tertile | Income | Difference | Implicit tax rate | ||||
| reported net | reported gross | adjusted gross | (3)-(2)in € | (3)-(2) in % of (2) | (2)-(1) in % of (2) | (3)-(1) in % of (3) | |
| 1 | 168 | 600 | 168 | −432 | −72.0 | 72.0 | 0.0 |
| 2 | 480 | 732 | 480 | −252 | −34.4 | 34.4 | 0.0 |
| 3 | 2,100 | 276 | 2,100 | 1,824 | 660.9 | −660.9 | 0.0 |
| Total | 912 | 528 | 912 | 384 | 72.7 | −72.7 | 0.0 |
| Number of observations | 98 | ||||||
-
Source: SILC 2010, authors’ own calculations.
Total gross household income: IPCAL vs. SILC reported and SILC adjusted.
| Mean income | Mean difference IPCAL – SILC | Standard deviation | Number of observations | |||
|---|---|---|---|---|---|---|
| Income source | IPCAL (€/year) | SILC (€/year) | (€/year) | (% of SILC) | (€/year) | |
| SILC reported | 44,135 | 41,729 | 2,405 | 5.8% | 30,624 | 6,095 |
| SILC adjusted | 44,135 | 45,956 | −1,821 | −4.0% | 42,035 | 6,095 |
-
Source: SILC 2010, authors’ own calculations.
Gross income components: IPCAL vs. SILC adjusted.
| Mean income | Mean difference IPCAL – SILC | Standard deviation | Number of observations | |||
|---|---|---|---|---|---|---|
| Income source | IPCAL (€/year) | SILC (€/year) | (€/year) | (% of SILC) | (€/year) | |
| Employment (1) | 33,455 | 34,522 | −1,067 | −3% | 12,128 | 5,592 |
| Self-employment (2) | 55,667 | 34,797 | 20,870 | 60% | 68,014 | 567 |
| (1) and (2) | 35,928 | 35,694 | 234 | 1% | 25,306 | 6,187 |
| Old age pensions (3) | 17,229 | 19,722 | −2,493 | −13% | 42;037 | 2,291 |
| Survivor pensions (4) | 14,839 | 13,528 | 1,311 | 10% | 3,290 | 92 |
| (3) and (4) | 18,607 | 19,339 | −732 | −4% | 40,524 | 2,458 |
| Unemployment | 9,270 | 8,544 | 725 | 8% | 7,635 | 1,175 |
| Sickness (5) | 6,097 | 5,841 | 256 | 4% | 4,496 | 142 |
| Disability (6) | 3,907 | 3,622 | 285 | 8% | 1,582 | 65 |
| (5) and (6) | 10,608 | 9,969 | 639 | 6% | 4,178 | 503 |
| All | 30,462 | 29,673 | 789 | 3% | 31,878 | 9,476 |
-
Source: SILC 2010, authors’ own calculations.