The Eurosystem household finance and consumption survey: A new underlying database for EUROMOD
- University of Antwerp, Belgium
- University of Insubria, ISER University of Essex, CeRP and DONDENA, Italy
- Article
- Figures and data
- Jump to
Figures

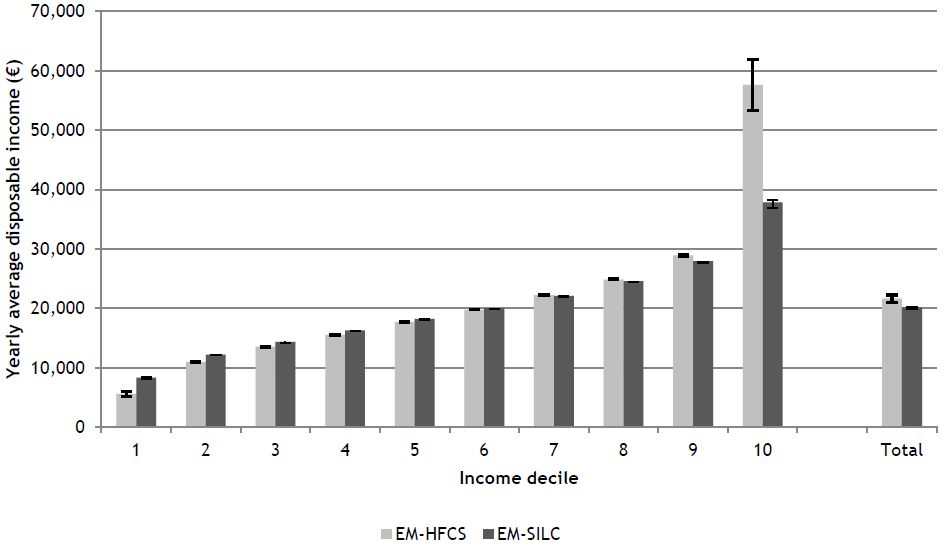
Average disposable income by deciles according to EM-HFCS and EM-SILC, Belgium, 2009.
Source: Own calculations based on EM-HFCS and EM-SILC.
Notes: Decile groups based on disposable income equivalised using the modified OECD equivalence scale, all individuals considered. All figures are derived using sample weights.

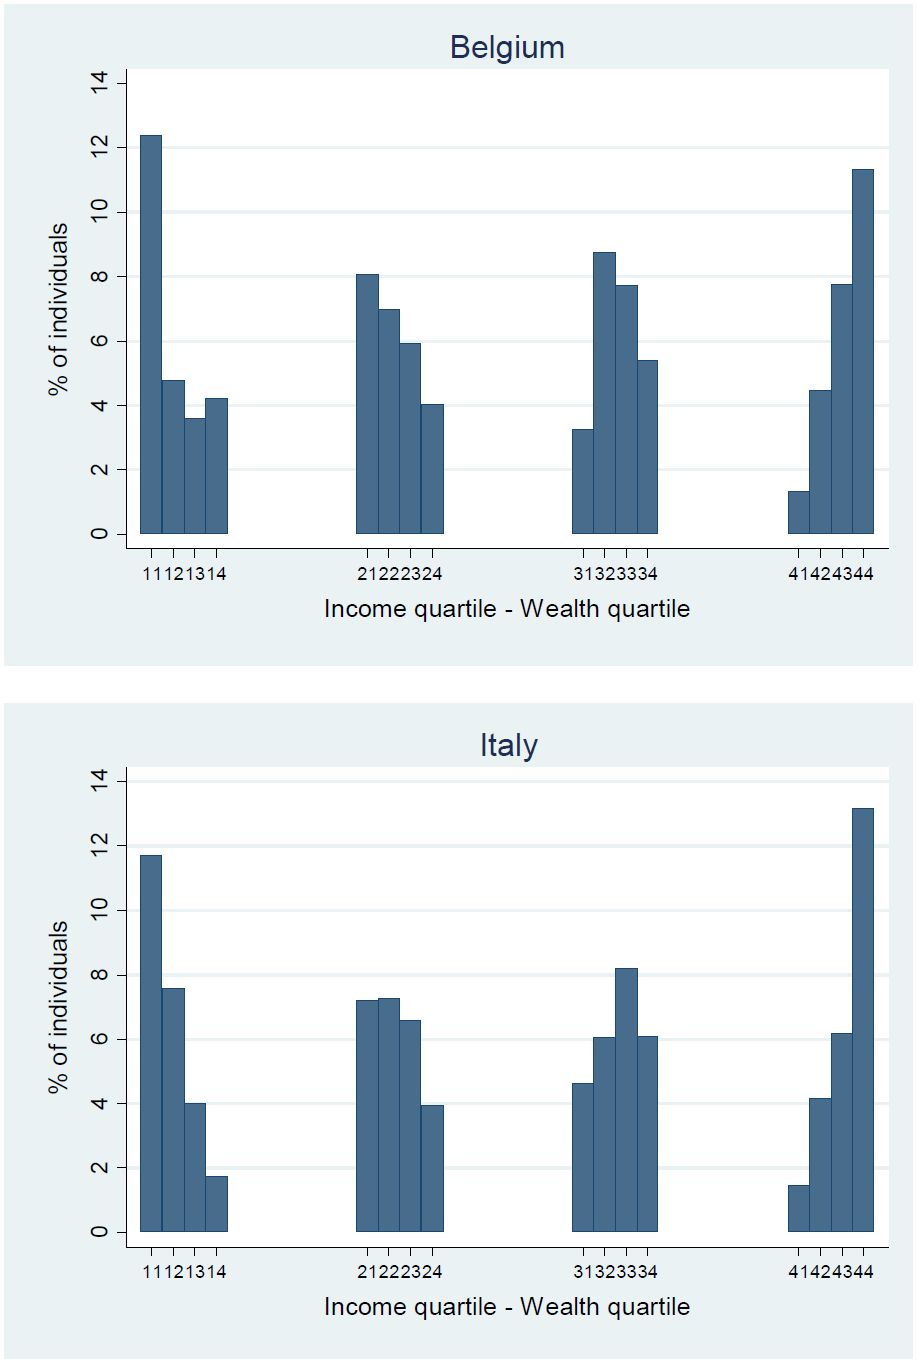
Joint distribution of disposable income and net wealth, Belgium (2009) and Italy (2010).
Source: Own calculations based on EM-HFCS.
Notes: Quartile groups based on disposable income or net wealth equivalised using the modified OECD equivalence scale, all individuals considered. All figures are derived using sample weights.

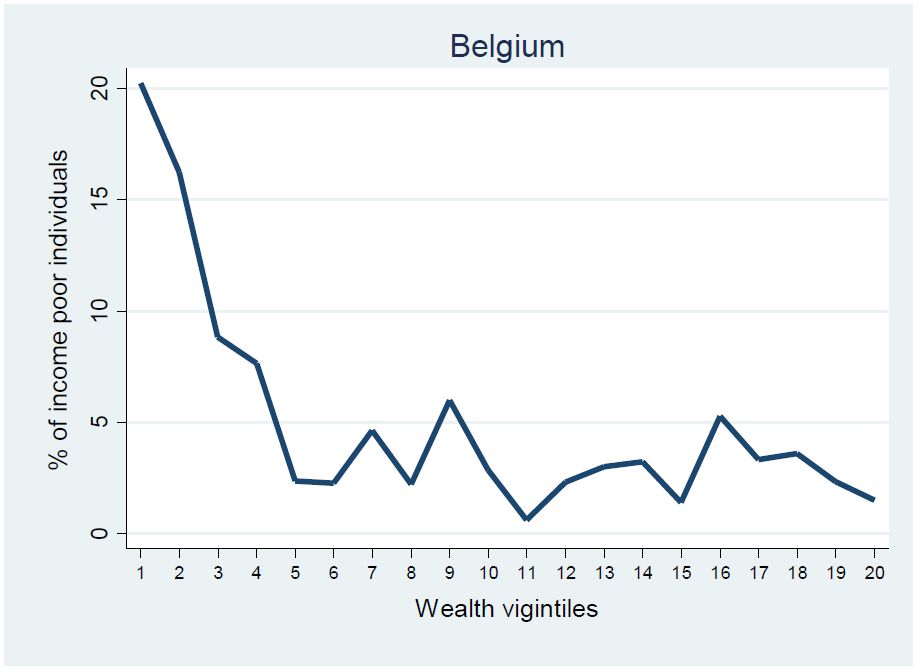
Distribution of income poor across wealth vigintiles, Belgium (2009) and Italy (2010).
Source: Own calculations based on EM-HFCS.
Notes: Vigintile groups based on net wealth equivalised using the modified OECD equivalence scale, all individuals considered. All figures are derived using sample weights.
Tables
Comparison of gross income components HFCS and EU-SILC.
| Category | HFCS | EU-SILC |
|---|---|---|
| Income from work | Cash & near cash employee income | Cash & near cash employee income |
| - - - | Non-cash employee income | |
| Self-employment income | Self-employment income | |
| Capital income | Rental income from real estate property | Rental income from real estate property |
| Income from financial investments | Aggregate variable including interests, dividends and profit from capital investments in unincorporated business | |
| Income from private business other than self-employment | ||
| Pension income | Aggregate variable of public pensions including old-age pensions, survivor pensions, disability pensions | Old-age benefits |
| Survivor benefits | ||
| Occupational & private pensions | Private pensions | |
| Social transfers | Unemployment benefits | Unemployment benefits |
| Aggregate variable of other social transfers including family/children related allowances, housing allowances, education allowances, minimum subsistence, other social benefits | Family/children related allowances | |
| Housing allowances | ||
| Education-related allowances | ||
| Sickness benefits | ||
| Social exclusion not elsewhere classified | ||
| Private transfers | Regular private transfers | Regular private transfers |
| Other income | - - - | Income received by people under 16 |
-
Source: HFCN (2013) & Eurostat (2014)
Comparison of available information in HFCS and EU-SILC.
| Belgium (2009) | Italy (2010) | ||||
|---|---|---|---|---|---|
| EUROMOD based on HFCS | EUROMOD based on EU-SILC | EUROMOD based on HFCS | EUROMOD based on EU-SILC | ||
| Main residence | Tax on property | ||||
| Size in square meters | Number of rooms | ||||
| Property value at time of acquisition, way and year of acquiring property, percent of ownership | - | ||||
| Self-assessed current price value | - | ||||
| Mortgages, up to 3: amount borrowed and still due, year and length of the loan, current interest rate, monthly amount of payment (capital + interests). More than 3: aggregate amount still due and monthly amount payment Missing: number of months paying capital + interests in a year | Annual amount of interests paid on mortgage(s) | Refinement of tax reliefs for mortgage interest repayments | |||
| Other real estate properties | Tax on property | ||||
| Up to 3: self-assessed current price value, property type, percent ownership More than 3: aggregate self-assessed current price value | - | ||||
| Mortgages, up to 3: amount borrowed and still owed, year and length of the loan, current interest rate, monthly amount of payment (capital + interests) More than 3: aggregate amount still due and monthly amount payment Missing: number of months paying capital + interests in a year | - | Tax reliefs for mortgage interest repayments | |||
| Cars | Tax on car property | ||||
| Number and value of cars and other vehicles | - | ||||
| Self-employment business | |||||
| Self-assessed value of the business, number of employees, NACE (Nomenclature statistique des Activités économiques dans la Communauté Européenne), legal form of the business | - | ||||
| Financial assets | Tax on financial assets | ||||
| Value of sight accounts, saving accounts, investments in mutual funds, bonds, shares, managed accounts, other financial assets | - | ||||
| Social security and pension assets | |||||
| Value of social security plans, occupational and voluntary pension schemes | - | Social security wealth | |||
| Contributions to private pension schemes | - | Refinement of tax reliefs for contributions to private pension schemes | |||
| Net wealth | Tax on net wealth, Net wealth means-test for eligibility of benefits | ||||
| All of the above | - | ||||
| Gift and inheritance | Tax on inheritance and gift | ||||
| Gift and inheritance received, number, year, kind of assets, value, from whom received | - | ||||
| Income from real estate property | Income from rental of a property or land | Tax on rental income | |||
| Income from financial assets | Refinement of tax on income from financial assets | ||||
| Income from deposits, mutual funds, bonds, non-self-employment private business, shares, managed accounts, other assets, voluntary pension/whole life insurance | Aggregate income from financial assets | ||||
-
Source: HFCN (2013a & b)
Descriptive statistics of sample and weights.
| Observations | Mean weight | Median weight | Min. weight | Max. weight | |
|---|---|---|---|---|---|
| Belgium | 5,488 | 1,961.1 | 1,274.8 | 149.7 | 12,205.7 |
| Italy | 19,736 | 3,032.6 | 1,826.8 | 3.04 | 22,802.1 |
-
Source: Own calculations based on HFCS.
Comparison of income inequality indicators between HFCS and EU-SILC.
| Belgium (2009) | Italy (2010) | |||
|---|---|---|---|---|
| EUROMOD based on HFCS | EUROMOD based on EU-SILC | EUROMOD based on HFCS | EUROMOD based on EU-SILC | |
| Original income | ||||
| Mean | 24,936 (654.6) | 1,500 (159.8) | 15,025 (116.1) | 15,937 (88.2) |
| Median | 17,904 | 19,755 | 11,820 | 12,568 |
| Gini coefficient | 0.57 (0.01) | 0.48 (0.003) | 0.52 (0.004) | 0.52 (0.002) |
| Disposable income | ||||
| Mean | 21,636 (311.3) | 20,177 (74.7) | 15,269 (75.9) | 16,906 (57.6) |
| Median | 18,847 | 19,067 | 13,235 | 14,899 |
| Gini coefficient | 0.32 (0.01) | 0.23(0.002) | 0.33 (0.003) | 0.33 (0.002) |
| Net wealth | ||||
| Mean | 336,068 (11,942.17) | 272,546 (5,834.23) | ||
| Median | 205,802 | 172,519 | ||
| Gini coefficient | 0.61 (0.01) | 0.61 (0.01) | ||
-
Source: Own calculations based on EM-HFCS and EM-SILC.
-
Notes: Original and disposable income are annual amounts equivalised using the modified OECD equivalence scale, all individuals considered. Wealth amounts are at household level, not equivalised. All figures are derived using sample weights. Standard errors are shown between parentheses.
Comparison between EM-HFCS and EM-SILC of socio-demographic characteristics population, Belgium.
| EM-HFCS | EM-SILC | External Source* | ||
|---|---|---|---|---|
| Age | ||||
| < 16 | 17.7 | 18.2 | 18.1 | |
| 16–29 | 17.5 | 17.5 | 17.4 | |
| 30–44 | 21.3 | 21.0 | 20.5 | |
| 45–64 | 26.4 | 27.0 | 26.9 | |
| > 64 | 17.2 | 16.2 | 17.1 | |
| Gender | ||||
| Female | 51.0 | 50.8 | 50.9 | |
| Male | 49.0 | 49.2 | 49.1 | |
| Highest education achieved** | ||||
| Not completed primary | 12.8 | 18.2 | 15.9 | |
| Primary | 11.5 | 12.8 | 13.2 | |
| Lower secondary | 16.0 | 18.0 | 19.1 | |
| Upper secondary | 30.9 | 25.1 | 22.0 | |
| Post-secondary | 1.8 | 2.4 | ||
| Tertiary | 28.8 | 24.1 | 19.5 | |
| Labour market status | ||||
| Pre-school | 5.9 | 7.3 | 7.0 | |
| Employer or self-employed | 3.7 | 4.1 | 5.8 | |
| Employee | 36.3 | 35.7 | 36.9 | |
| Family worker | 0.1 | 0.2 | 0.7 | |
| Pensioner | 21.0 | 18.6 | 18.3 | |
| Unemployed | 6.5 | 5.1 | 3.6 | |
| Student | 19.8 | 18.1 | 17.6 | |
| Inactive | 0.0 | 1.4 | 1 | |
| Sick or disabled | 2.4 | 3.0 | 10.1 | |
| Other | 4.2 | 6.5 | ||
| Marital status | ||||
| Single | 46.6 | 44.7 | 45.6 | |
| Married | 40.8 | 40.5 | 40.2 | |
| Separated | N.A. | 0.3 | N.A. | |
| Divorced | 6.6 | 8.8 | 7.8 | |
| Widowed | 6.0 | 5.8 | 6.4 | |
| Tenure status | ||||
| Owner paying mortgage | 37.4 | 30.2 | 69.1 | |
| Outright owner | 36.2 | 41.6 | ||
| Tenant at market rate | 24.7 | 19.5 | 29.9 | |
| Tenant at reduced rate | 7.3 | |||
| 1.7 | 1.4 | 1.0 | ||
-
Source: Own calculations based on EM-HFCS and EM-SILC; External: CENSUS 2011 (Eurostat, 2016).
-
Notes: Statistically significant differences (at 5% level) are shown in italics;
-
*
Education and economic status of individuals aged below 15 imputed based on age;
-
**
Highest education achieved in external data unknown for 7.9%. All figures are derived using sample weights.
Comparison between EM-HFCS and EM-SILC of socio-demographic characteristics population, Italy.
| EM-HFCS | EM-SILC | External source* | |
|---|---|---|---|
| Age | |||
| < 16 | 15.1 | 15.0 | 14.9 |
| 16–29 | 15.2 | 14.9 | 14.5 |
| 30–44 | 21.8 | 23.2 | 22.1 |
| 45–64 | 27.5 | 26.7 | 27.6 |
| > 64 | 20.4 | 20.2 | 20.8 |
| Gender | |||
| Female | 51.6 | 51.4 | 51.6 |
| Male | 48.4 | 48.6 | 48.4 |
| Highest education achieved | |||
| Not completed primary | 9.6 | 13.7 | 14.2 |
| Primary | 21.4 | 19.3 | 19.7 |
| Lower secondary | 28.6 | 27.2 | 25.2 |
| Upper secondary | 30.9 | 30.1 | 28.0 |
| Post-secondary | 2.3 | ||
| Tertiary | 9.5 | 9.8 | 10.6 |
| Labour market status | |||
| Pre-school | 4.3 | 5.7 | 5.6 |
| Employer or self-employed | 7.5 | 8.4 | 8.1 |
| Employee | 30.5 | 29.2 | 32.8 |
| Family worker | 0.0 | 0.0 | 0.0 |
| Pensioner | 23.3 | 18.1 | 21.3 |
| Unemployed | 6.1 | 5.0 | 5.0 |
| Student | 17.7 | 15.7 | 14.7 |
| Inactive | 0.2 | 0.0 | 11.4 |
| Sick or disabled | 0.0 | 0.0 | |
| Other | 10.4 | 17.9 | |
| Marital status | |||
| Single | 38.1 | 40.3 | 41.2 |
| Married | 50.8 | 47.5 | 48.7 |
| Separated | N.A. | N.A. | N.A. |
| Divorced | 3.7 | 3.7 | 2.3 |
| Widowed | 7.5 | 8.5 | 7.8 |
| Tenure status | |||
| Owner paying mortgage | 11.6 | 15.4 | 73.0 |
| Outright owner | 58.1 | 56.5 | |
| Tenant at market rate | 20.5 | 18.8 | 17.9 |
| Tenant at reduced rate | |||
| Free user | 9.8 | 9.3 | 9.1 |
-
Source: Own calculations based on EM-HFCS and EM-SILC; External: CENSUS 2011 (Eurostat, 2016).
-
Notes: Statistically significant differences (at 5% level) are shown in italics;
-
*
Education and economic status of individuals aged below 15 imputed based on age. All figures are derived using sample weights.
Comparison between EM-HFCS and EM-SILC of means of different components by decile of equivalised disposable income, Belgium, 2009.
| Decile | Disposable income | Original income | Benefits | Taxes | Social insurance contributions |
|---|---|---|---|---|---|
| EUROMOD 2009 based on HFCS | |||||
| 1 | 5,559 | 1,526 | 4,217 | −19 | 203 |
| 2 | 10,971 | 5,009 | 6,606 | 127 | 516 |
| 3 | 13,526 | 7,982 | 7,117 | 657 | 916 |
| 4 | 15,540 | 11,741 | 6,911 | 1,609 | 1,503 |
| 5 | 17,693 | 15,297 | 7,245 | 2,894 | 1,954 |
| 6 | 19,796 | 19,579 | 6,870 | 4,001 | 2,652 |
| 7 | 22,192 | 25,034 | 6,287 | 5,816 | 3,312 |
| 8 | 24,850 | 30,455 | 6,189 | 7,678 | 4,115 |
| 9 | 28,904 | 38,049 | 6,984 | 10,944 | 5,186 |
| 10 | 57,618 | 95,212 | 8,249 | 36,142 | 9,732 |
| Total | 21,636 | 24,936 | 6,665 | 6,961 | 3,004 |
| EUROMOD 2009 based on EU-SILC | |||||
| 1 | 8,317 | 2,301 | 6,338 | −26 | 350 |
| 2 | 12,184 | 5,452 | 7,845 | 334 | 747 |
| 3 | 14,326 | 7,631 | 8,783 | 1,045 | 1,062 |
| 4 | 16,288 | 12,069 | 7,810 | 1,915 | 1,691 |
| 5 | 18,197 | 16,363 | 6,979 | 3,001 | 2,156 |
| 6 | 20,031 | 21,106 | 5,993 | 4,200 | 2,688 |
| 7 | 22,103 | 25,567 | 5,418 | 5,494 | 3,342 |
| 8 | 24,578 | 30,544 | 5,428 | 7,290 | 4,128 |
| 9 | 27,950 | 37,008 | 5,938 | 10,056 | 4,934 |
| 10 | 37,832 | 57,036 | 6,884 | 19,046 | 7,051 |
| Total | 20,177 | 21,500 | 6,741 | 5,233 | 2,832 |
-
Source: Own calculations based on EM-HFCS and EM-SILC.
-
Note: Annual income components equivalised using the modified OECD equivalence scale. All figures are derived using sample weights.
Comparison between EM-HFCS and EM-SILC of means of different components by decile of equivalised disposable income, Italy, 2010.
| Decile | Disposable income | Original income | Benefits | Taxes | Social insurance contributions |
|---|---|---|---|---|---|
| EUROMOD 2010 based on HFCS | |||||
| 1 | 3,779 | 2,904 | 1,349 | 132 | 341 |
| 2 | 7,371 | 5,629 | 3,011 | 687 | 583 |
| 3 | 8,957 | 6,498 | 4,277 | 1,183 | 635 |
| 4 | 10,392 | 7,126 | 5,600 | 1,623 | 711 |
| 5 | 12,217 | 10,075 | 5,357 | 2,208 | 1,007 |
| 6 | 14,162 | 13,013 | 5,182 | 2,718 | 1,314 |
| 7 | 16,213 | 15,305 | 5,808 | 3,365 | 1,535 |
| 8 | 18,836 | 19,617 | 5,532 | 4,378 | 1,936 |
| 9 | 22,802 | 24,641 | 6,444 | 5,791 | 2,492 |
| 10 | 38,108 | 45,609 | 9,124 | 11,829 | 4,795 |
| Total | 15,269 | 15,025 | 5,164 | 3,387 | 1,533 |
| EUROMOD 2010 based on EU-SILC | |||||
| 1 | 3,296 | 2,326 | 1,395 | 140 | 285 |
| 2 | 7,702 | 5,373 | 3,245 | 366 | 551 |
| 3 | 9,813 | 7,418 | 3,965 | 805 | 764 |
| 4 | 11,804 | 9,246 | 4,987 | 1,495 | 934 |
| 5 | 13,832 | 10,906 | 6,035 | 2,018 | 1,091 |
| 6 | 16,089 | 13,262 | 6,902 | 2,757 | 1,319 |
| 7 | 18,536 | 17,174 | 6,676 | 3,591 | 1,724 |
| 8 | 21,469 | 20,837 | 7,465 | 4,773 | 2,059 |
| 9 | 25,759 | 26,520 | 8,512 | 6,617 | 2,656 |
| 10 | 40,780 | 46,326 | 13,144 | 14,184 | 4,506 |
| Total | 16,906 | 15,937 | 6,232 | 3,674 | 1,589 |
-
Source: Own calculations based on EM-HFCS and EM-SILC.
-
Note: Annual income components equivalised using the modified OECD equivalence scale. All figures are derived using sample weights.
Comparison between tax statistics, EM-HFCS and EM-SILC of tax units and net taxable income, Belgium, 2009.
| Decile/Percentile | Tax statistics | EM-HFCS | EM-SILC | |
|---|---|---|---|---|
| Number of tax units | ||||
| 1 | 615,957.6 | 469,729 | 203,622 | |
| 2 | 615,957.6 | 550,059 | 523,956 | |
| 3 | 615,957.6 | 400,565 | 543,328 | |
| 4 | 615,957.6 | 535,845 | 544,909 | |
| 5 | 615,957.6 | 634,379 | 594,512 | |
| 6 | 615,957.6 | 460,388 | 556,651 | |
| 7 | 615,957.6 | 412,273 | 563,227 | |
| 8 | 615,957.6 | 499,893 | 624,264 | |
| 9 | 615,957.6 | 647,452 | 683,741 | |
| 10 | 615,957.6 | 711,359 | 552,271 | |
| 91 | 61,595.76 | 80,323 | 65,886 | |
| 92 | 61,595.76 | 81,886 | 65,088 | |
| 93 | 61,595.76 | 85,370 | 66,475 | |
| 94 | 61,595.76 | 63,196 | 52,019 | |
| 95 | 61,595.76 | 59,804 | 47,393 | |
| 96 | 61,595.76 | 36,264 | 54,328 | |
| 97 | 61,595.76 | 60,376 | 64,060 | |
| 98 | 61,595.76 | 45,649 | 55,509 | |
| 99 | 61,595.76 | 64,820 | 46,654 | |
| 100 | 61,595.76 | 133,671 | 34,859 | |
| Total | 6,159,576 | 5,078,337 | 5,286,509 | |
| Mean net taxable income | ||||
| 1 | 1,428 | 484 | 929 | |
| 2 | 8,632 | 8,633 | 8,944 | |
| 3 | 12,587 | 12,653 | 12,581 | |
| 4 | 15,427 | 15,465 | 15,466 | |
| 5 | 18,845 | 18,715 | 18,758 | |
| 6 | 22,639 | 22,740 | 22,691 | |
| 7 | 27,133 | 27,159 | 27,223 | |
| 8 | 33,982 | 34,265 | 33,962 | |
| 9 | 45,685 | 46,101 | 45,676 | |
| 10 | 87,118 | 111,794 | 79,162 | |
| 91 | 55,864 | 55,965 | 55,806 | |
| 92 | 58,508 | 58,459 | 58,570 | |
| 93 | 61,493 | 61,349 | 61,358 | |
| 94 | 64,904 | 64,836 | 64,810 | |
| 95 | 68,920 | 68,704 | 68,807 | |
| 96 | 73,909 | 73,258 | 73,970 | |
| 97 | 80,480 | 80,321 | 80,271 | |
| 98 | 90,005 | 89,502 | 89,312 | |
| 99 | 107,397 | 107,016 | 107,013 | |
| 100 | 209,700 | 286,309 | 183,816 | |
| Maximum | / | 2,348,883 | 727,625 | |
| Total | 27,339 | 35,175 | 29,412 | |
-
Source: Directorate-General Statistics, Department Economics of the Belgian Federal Government (2015) and own calculations based on EM-HFCS and EM-SILC.