Microreg: A traditional tax-benefit microsimulation model extended to indirect taxes and in-kind transfers
- IRPET (Regional Institute for Economic Planning of Tuscany), Italy
- Article
- Figures and data
- Jump to
Figures

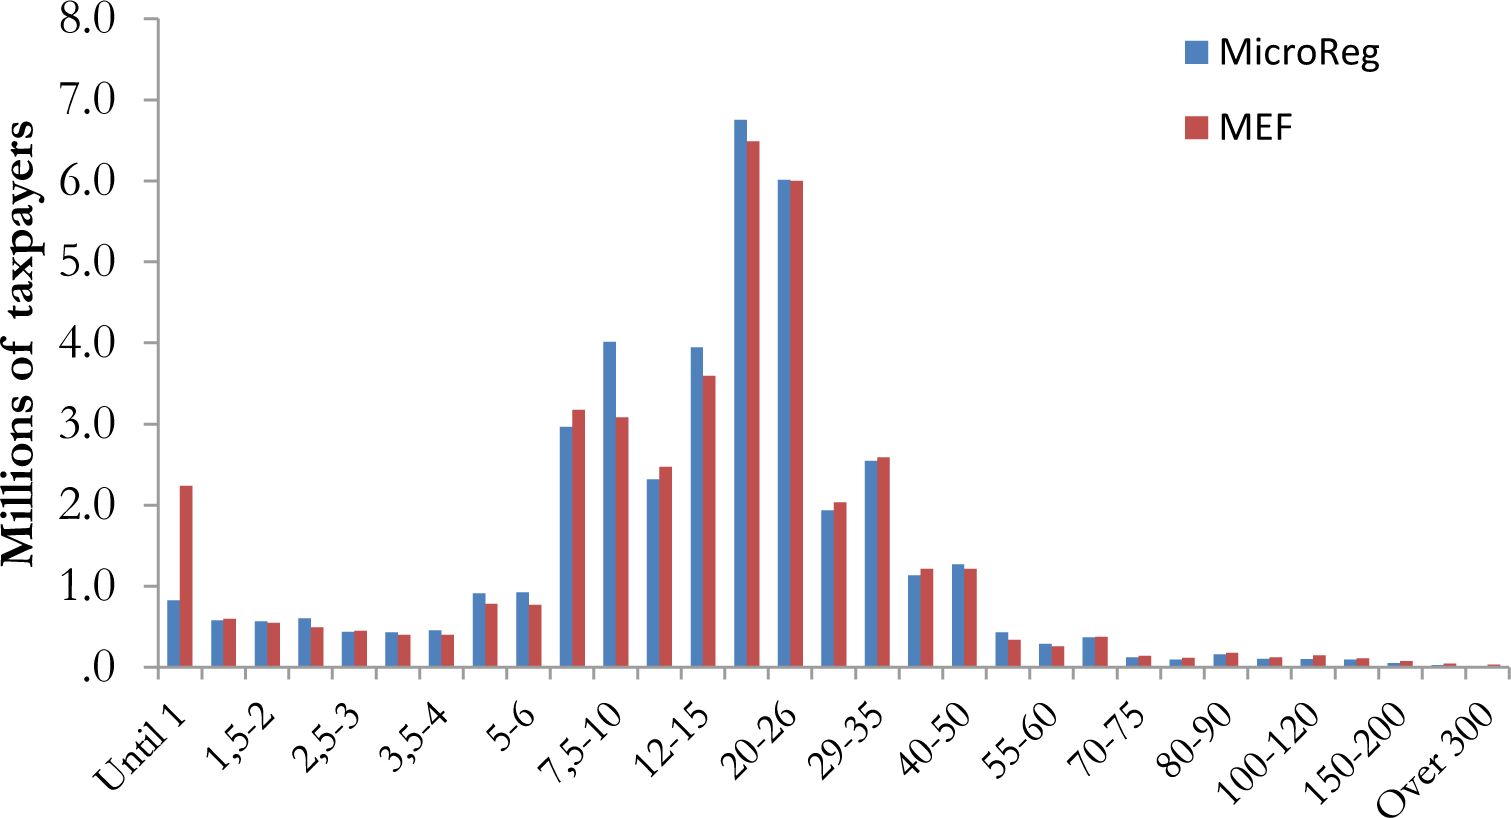
Frequency density function for gross income – income year 2012.
Note: The total number of taxpayers is 40.5 millions.
Source: MicroReg and Ministry of Finance.

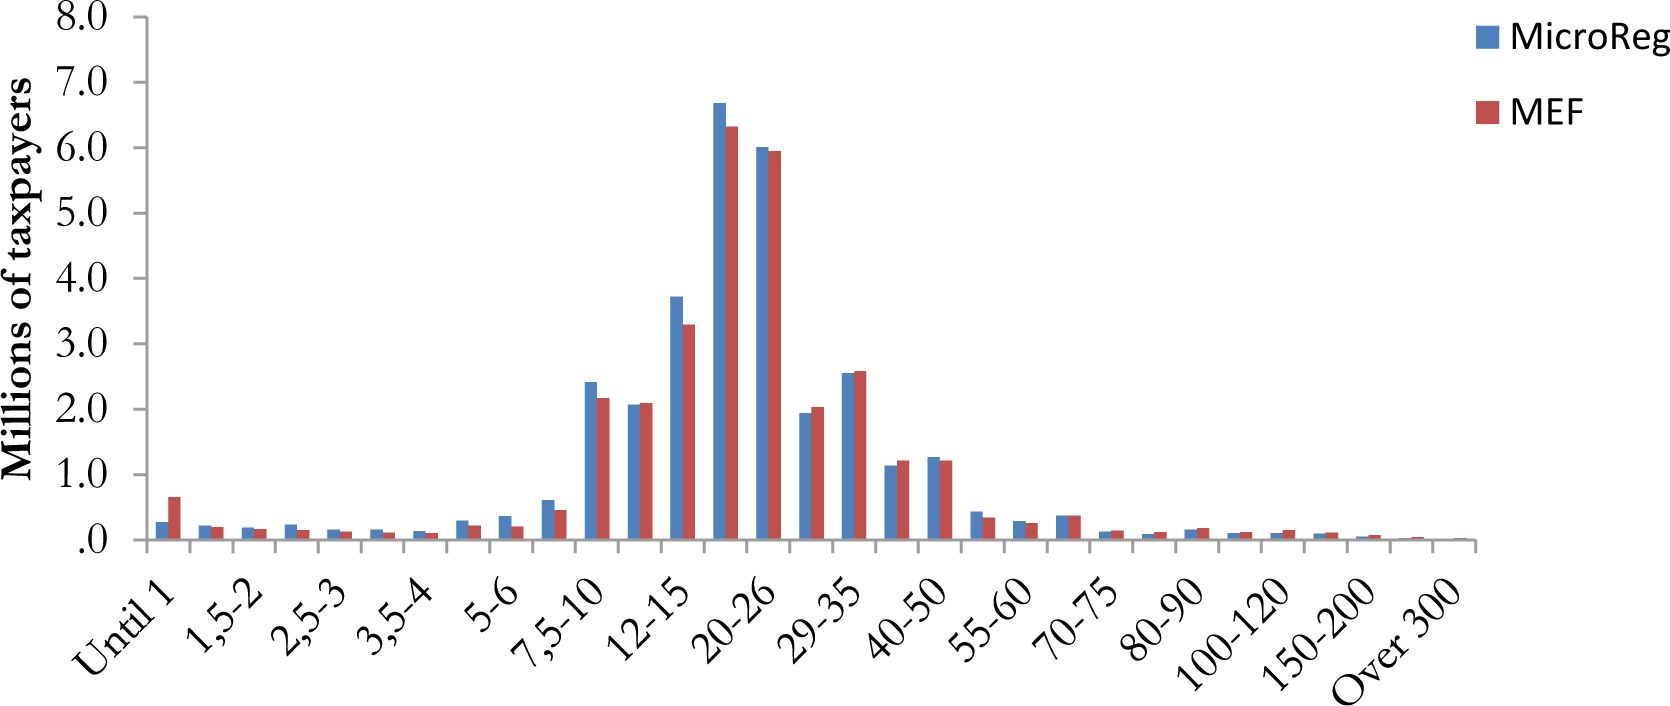
Distribution of taxpayers by gross income classes – net PIT – income year 2012.
Note: The total number of taxpayers with positive net PIT is 32.3 million.
Source: MicroReg and Ministry of Finance.

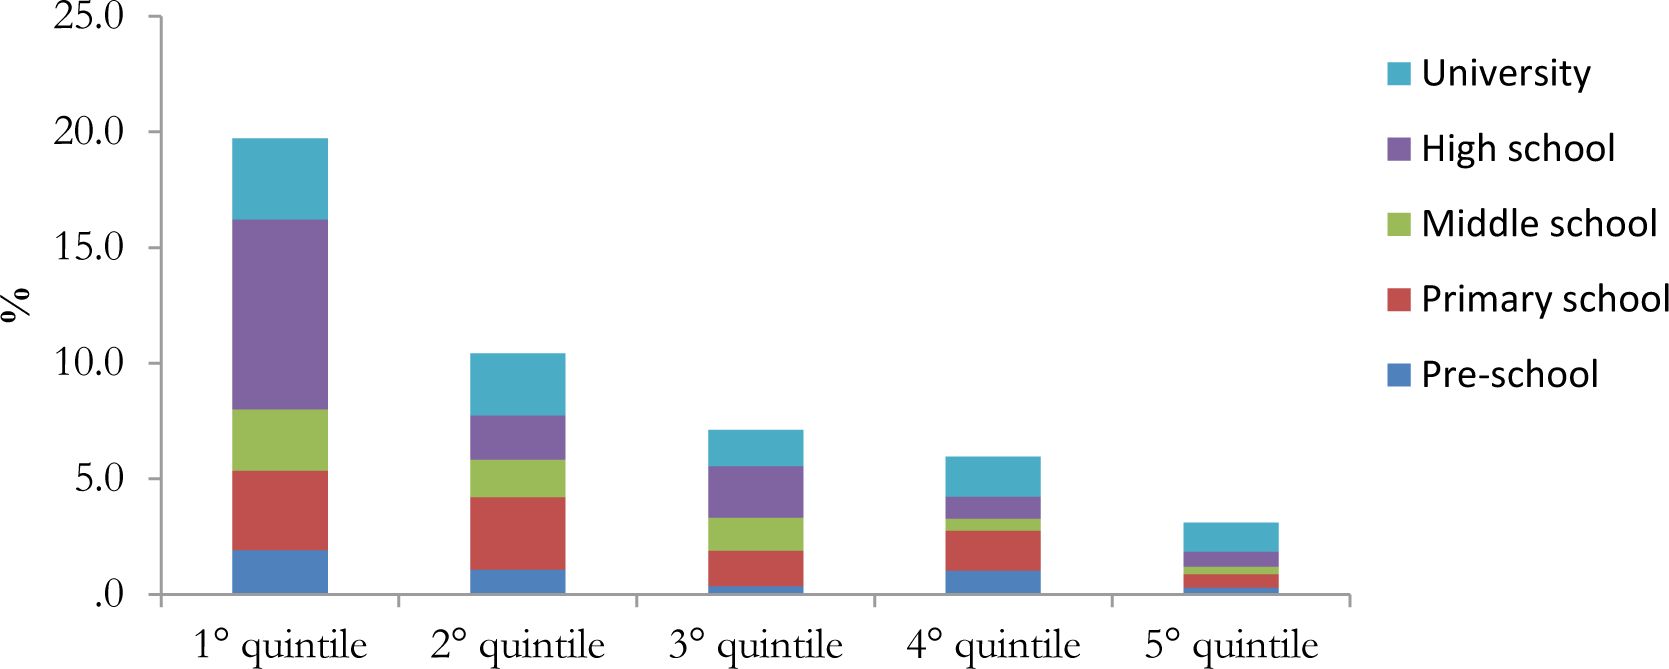
Incidence of education transfers on disposable income by equivalent household disposable income quintile – Tuscany.
Source: MicroReg.

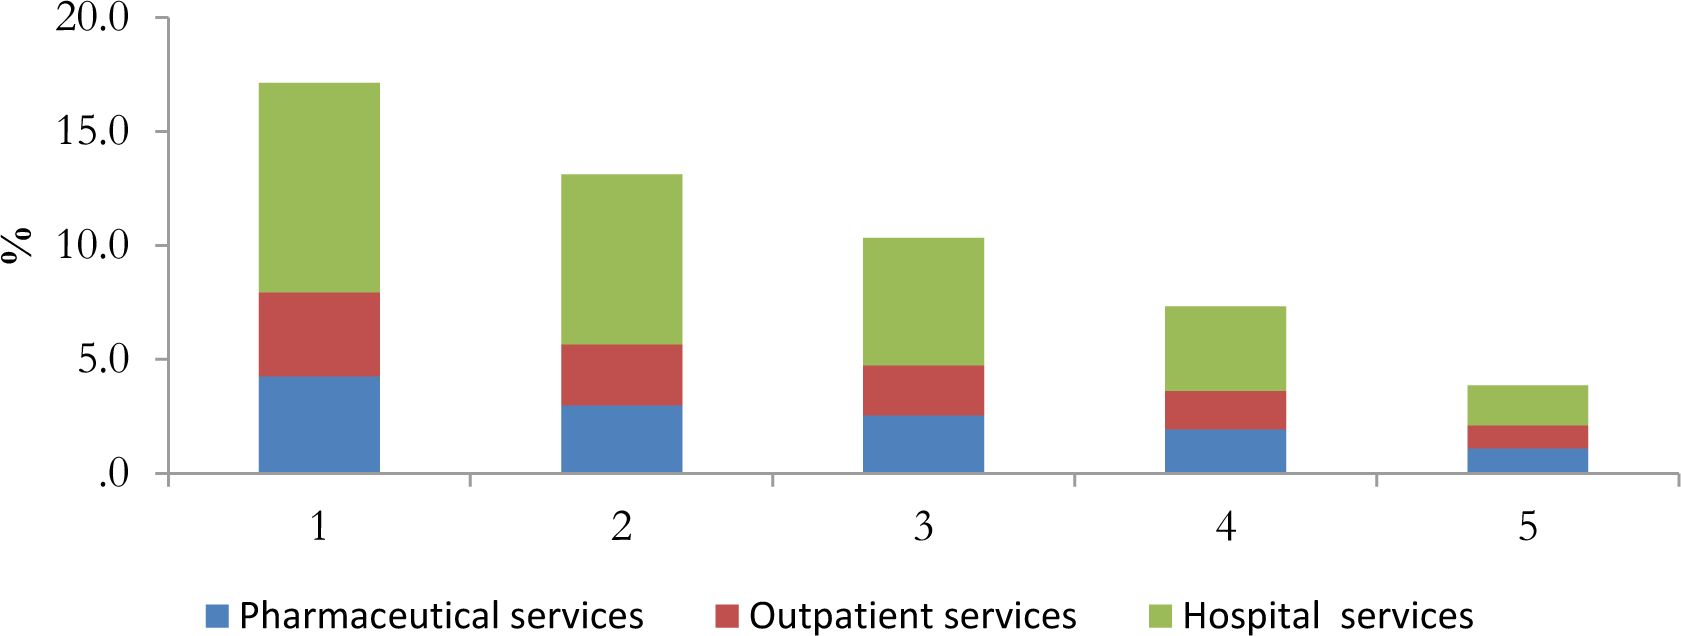
Incidence of health transfers on disposable income by equivalent household disposable income quintile – Tuscany.
Source: MicroReg.

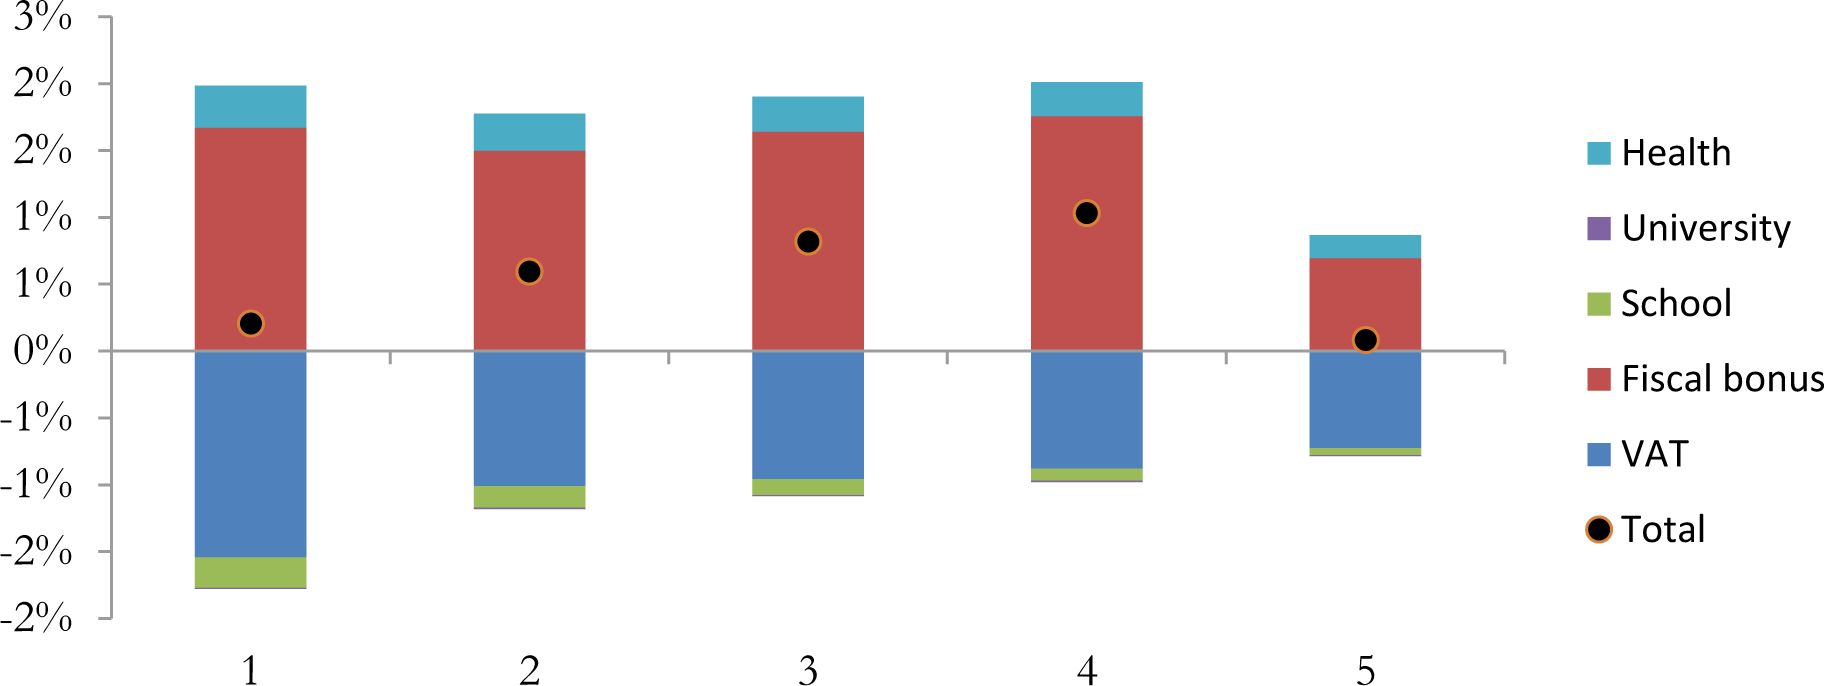
Variation of household disposable income and its components by equivalent disposable income quintiles – Tuscany.
Source: MicroReg.

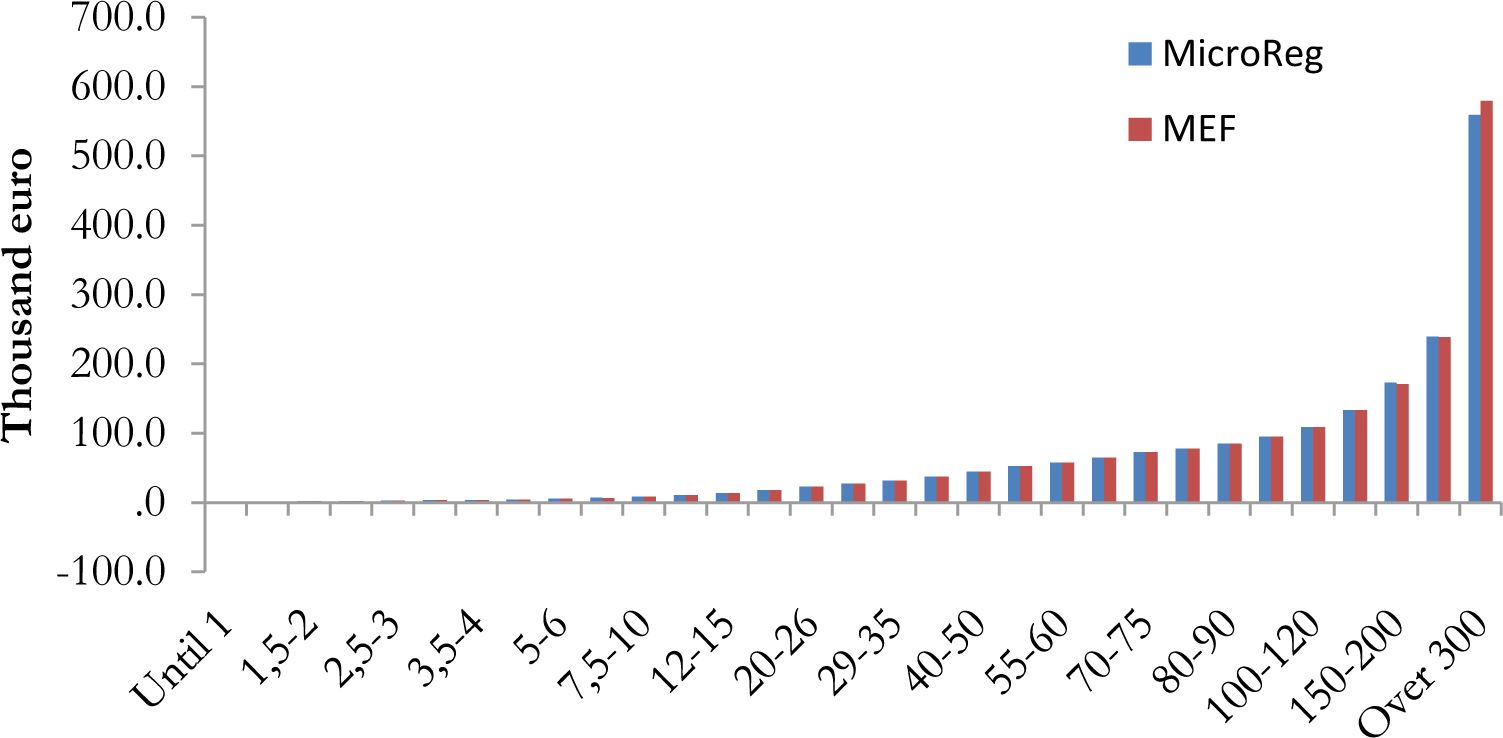
Average value of gross income by gross income classes - income year 2012.
Source: MicroReg and Ministry of Finance.

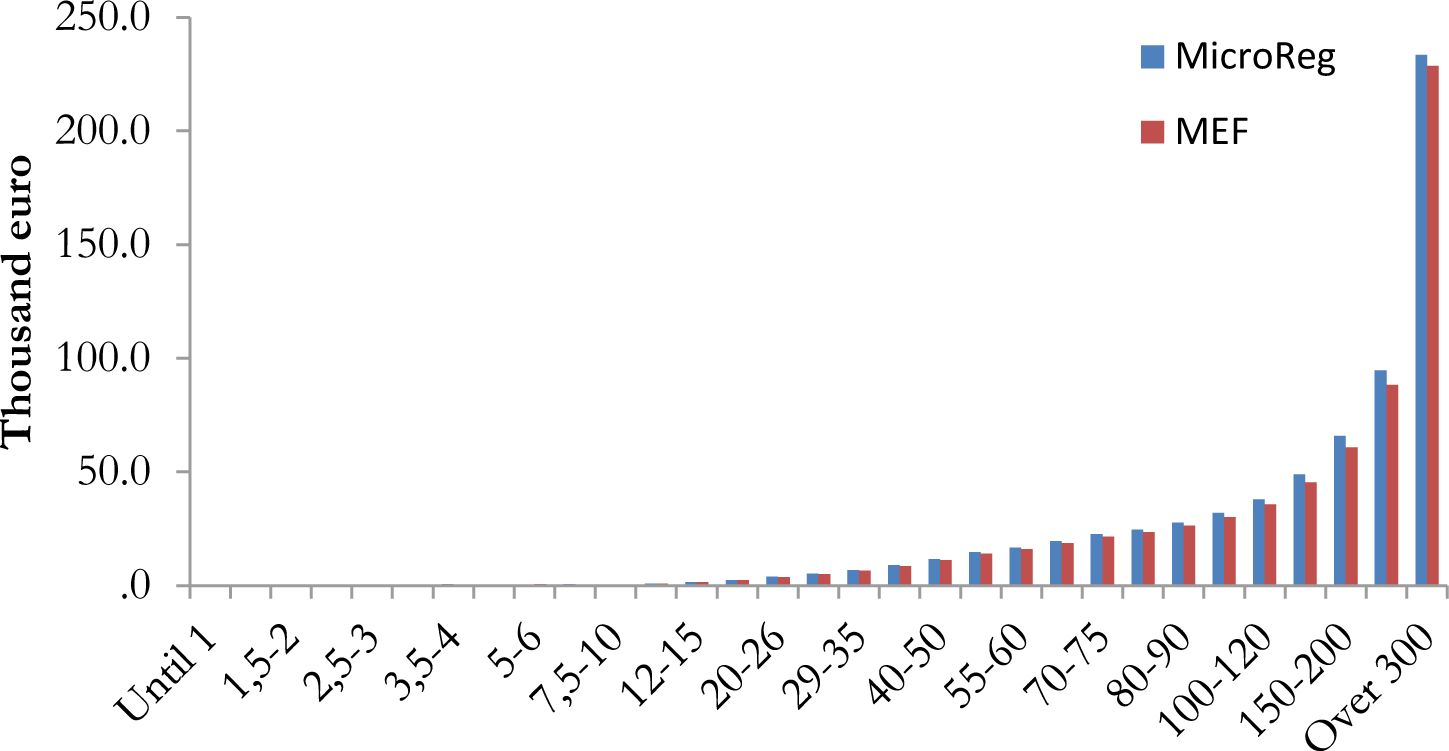
Average value of PIT by gross income classes - income year 2012.
Source: MicroReg and Ministry of Finance.

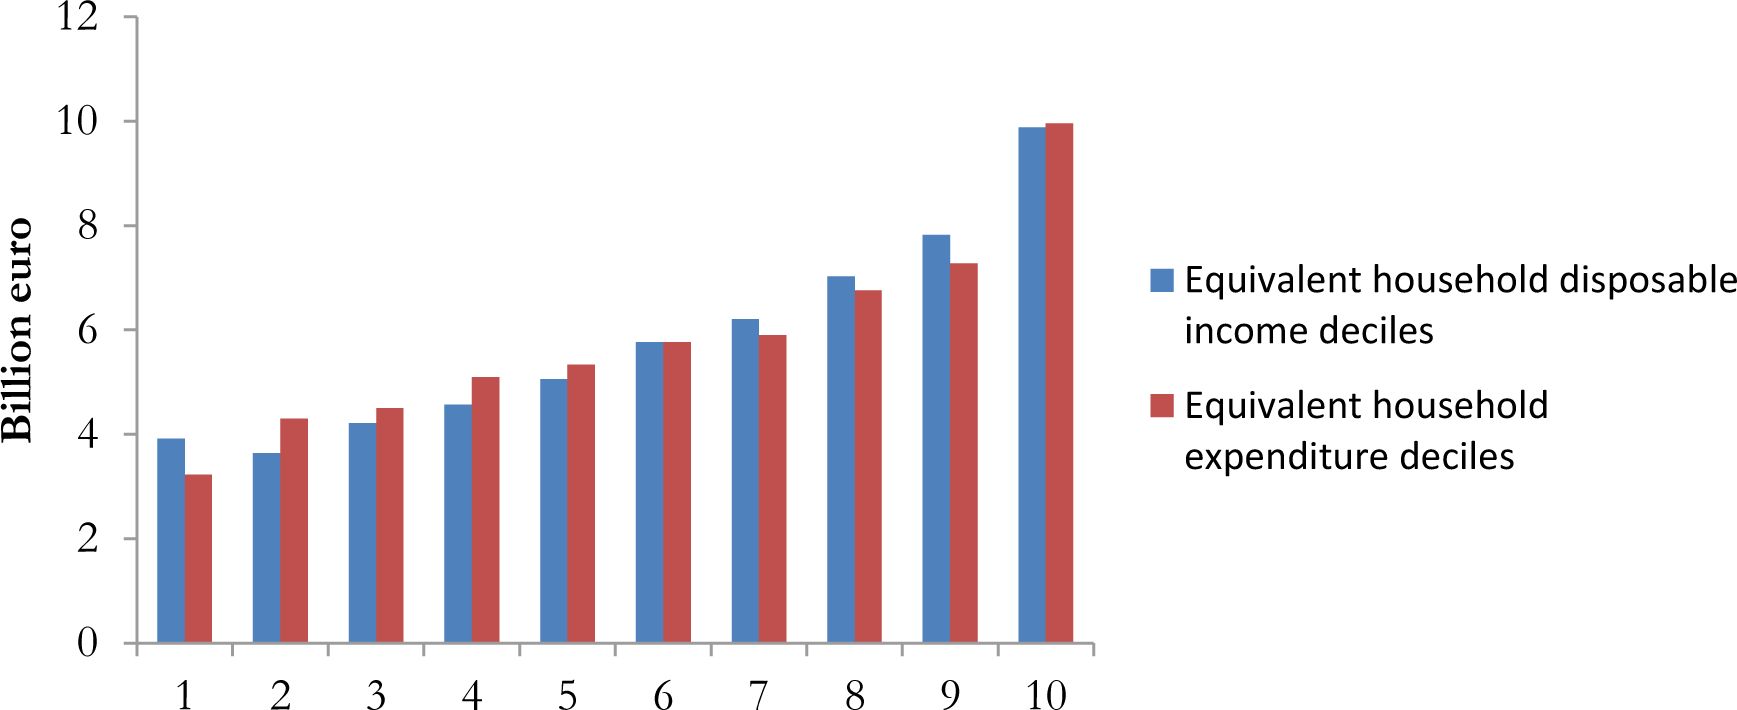
Distribution of VAT revenue by disposable income and expenditure deciles.
Source: MicroReg.
Tables
Validation of the estimation of cadastral value and IMU – billion euro.
| Tax base (cadastral value) | Total tax paid on buildings (IMU) | ||||
|---|---|---|---|---|---|
| MicroReg | Dip. Fin. and Agenzia del Territorio | MicroReg | Dip. Fin. and Agenzia del Territorio | MEF | |
| Dwelling house | 11.6 | 11.4 | 3.8 | 3.3 | 4.0 |
| Other buildings | 5.2 | 9.3 | 6.5 | 9.3 | 19.7 |
| Total | 16.7 | 20.7 | 10.3 | 12.6 | 23.7 |
-
Source: MicroReg, Agenzia del Territorio, Ministry of Finance.
Distribution of the dwelling house and the other buildings by gross income classes.
| Dwelling house MicroReg | Dwelling house MEF | Other buildings MicroReg | ||||
|---|---|---|---|---|---|---|
| Gross income classes (euro) | Households (%) with positive cadastral value | Mean cadastral value (euro) | Households (%) with positive cadastral value | Mean cadastral value (euro) | Households (%) with positive cadastral value | Mean cadastral value (euro) |
| Until 2,500 | 31.5 | 415 | 27.3 | 452 | 19.5 | 374 |
| 2,501 to 5,000 | 32.4 | 383 | 18.4 | 432 | 17.9 | 390 |
| 5,001 to 10,005 | 47.3 | 448 | 26.9 | 405 | 23.8 | 340 |
| 10,006 to 15,000 | 48.2 | 474 | 40.5 | 430 | 26.7 | 379 |
| 15,001 to 26,000 | 54.9 | 484 | 48.4 | 445 | 27.9 | 376 |
| 26,001 to 29,000 | 64.5 | 535 | 59.9 | 492 | 35.9 | 419 |
| 29,001 to 35,000 | 66.6 | 544 | 64.2 | 526 | 40.3 | 480 |
| 35,001 to 50,000 | 67.5 | 585 | 67.8 | 592 | 41.4 | 586 |
| 50,001 to 60,000 | 64.9 | 647 | 69.8 | 683 | 45.9 | 743 |
| 60,001 to 70,000 | 71.1 | 775 | 70.7 | 730 | 45.9 | 626 |
| 70,001 to 100,000 | 72.4 | 797 | 72.0 | 796 | 53.1 | 862 |
| 100,101 to 150,000 | 74.2 | 750 | 72.8 | 916 | 57.3 | 871 |
| 150,001 to 200,000 | 82.6 | 816 | 72.0 | 1,056 | 65.7 | 947 |
| Over 200,000 | 69.9 | 807 | 69.7 | 1,322 | 66.4 | 1564 |
| Total | 52.3 | 501 | 43.8 | 491 | 28.8 | 435 |
-
Source: MicroReg and Ministry of Finance.
Taxpayers by prevailing income source (millions).
| MicroReg | MEF | Diff. (%) | |
|---|---|---|---|
| Employee income | 20.02 | 20.02 | 0.0 |
| Retirement income | 14.22 | 14.22 | 0.0 |
| Self-employed income | 4.60 | 4.60 | 0.0 |
| Other sources of income | 1.69 | 1.68 | 0.3 |
| Total | 40.54 | 40.53 | 0.0 |
-
Source: MicroReg and Ministry of Finance.
Validation of the model – income year 2012 (billion euro).
| MicroReg | MEF | Diff. (%) | |
|---|---|---|---|
| Gross income | 790.9 | 800.4 | −1.2 |
| Deductions | 23.7 | 24.0 | −1.2 |
| Taxable income | 767.2 | 773.6 | −0.8 |
| Gross PIT | 205.1 | 208.2 | −1.5 |
| Tax credits by income source | 41.5 | 41.6 | −0.3 |
| Family tax credits | 11.7 | 11.5 | 2.3 |
| Net PIT | 151.3 | 152.3 | −0.6 |
| Regional additional income tax | 11.0 | 11.0 | −0.5 |
-
Source: MicroReg and Ministry of Finance.
Redistributive indexes.
| PIT | Regional additional income tax | Total | |
|---|---|---|---|
| Pre-tax Gini | 0.4234 | 0.4234 | 0.4234 |
| Post-tax Gini | 0.3714 | 0.4223 | 0.3692 |
| Average tax rate | 0.1913 | 0.0139 | 0.2051 |
| Reynolds-Smolensky net redis. effect | 0.052 | 0.0011 | 0.0543 |
| Kakwani progressivity index | 0.2223 | 0.0769 | 0.2125 |
| Reranking | 0.0005 | 0.0000 | 0.0006 |
-
Source: MicroReg.
Food share by geographical area.
| Area | Expenditure (euro) | Income (euro) | Food share |
|---|---|---|---|
| North West | 487.5 | 2,454.80 | 0.1986 |
| North East | 446.1 | 2,450.70 | 0.182 |
| Centre | 504.3 | 2,356.50 | 0.214 |
| South | 506.7 | 1,893.80 | 0.2675 |
| Italy | 488.7 | 2,259.20 | 0.2163 |
-
Source: MicroReg.
Propensity to consume by income deciles.
| Decile | Italy |
|---|---|
| 0 | 1.26 |
| 1 | 1.07 |
| 2 | 0.96 |
| 3 | 0.93 |
| 4 | 0.87 |
| 5 | 0.83 |
| 6 | 0.78 |
| 7 | 0.76 |
| 8 | 0.69 |
| 9 | 0.56 |
| Total | 0.92 |
-
Source: MicroReg.
VAT tax base and revenue (billion euro).
| VAT rate | Tax base | Tax revenue |
|---|---|---|
| 4% | 77.9 | 3.1 |
| 10% | 166.8 | 16.7 |
| 22% | 174.2 | 38.3 |
| Total | 418.8 | 58.1 |
-
Source: MicroReg.
Redistributive indexes.
| VAT rate | 4% | 10% | 22% | Total |
|---|---|---|---|---|
| Pre-tax Gini | 0.3009 | 0.3009 | 0.3009 | 0.3009 |
| Post-tax Gini | 0.3017 | 0.3040 | 0.3059 | 0.3102 |
| Average Tax Rate | 0.0039 | 0.0208 | 0.0470 | 0.0717 |
| Reynolds-Smolensky net redis. effect | −0.0008 | −0.0031 | −0.0050 | −0.0093 |
| Kakwani progressivity index | −0.2116 | −0.1426 | −0.0931 | −0.1139 |
| Re-ranking | 0.0000 | 0.0001 | 0.0004 | 0.0005 |
-
Source: MicroReg.
Redistributive indexes for in-kind transfers – Tuscany.
| Pre-transfer Gini | Post-transfer Gini | Avg. tax rate | Reynolds-Smolensky net redis. effect | Kakwani Progressivity index | Re-ranking | |
|---|---|---|---|---|---|---|
| Pre-school | 0.2838 | 0.2825 | 0.0050 | 0.0013 | 0.3186 | 0.0002 |
| Primary school | 0.2838 | 0.2808 | 0.0113 | 0.0030 | 0.3268 | 0.0006 |
| Middle school | 0.2838 | 0.2814 | 0.0068 | 0.0024 | 0.4062 | 0.0004 |
| High school | 0.2838 | 0.2776 | 0.0134 | 0.0062 | 0.5221 | 0.0007 |
| Total school | 0.2838 | 0.2712 | 0.0365 | 0.0126 | 0.4122 | 0.0019 |
| University | 0.2838 | 0.2824 | 0.0127 | 0.0014 | 0.2165 | 0.0014 |
| Pharmaceutical services | 0.2838 | 0.2802 | 0.0147 | 0.0036 | 0.2585 | 0.0001 |
| Outpatient services | 0.2838 | 0.2806 | 0.0129 | 0.0032 | 0.2544 | 0.0001 |
| Hospital services | 0.2838 | 0.2792 | 0.0305 | 0.0047 | 0.3250 | 0.0050 |
| Total health services | 0.2838 | 0.2731 | 0.0582 | 0.0107 | 0.2924 | 0.0054 |
-
Source: MicroReg.
Fiscal bonus scheme.
| Income (euro) | Fiscal bonus (euro) |
|---|---|
| Under 24,000 | 960 |
| Between 24,000 and 26,000 | 960* [1−(income−24,000)/(26,000–24,000)] |
| Over 26,000 | 0 |
-
Source: Stability Law for 2015.
VAT rates: safeguard clause.
| Year | Ordinary rate | Decreased rate |
|---|---|---|
| 2015 | 22% | 10% |
| 2016 | 24% | 12% |
| 2017 | 25% | 13% |
| 2018 | 25.5% | 13% |
-
Source: Stability Law for 2015.
Education and health expenditure (million euro) — Italy.
| Year | School | University | Health |
|---|---|---|---|
| 2013 | 41,899 | 6,997 | 110,044 |
| 2016 | 41,028 | 6,931 | 113,372 |
-
Source: DEF 2015 and budget of the State.
Redistributive indexes – Tuscany.
| Gini | Theil | |
|---|---|---|
| Original disposable income | 0.2836 | 0.1450 |
| Disposable income with VAT increase | 0.2851 | 0.1470 |
| Disposable income with fiscal bonus | 0.2815 | 0.1426 |
| Disposable income with variation in school expenditure | 0.2838 | 0.1451 |
| Disposable income with variation in university expenditure | 0.2836 | 0.1450 |
| Disposable income with variation in health expenditure | 0.2834 | 0.1447 |
| Final disposable income | 0.2829 | 0.1445 |
-
Source: MicroReg.
Validation of the model - income year 2012 (billion euro).
| Gross income | Deductions | Taxable income | Gross PIT | |||||
|---|---|---|---|---|---|---|---|---|
| Micro Reg | MEF | Micro Reg | MEF | Micro Reg | MEF | Micro Reg | MEF | |
| Piedmont | 67.5 | 66.8 | 2.0 | 2.1 | 65.5 | 64.4 | 17.5 | 17.3 |
| Aosta valley | 2.1 | 2.1 | 0.1 | 0.1 | 2.1 | 2.0 | 0.6 | 0.5 |
| Lombardy | 164.5 | 163.6 | 5.0 | 5.1 | 159.5 | 157.6 | 44.0 | 44.0 |
| Liguria | 23.8 | 25.1 | 0.7 | 0.8 | 23.1 | 24.2 | 6.3 | 6.5 |
| Trento | 8.4 | 8.3 | 0.3 | 0.3 | 8.2 | 8.0 | 2.2 | 2.1 |
| Bolzano | 8.5 | 8.8 | 0.3 | 0.3 | 8.2 | 8.5 | 2.2 | 2.3 |
| Veneto | 69.9 | 71.8 | 2.0 | 2.6 | 67.9 | 69.0 | 18.1 | 18.5 |
| Friuli Venezia Giulia | 18.2 | 19.0 | 0.5 | 0.6 | 17.7 | 18.4 | 4.6 | 4.9 |
| Emilia Romagna | 71.4 | 70.9 | 2.1 | 2.5 | 69.3 | 68.0 | 18.6 | 18.4 |
| Tuscany | 54.1 | 54.4 | 1.6 | 1.8 | 52.5 | 52.3 | 13.8 | 14.0 |
| Umbria | 11.6 | 11.8 | 0.3 | 0.4 | 11.3 | 11.4 | 2.9 | 3.0 |
| Marche | 19.7 | 20.6 | 0.6 | 0.8 | 19.1 | 19.8 | 5.0 | 5.2 |
| Lazio | 84.3 | 83.2 | 2.6 | 1.9 | 81.6 | 80.7 | 22.5 | 22.6 |
| Abruzzo | 14.2 | 15.3 | 0.4 | 0.4 | 13.8 | 14.9 | 3.5 | 3.9 |
| Molise | 3.1 | 3.3 | 0.1 | 0.1 | 3.0 | 3.2 | 0.8 | 0.8 |
| Campania | 49.3 | 50.5 | 1.5 | 1.1 | 47.8 | 49.3 | 12.6 | 12.9 |
| Apulia | 38.2 | 39.0 | 1.1 | 1.0 | 37.0 | 38.1 | 9.3 | 9.8 |
| Basilicata | 5.1 | 5.7 | 0.2 | 0.2 | 4.9 | 5.5 | 1.3 | 1.4 |
| Calabria | 18.4 | 17.0 | 0.6 | 0.4 | 17.8 | 16.7 | 4.6 | 4.2 |
| Sicily | 39.4 | 45.0 | 1.2 | 1.0 | 38.2 | 44.2 | 9.7 | 11.4 |
| Sardinia | 19.2 | 17.9 | 0.6 | 0.5 | 18.7 | 17.5 | 4.9 | 4.5 |
| Total | 790.9 | 800.4 | 23.7 | 24.0 | 767.2 | 773.6 | 205.1 | 208.2 |
-
Source: MicroReg and Ministry of Finance.
Validation of the model - income year 2012 (billion euro).
| Tax credits by income source | Family tax credits | Net PIT | Regional additional income tax | |||||
|---|---|---|---|---|---|---|---|---|
| MicroReg | MEF | MicroReg | MEF | MicroReg | MEF | MicroReg | MEF | |
| Piedmont | 3.2 | 3.2 | 0.8 | 0.7 | 13.3 | 12.9 | 1.0 | 1.0 |
| Aosta valley | 0.1 | 0.1 | 0.0 | 0.0 | 0.4 | 0.4 | 0.0 | 0.0 |
| Lombardy | 7.0 | 6.9 | 1.7 | 1.6 | 34.8 | 34.0 | 2.2 | 2.2 |
| Liguria | 1.2 | 1.2 | 0.2 | 0.2 | 4.8 | 4.9 | 0.3 | 0.3 |
| Trento | 0.4 | 0.4 | 0.1 | 0.1 | 1.7 | 1.5 | 0.1 | 0.1 |
| Bolzano | 0.3 | 0.4 | 0.1 | 0.1 | 1.8 | 1.8 | 0.0 | 0.1 |
| Veneto | 3.5 | 3.6 | 0.9 | 0.9 | 13.5 | 13.5 | 0.8 | 0.8 |
| Friuli Venezia Giulia | 0.9 | 1.0 | 0.2 | 0.2 | 3.5 | 3.6 | 0.2 | 0.2 |
| Emilia Romagna | 3.3 | 3.4 | 0.7 | 0.7 | 14.4 | 13.7 | 1.1 | 1.1 |
| Tuscany | 2.7 | 2.8 | 0.7 | 0.6 | 10.3 | 10.3 | 0.6 | 0.6 |
| Umbria | 0.7 | 0.7 | 0.1 | 0.2 | 2.0 | 2.1 | 0.1 | 0.1 |
| Marche | 1.2 | 1.2 | 0.3 | 0.3 | 3.5 | 3.6 | 0.2 | 0.3 |
| Lazio | 3.9 | 3.6 | 1.1 | 1.0 | 17.4 | 17.6 | 1.3 | 1.3 |
| Abruzzo | 1.0 | 1.0 | 0.3 | 0.3 | 2.3 | 2.6 | 0.2 | 0.2 |
| Molise | 0.2 | 0.2 | 0.1 | 0.1 | 0.5 | 0.5 | 0.1 | 0.1 |
| Campania | 3.3 | 3.2 | 1.9 | 1.4 | 8.2 | 8.6 | 0.9 | 0.9 |
| Apulia | 2.6 | 2.7 | 1.1 | 1.0 | 5.9 | 6.3 | 0.5 | 0.5 |
| Basilicata | 0.4 | 0.4 | 0.2 | 0.1 | 0.8 | 0.9 | 0.1 | 0.1 |
| Calabria | 1.4 | 1.4 | 0.4 | 0.4 | 2.9 | 2.7 | 0.3 | 0.3 |
| Sicily | 3.0 | 3.1 | 1.5 | 1.2 | 5.8 | 7.5 | 0.6 | 0.7 |
| Sardinia | 1.1 | 1.1 | 0.4 | 0.3 | 3.4 | 3.1 | 0.2 | 0.2 |
| Total | 41.5 | 41.6 | 12.8 | 11.5 | 151.3 | 152.3 | 11.0 | 11.0 |
-
Source: MicroReg and Ministry of Finance.
VAT tax base and revenue (billion euro).
| Tax base | Tax revenue | |||||||
|---|---|---|---|---|---|---|---|---|
| Region/VAT rate | 4% | 10% | 22% | Total | 4% | 10% | 22% | Total |
| Piedmont | 6.5 | 14.1 | 13.7 | 34.3 | 0.3 | 1.4 | 3.0 | 4.7 |
| Aosta valley | 0.2 | 0.4 | 0.4 | 1.0 | 0.0 | 0.0 | 0.1 | 0.1 |
| Lombardy | 14.5 | 32.2 | 33.7 | 80.4 | 0.6 | 3.2 | 7.4 | 11.2 |
| Bolzano | 0.7 | 1.5 | 1.8 | 4.0 | 0.0 | 0.1 | 0.4 | 0.6 |
| Trento | 0.7 | 1.6 | 1.7 | 4.0 | 0.0 | 0.2 | 0.4 | 0.6 |
| Veneto | 6.2 | 14.3 | 15.6 | 36.1 | 0.2 | 1.4 | 3.4 | 5.1 |
| Friuli Venezia Giulia | 1.7 | 3.8 | 4.2 | 9.6 | 0.1 | 0.4 | 0.9 | 1.4 |
| Liguria | 2.4 | 5.1 | 5.1 | 12.6 | 0.1 | 0.5 | 1.1 | 1.7 |
| Emilia Romagna | 5.8 | 13.9 | 15.1 | 34.8 | 0.2 | 1.4 | 3.3 | 4.9 |
| Tuscany | 5.2 | 10.9 | 11.8 | 27.9 | 0.2 | 1.1 | 2.6 | 3.9 |
| Umbria | 1.2 | 2.4 | 2.6 | 6.2 | 0.0 | 0.2 | 0.6 | 0.9 |
| Marche | 2.0 | 4.1 | 4.3 | 10.3 | 0.1 | 0.4 | 0.9 | 1.4 |
| Lazio | 8.0 | 17.1 | 19.1 | 44.2 | 0.3 | 1.7 | 4.2 | 6.2 |
| Abruzzo | 1.6 | 3.3 | 3.5 | 8.3 | 0.1 | 0.3 | 0.8 | 1.2 |
| Molise | 0.4 | 0.8 | 0.7 | 1.8 | 0.0 | 0.1 | 0.2 | 0.2 |
| Campania | 6.0 | 11.9 | 11.6 | 29.5 | 0.2 | 1.2 | 2.5 | 4.0 |
| Apulia | 4.5 | 9.0 | 8.8 | 22.2 | 0.2 | 0.9 | 1.9 | 3.0 |
| Basilicata | 0.6 | 1.3 | 1.3 | 3.2 | 0.0 | 0.1 | 0.3 | 0.4 |
| Calabria | 2.3 | 4.5 | 4.5 | 11.3 | 0.1 | 0.4 | 1.0 | 1.5 |
| Sicily | 5.6 | 10.6 | 10.4 | 26.6 | 0.2 | 1.1 | 2.3 | 3.6 |
| Sardinia | 2.1 | 4.1 | 4.3 | 10.5 | 0.1 | 0.4 | 0.9 | 1.4 |
| Total | 77.9 | 166.8 | 174.2 | 418.8 | 3.1 | 16.7 | 38.3 | 58.1 |
-
Source: MicroReg.
Test t for mean difference — EU-SILC vs HBS — Centre of Italy.
| EU-SILC | HBS | |||||||
|---|---|---|---|---|---|---|---|---|
| Variable | Mean | Standard Deviation | Min | Max | Mean | Standard Deviation | Min | Max |
| Number of rooms | 3.4 | 36.15 | 1 | 6 | 4.26 | 40.08 | 1 | 6 |
| Loan | 0.16 | 12.28 | 0 | 1 | 0.17 | 12.84 | 0 | 1 |
| Number of members | 2.28 | 39.82 | 1 | 5 | 2.25 | 40.29 | 1 | 6 |
| Pc | 0.61 | 16.36 | 0 | 1 | 0.64 | 16.3 | 0 | 1 |
| Internet | 0.57 | 16.62 | 0 | 1 | 0.59 | 16.73 | 0 | 1 |
| Car | 0.81 | 13.24 | 0 | 1 | 0.83 | 12.72 | 0 | 1 |
| Dishwasher | 0.51 | 16.77 | 0 | 1 | 0.61 | 16.59 | 0 | 1 |
| Expenditure | 23,850 | 363,619 | 7303 | 185,488 | 26,369 | 721,718 | 2,657 | 321,923 |
| Number of members <5 years old | 0.14 | 13.37 | 0 | 3 | 0.11 | 12.42 | 0 | 3 |
| Number of members 617 years old | 0.25 | 19.67 | 0 | 4 | 0.26 | 20.1 | 0 | 4 |
| Number of members 1824 years old | 0.15 | 14.31 | 0 | 3 | 0.14 | 13.57 | 0 | 3 |
| Number of members 3469 years old | 1.12 | 28.42 | 0 | 4 | 1.18 | 27.91 | 0 | 4 |
| Householder with low education | 0.52 | 16.77 | 0 | 1 | 0.51 | 16.99 | 0 | 1 |
| Number of managers | 0.02 | 4.9 | 0 | 2 | 0.03 | 6.57 | 0 | 3 |
| Number of self-employed | 0.05 | 7.87 | 0 | 3 | 0.08 | 10.53 | 0 | 3 |
| In property | 0.86 | 11.79 | 0 | 1 | 0.85 | 12.02 | 0 | 1 |
| Number of earners | 1.39 | 26.58 | 0 | 5 | 1.44 | 25.5 | 0 | 5 |
| P-value | 0.9439473 | |||||||
-
Source: our elaborations on HBS and EU-SILC.
Test X2 for equality of distribution - EU-SILC vs. HBS.
| EU-SILC | HBS | |||
|---|---|---|---|---|
| Geographical area | N° | % | N° | % |
| North West | 7,251,965 | 28.3 | 7,270,064 | 28.34 |
| North East | 5,068,067 | 19.78 | 5,055,184 | 19.71 |
| Centre | 5,280,629 | 20.61 | 5,241,862 | 20.44 |
| South | 8,023,134 | 31.31 | 8,083,272 | 31.51 |
| P-value | 1 | |||
| EU-SILC | HBS | |||
| Number of components | N° | % | N° | % |
| 1 | 8,281,042 | 32.32 | 8,391,562 | 32.715 |
| 2 | 6,762,685 | 26.39 | 6,801,077 | 26.515 |
| 3 | 5,045,371 | 19.69 | 4,841,819 | 18.876 |
| 4 | 4,226,780 | 16.5 | 4,331,686 | 16.887 |
| 5 | 1,028,286 | 4.01 | 1,023,989 | 3.992 |
| 6 | 202,530 | 0.79 | 199,543 | 0.778 |
| 7 | 52,711 | 0.21 | 45,463 | 0.177 |
| 8 | 15,078 | 0.06 | 13,698 | 0.053 |
| 9 | 6,810 | 0.03 | 1,249 | 0.005 |
| 10 | 2,410 | 0.01 | 296 | 0.001 |
| P-value | 1 | |||
| EU-SILC | HBS | |||
| Number of earners | N° | % | N° | % |
| 0 | 3,956,170 | 15.44 | 2,506,273 | 9.95 |
| 1 | 13,124,349 | 51.22 | 13,378,643 | 53.13 |
| 2 | 7,109,135 | 27.74 | 8,125,715 | 32.27 |
| 3 | 1,197,490 | 4.67 | 1,009,751 | 4.01 |
| 4 | 215,988 | 0.84 | 148,021 | 0.59 |
| 5 | 20,662 | 0.08 | 13,492 | 0.05 |
| P-value | 0.554 | |||
| EU-SILC | HBS | |||
| Number of females | N° | % | N° | % |
| 0 | 3,703,284 | 14.45 | 3,868,724 | 15.36 |
| 1 | 14,672,359 | 57.26 | 14,380,843 | 57.11 |
| 2 | 5,418,932 | 21.15 | 5,315,662 | 21.11 |
| 3 | 1,615,631 | 6.31 | 1,426,684 | 5.67 |
| 4 | 191,205 | 0.75 | 171,297 | 0.68 |
| 5 | 17,507 | 0.07 | 18,684 | 0.07 |
| 6 | 4,183 | 0.02 | n/a or 0 ? | n/a or 0 ? |
| 7 | 693 | 0 | n/a or 0 ? | n/a or 0 ? |
| P-value | 1 | |||
-
Source: Our elaborations on HBS and EU-SILC.
Regression of consumption on households’ characteristics.
| Number of observations | 19,988 | |||||
| R squared | 0.366 | |||||
| R- squared corr. | 0.365 | |||||
| Variable | DF | Parameter estimate | Standard Error | T statistic | Pr > |t| | Vif |
| Intercept | 1 | 9.08 | 0.02 | 483.94 | <.0001 | 0 |
| Number of rooms | 1 | 0.04 | 0 | 10.78 | <.0001 | 1.26 |
| In property | 1 | -0.26 | 0.01 | -22.41 | <.0001 | 1.17 |
| VHS | 1 | 0.08 | 0.01 | 9.54 | <.0001 | 1.14 |
| Loan | 1 | 0.11 | 0.01 | 8.43 | <.0001 | 1.14 |
| Box | 1 | 0.13 | 0.01 | 14.37 | <.0001 | 1.22 |
| Pc | 1 | 0.14 | 0.02 | 8.9 | <.0001 | 4.15 |
| Car | 1 | 0.27 | 0.01 | 23.11 | <.0001 | 1.51 |
| Internet | 1 | 0.09 | 0.02 | 5.7 | <.0001 | 3.81 |
| Dishwasher | 1 | 0.18 | 0.01 | 19.54 | <.0001 | 1.33 |
| Number of members <5 years old | 1 | 0.03 | 0.01 | 2.49 | 0.013 | 1.22 |
| Number of members 6–17 years old | 1 | 0.03 | 0.01 | 4.26 | <.0001 | 1.56 |
| Number of members 18–24 years old | 1 | 0.05 | 0.01 | 3.93 | <.0001 | 2.41 |
| Number of members 25–34 years old | 1 | -0.01 | 0.01 | -0.74 | 0.461 | 2.19 |
| Number of members 34–69 years old | 1 | 0.03 | 0.01 | 3.93 | <.0001 | 3.03 |
| Householder with low education | 1 | -0.08 | 0.01 | -5.66 | <.0001 | 3.1 |
| Number of males | 1 | 0.02 | 0.01 | 2.91 | 0.004 | 2.46 |
| Number of job seekers | 1 | -0.07 | 0.01 | -5.71 | <.0001 | 2.19 |
| Number of retired | 1 | 0.04 | 0.01 | 4.52 | <.0001 | 2.39 |
| Number of not employed | 1 | 0 | 0.01 | 0.23 | 0.82 | 3.18 |
| Number of managers | 1 | 0.12 | 0.02 | 5.4 | <.0001 | 1.06 |
| Number of self-employed | 1 | 0.08 | 0.01 | 5.22 | <.0001 | 1.1 |
| Number of members with high education | 1 | 0.11 | 0.01 | 10.78 | <.0001 | 2.22 |
| Number of members with medium education | 1 | 0.04 | 0.01 | 4.82 | <.0001 | 3.69 |
| Number of earners | 1 | 0.08 | 0.01 | 7.45 | <.0001 | 4.37 |
-
Source: Our elaborations on HBS.