Inequality and household size: A microsimulation for Uruguay
- Organismos Internacionales / Comisión Económica para América Latina y el Caribe, Uruguay
- Article
- Figures and data
- Jump to
Figures

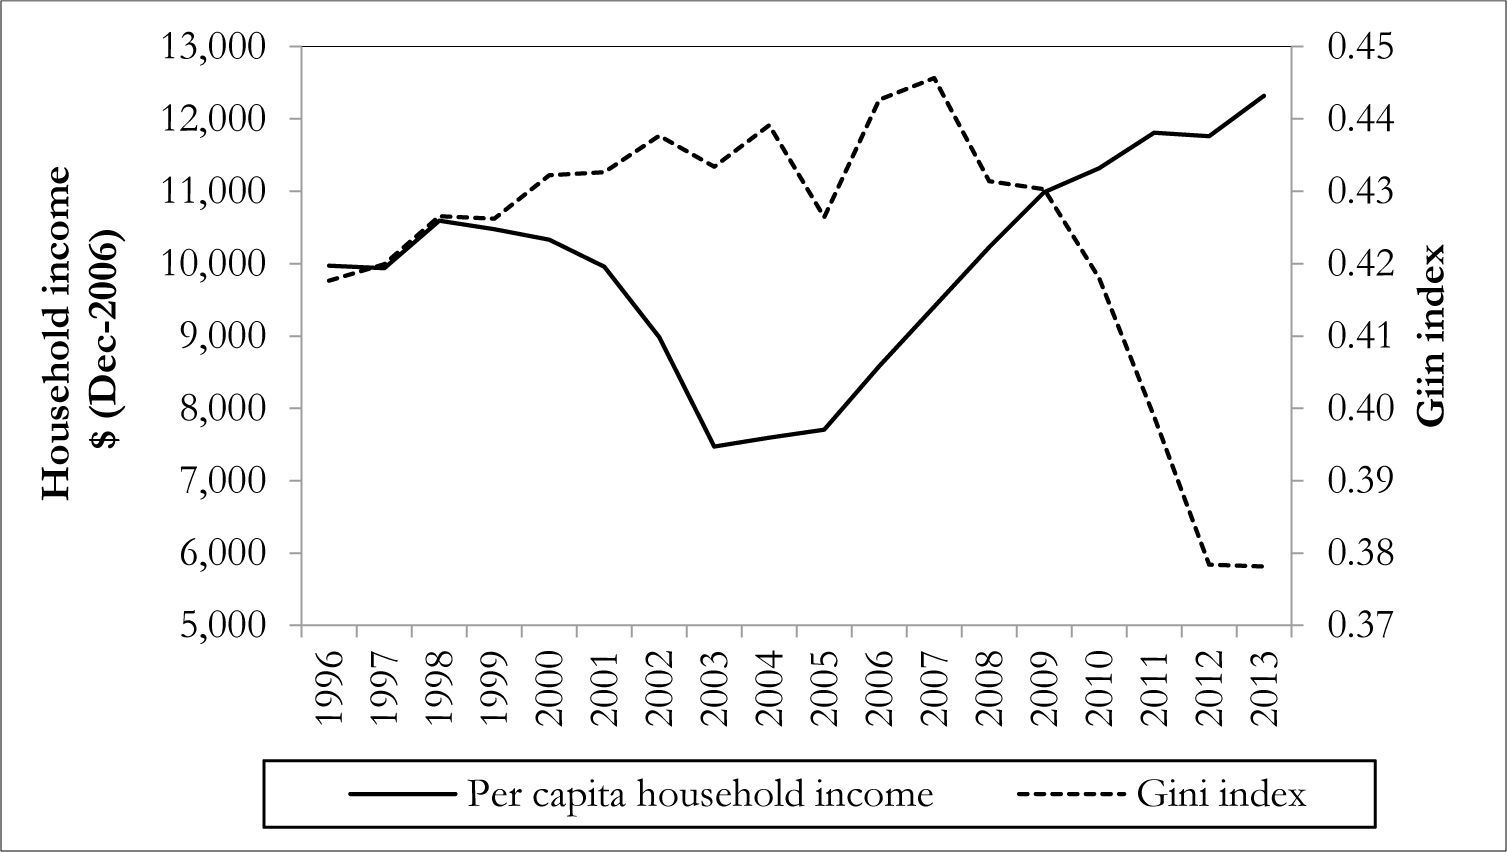
Household income and inequality.
Source: Own calculations based on household surveys.

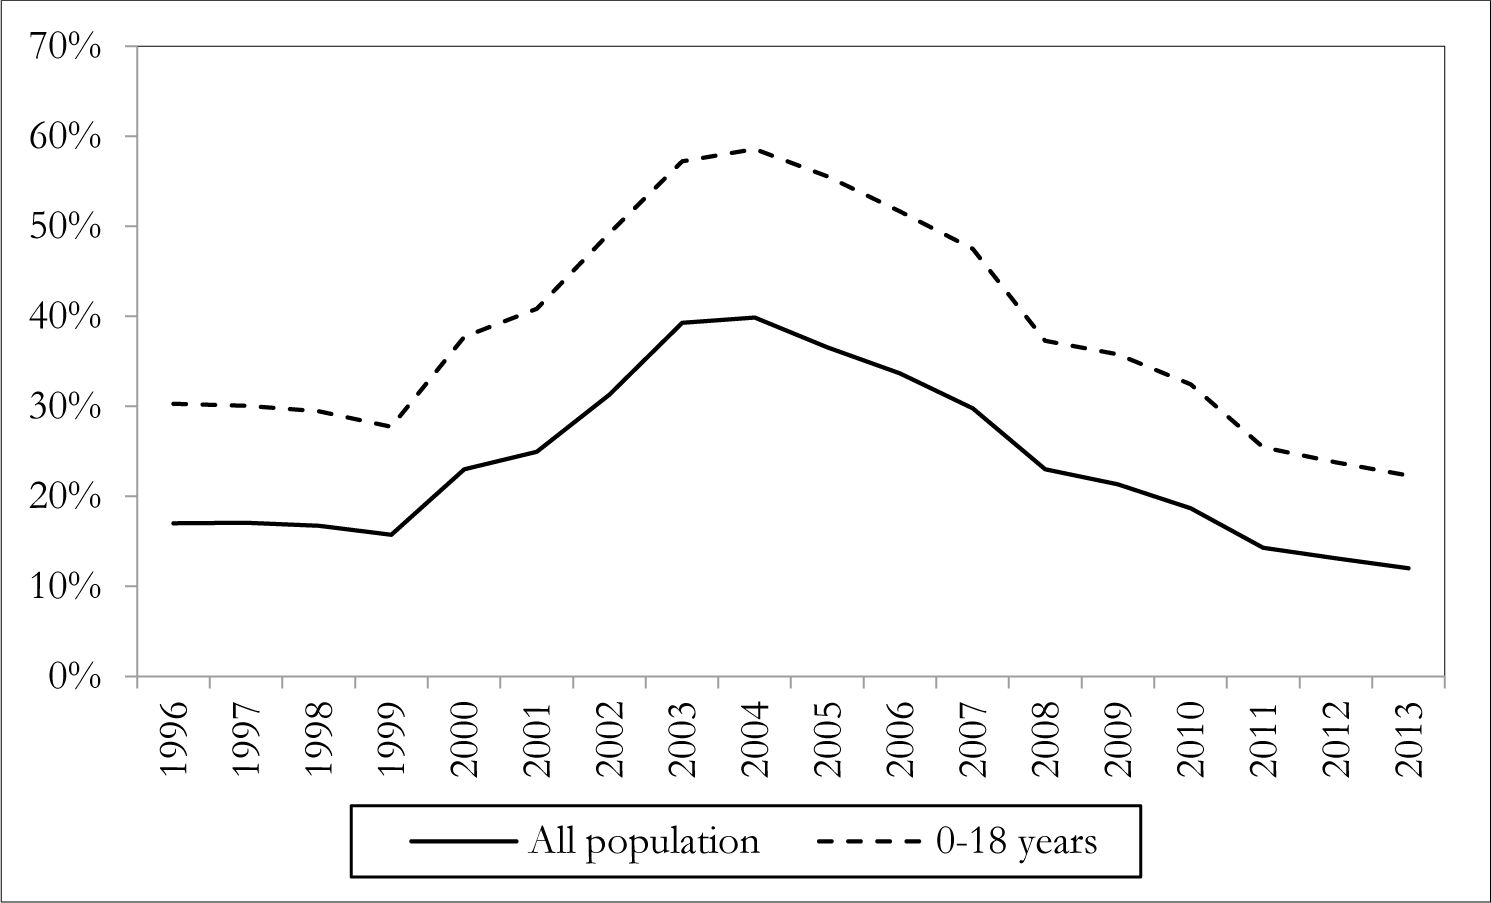
Poverty incidence. Uruguay. 1996–2013.
Source: Own calculations based on household surveys.

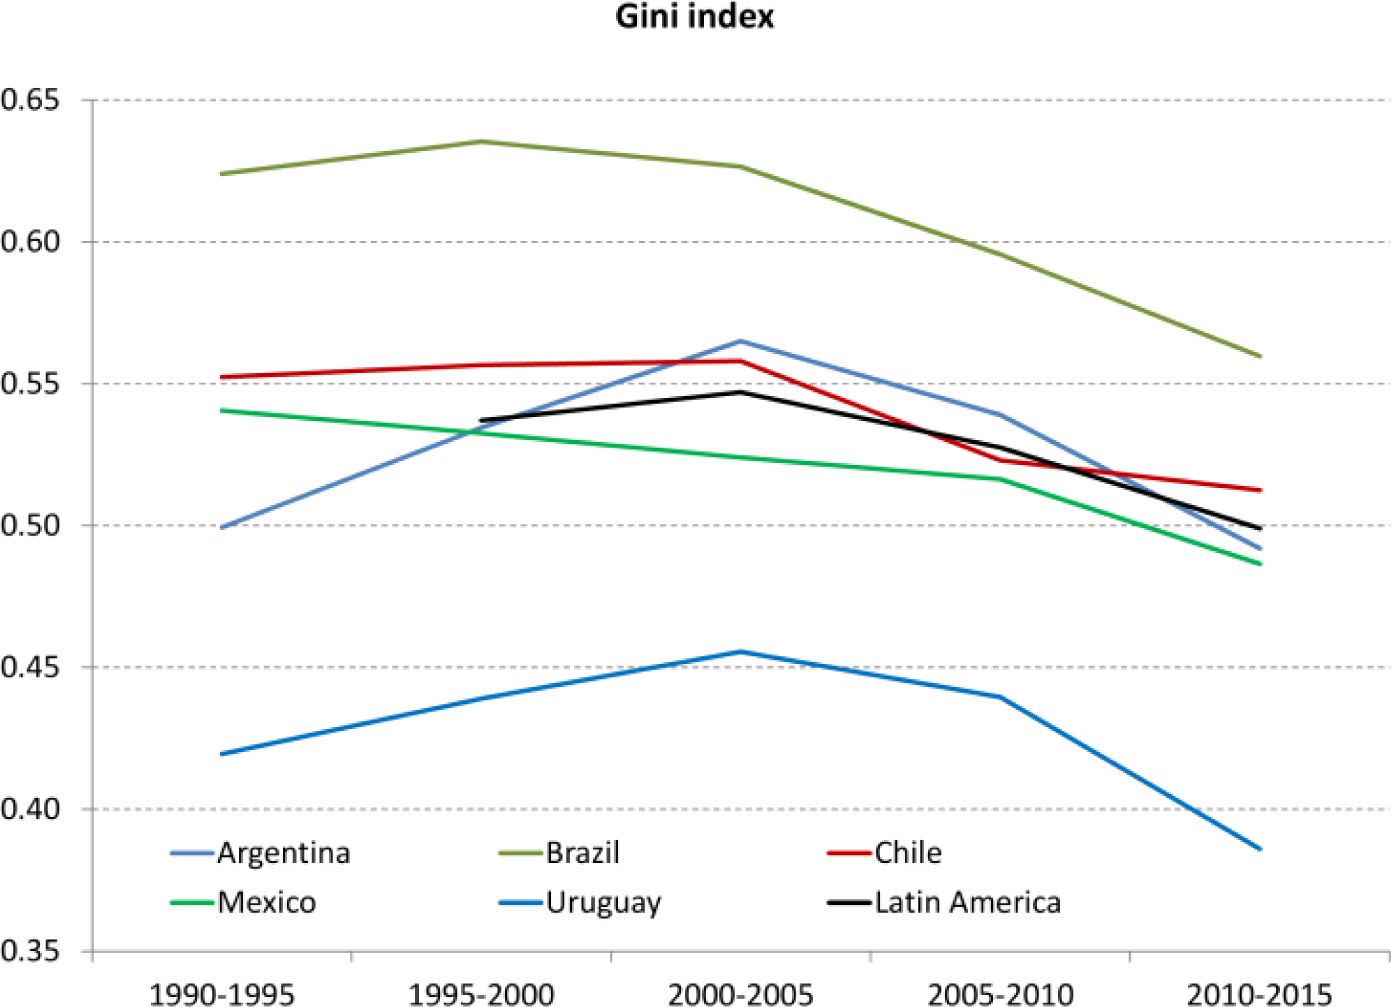
Gini index and total fertility index in Latin America.
Source: CEPALSTAT.

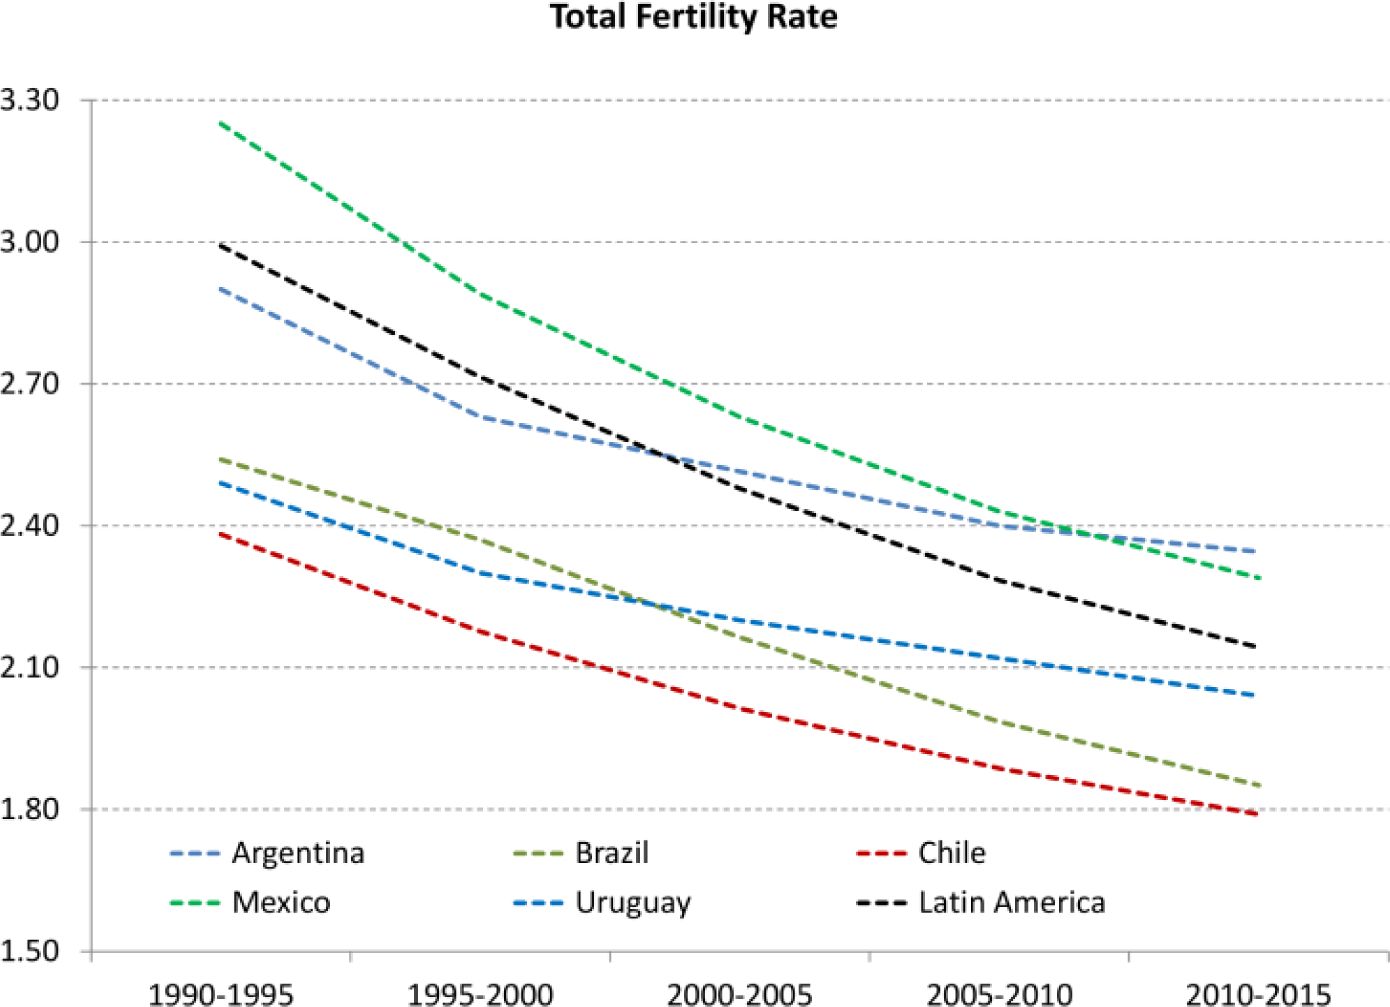
Total fertility index in Latin America.
Source: CEPALSTAT.
Tables
Number of children per household. Household head younger than 50.
| Number of children per household | Change | |||||
|---|---|---|---|---|---|---|
| Education (hh head) | 1996 | 2007 | 2013 | 1996–2007 | 2007–2013 | 1996–2013 |
| Primary or less | 1.97 | 2.03 | 1.85 | 3.0% | −8.9% | −6.2% |
| Secondary | 1.55 | 1.44 | 1.41 | −7.4% | −2.3% | −9.5% |
| Technical | 1.76 | 1.41 | 1.21 | −19.9% | −14.3% | −31.3% |
| Teachers | 1.32 | 0.98 | 1.01 | −25.5% | 2.7% | −23.4% |
| Tertiary | 1.26 | 0.90 | 0.83 | −28.4% | −7.4% | −33.6% |
| Total | 1.66 | 1.46 | 1.32 | −12.0% | −9.8% | −20.7% |
-
Source: Own calculations based on household surveys.
Change in the number of children per household. Household head younger than 50.
| 1996 | 2007 | 2013 | 1996–2007 | 2007–2013 | 1996–2013 | |
|---|---|---|---|---|---|---|
| Deciles 1–5 | 2.23 | 2.11 | 1.91 | −5% | −10% | −15% |
| Deciles 6–10 | 1.09 | 0.82 | 0.73 | −25% | −11% | −33% |
| Total | 1.66 | 1.46 | 1.32 | −12% | −10% | −20% |
-
Source: Own calculations based on household surveys.
-
Note: Deciles are calculated on the basis of per capita household income.
Estimation of fertility equations. Dependent variable: number of children in the household. Biparental households. 1996, 2007 and 2013.
| 1996 | 2007 | 2013 | ||||||
|---|---|---|---|---|---|---|---|---|
| OLS | Poisson | Neg. binomial | OLS | Poisson | OLS | Poisson | Neg. binomial | |
| Medium ed. Hh | −0.217 (0.0435)*** |
−0.116 (0.0251)*** |
−0.116 (0.0251)*** |
−0.404 (0.00632)*** |
−0.223 (0.0036)*** |
−0.301 (0.00562)*** |
−0.177 (0.00399)*** |
−0.145 (0.0097)*** |
| High educ hh | −0.242 (0.0672)*** |
−0.140 (0.0412)*** |
−0.140 (0.0412)*** |
−0.534 (0.00915)*** |
−0.324 (0.0624)*** |
−0.535 (0.00744)*** |
−0.365 (0.00580)*** |
−0.193 (0.00578)*** |
| Med. educ. sp. | −0.208 (0.0446)*** |
−0.109 (0.0255)*** |
−0.109 (0.0255)*** |
−0.38 (0.00653)*** |
−0.205 (0.00396)*** |
−0.287 (0.00574)*** |
−0.167 (0.00406)*** |
−0.135 (0.00403)*** |
| High educ sp. | −0.463 (0.0636)*** |
−0.260 (0.0393)*** |
−0.260 (0.0393)*** |
−0.653 (0.00866)*** |
−0.405 (0.00581)*** |
−0.495 (0.0037)*** |
−0.326 (0.00564)*** |
−0.188 (0.00563)*** |
| Age hh | 0.306 (0.0261)*** |
0.150 (0.0192)*** |
0.150 (0.0192)*** |
0.189 (0.00340)*** |
0.122 (0.00257)*** |
0.183 (0.00273)*** |
0.144 (0.00237)*** |
0.073 (0.00230)*** |
| Age2 hh | −0.004 (3.47e-4)*** |
−0.002 (2.53e-4)*** |
−0.002 (2.53e-4)*** |
−0.0025 (4.58e-5)*** |
−0.0016 (3.45e-5)*** |
−0.002 (3.70e-5)*** |
−0.002 (3.20e-5)*** |
−0.001 (3.10e-5)*** |
| Age spouse | 0.176 (0.0154)*** |
0.198 (0.0145)** |
0.198 (0.0145)*** |
0.19 (0.0225)*** |
0.169 (.00193)*** |
0.144 (0.00189)*** |
0.117 (0.00172)*** |
0.048 (0.00168)*** |
| Age2 spouse | −0.003 (1.95e-4)*** |
−0.003 (1.97e-4)*** |
−0.003 (1.97e-4)*** |
−0.0026 (2.9e-5)*** |
−0.0024 (2.6e-5)*** |
−0.002 (2.42e-5)*** |
−0.002 (2.26e-5)*** |
−0.001 (2.21e-5)*** |
| Region | −0.162 (0.0369)*** |
−0.087 (0.0219)*** |
−0.087 (0.0219)*** |
−0.148 (0.00502)*** |
−0.0898 (0.00334)*** |
−0.065 (0.00414)*** |
−0.046 (0.00321)*** |
−0.011 (0.00318)*** |
| Sex of hh | −0.110 (0.107) |
−0.102 (0.071) |
−0.102 (0.15) |
−0.095 (0.00777)*** |
−0.069 (0.00544)*** |
−0.013 (0.00504)** |
−0.007 (0.00396)* |
0.023 (0.00402)*** |
| Non lab inc hh | 0.011 (0.00200)*** |
0.006 (0.00115)*** |
0.006 (0.00115)*** |
0.0008 (0.000250)*** |
0.0003 (0.000166) |
−0.021 (0.000467)*** |
−0.012 (0.000315)*** |
−0.008 (0.000322)*** |
| Non lab inc sp | 0.010 (2.33e-3)*** |
0.005 (1.35e-3)*** |
0.005 (1.35e-3)*** |
0.003 (0.0002)*** |
0.0021 (0.00015)*** |
− (-) | − (-) | − (-) |
| Constant | −6.089 (0.424)*** |
−5.232 (0.314)*** |
−5.232 (0.314)*** |
−4.329 (0.0553)*** |
−4.242 (0.0433)*** |
−3.679 (0.0439)*** |
−3.908 (0.0400)*** |
−1.288 (0.0384)*** |
| Observations | 5,011 | 5,011 | 5,011 | 249,790 | 249,790 | 289,302 | 289,302 | 226,850 |
-
Standard errors in parentheses.
-
*
Significant at 10%;
-
**
significant at 5%;
-
***
significant at 1%.
-
Source: Own estimations based on household survey.
Labour supply. Dependent variable: hours of work. Tobit estimation.
| Household heads | Spouses | |||||
|---|---|---|---|---|---|---|
| 1996 | 2007 | 2013 | 1996 | 2007 | 2013 | |
| Sex | 7.31 (0.957)*** |
16.92 (0.0742)*** |
14.80 (0.0587)*** |
22.45 (2.829)*** |
25.22 (0.201)*** |
19.87 (0.111)*** |
| Age | 1.74 (0.322)*** |
1.66 (0.0397)*** |
2.21 (0.0335)*** |
4.71 (0.464)*** |
4.44 (0.0562)*** |
3.23 (0.0407)*** |
| Age | −0.02 squared (0.0044)*** | −0.02 (0.00054)*** |
−0.03 (0.00046)*** |
−0.06 (0.0063)*** |
−0.06 (0.00075)*** |
−0.04 (0.00054)*** |
| Region | 0.68 (0.527) |
−0.49 (0.0663)*** |
−1.02 (0.0578)*** |
4.03 (1.054)*** |
2.40 (0.127)*** |
1.10 (0.0941)*** |
| Children | −0.07 (0.196) |
−1.22 (0.0247)*** |
−0.97 (0.0237)*** |
−3.72 (0.405)*** |
−4.56 (0.0517)*** |
−3.75 (0.0416)*** |
| School | −10.83 (1.520)*** |
−7.33 (0.148)*** |
−3.48 (0.116)*** |
−4.36 (2.635)* |
−6.28 (0.263)*** |
−4.75 (0.185)*** |
| Med. educ. | 4.21 (0.586)*** |
5.29 (0.0801)*** |
5.72 (0.0762)*** |
14.71 (1.256)*** |
11.42 (0.169)*** |
8.02 (0.134)*** |
| High edu. | 6.71 (0.820)*** |
7.79 (0.108)*** |
6.89 (0.0952)*** |
29.21 (1.659)*** |
21.15 (0.214)*** |
14.52 (0.162)*** |
| Married | 3.77 (0.899)*** |
1.51 (0.0701)*** |
0.56 (0.0626)*** |
29.50 (19.16) |
−0.79 (0.141)*** |
−0.95 (0.101)*** |
| Non lab inc. | −0.39 -0.39 (0.0306)*** |
0.36 (0.00375)*** |
0.33 (0.00559)*** |
|||
| Income of hh. | −3.86 (0.731)*** |
−1.57 (0.0754)*** |
−0.60 (0.0628)*** | |||
| Constant | −3.17 (5.693) |
−5.21 (0.696)*** |
−17.00 (0.585)*** |
−85.33 (21.34)*** |
−57.53 (1.13)*** |
−37.34 (0.905)*** |
| Observat-ions | 7,648 | 405,657 | 463,118 | 5,448 | 258,113 | 285,446 |
-
Standard errors in parentheses.
-
*
Significant at 10%.
-
**
significant at 5%.
-
***
significant at 1%.
-
Source: Own estimations based on household surveys.
Wage equation estimation with selection correction (Heckman maximum likelihood). Dependent variable: hourly wages. Household heads.
| 1996 | 2007 | 2013 | ||||
|---|---|---|---|---|---|---|
| Hourly wages | Selec. eq. | Hourly wages | Selec. eq. | Hourly wages | Selec. eq. | |
| Sex | 0.191 (0.031)*** |
0.155 (0.072)** |
0.126 (0.0034)*** |
0.939 (0.0066)*** |
0.098 (0.0023)*** |
0.881 (0.0059)*** |
| Age | 0.068 (0.010)*** |
0.090 (0.024)*** |
0.021 (0.0015)*** |
0.139 (0.0035)*** |
0.032 (0.0013)*** |
0.154 (0.0029)*** |
| Age sq. | −0.0008 (1.4e-4)*** |
−0.0012 (3.3e-4)*** |
0.0000 (2.1e-5)** |
−0.0018 (4.8e-5)*** |
−0.0003 (1.8e-5)*** |
−0.0020 (4.1e-05)*** |
| Region | 0.299 (0.017)*** |
0.005 (0.042) |
0.146 (0.0025)*** |
0.045 (0.0065)*** |
0.062 (0.0022)*** |
−0.092 (0.0056)*** |
| Med. educ. | 0.338 (0.019)*** |
0.275 (0.045)*** |
0.385 (0.0031)*** |
0.333 (0.0071)*** |
0.244 (0.0029)*** |
0.388 (0.0066)*** |
| High educ. | 0.860 (0.026)*** |
0.611 (0.072)*** |
1.097 (0.0040)*** |
0.786 (0.012)*** |
0.778 (0.0034)*** |
0.761 (0.0092)*** |
| Married | 0.073 (0.028)*** |
0.078 (0.069) |
0.121 (0.0026)*** |
0.065 (0.0069)*** |
0.161 (0.0023)*** |
−0.044 (0.0063)*** |
| Children | −0.022 (0.015) |
−0.096 (0.0022)*** |
−0.058 (0.0020)*** | |||
| School | −0.471 (0.11)*** |
−0.590 (0.013)*** |
−0.255 (0.010)*** | |||
| Non lab. inc. | −0.031 (0.0022)*** |
0.013 (0.00035)*** |
0.016 (0.00047)*** | |||
| Constant | 3.44 (0.19)*** |
−0.88 (0.42)** |
3.91 (0.028)*** |
−1.92 (0.060)*** |
4.52 (0.023)*** |
−2.27 (0.050)*** |
| Observations | 7,500 | 7,500 | 397,207 | 397,207 | 459,519 | 459,519 |
-
Standard errors in parentheses.
-
*
Significant at 10%.
-
**
significant at 5%.
-
***
significant at 1%.
-
Source: Own estimations based on household surveys.
Wage equation estimation with selection correction (Heckman maximum likelihood). Dependent variable: hourly wages. Spouses.
| 1996 | 2007 | 2013 | ||||
|---|---|---|---|---|---|---|
| Hourly wages | Selec. eq. | Hourly wages | Selec. eq. | Hourly wages | Selec. eq. | |
| Sex | 0.258 (0.068)*** |
0.660 (0.12)*** |
0.106 (0.013)*** |
1.218 (0.012)*** |
0.028 (0.0032)*** |
1.051 (0.0087)*** |
| Age | 0.076 (0.013)*** |
0.161 (0.016)*** |
0.056 (0.0026)*** |
0.183 (0.0023)*** |
0.026 (0.0013)*** |
0.089 (0.0022)*** |
| Age sq. | −0.0009 (1.7e-4)*** |
−0.0020 (2.1e-4)*** |
−0.0006 (3.3e-5)*** |
−0.0023 (3.1e-5)*** |
−0.0002 (1.7e-5)*** |
−0.0012 (2.9e-5)*** |
| Region | 0.390 (0.027)*** |
0.182 (0.037)*** |
0.183 (0.0040)*** |
0.106 (0.0056)*** |
0.102 (0.0029)*** |
−0.004 (0.0055) |
| Med. educ. | 0.449 (0.037)*** |
0.447 (0.043)*** |
0.357 (0.0081)*** |
0.406 (0.0074)*** |
0.186 (0.0042)*** |
0.083 (0.0071)*** |
| High educ. | 1.180 (0.053)*** |
1.309 (0.065)*** |
1.121 (0.015)*** |
1.105 (0.011)*** |
0.670 (0.0048)*** |
0.256 (0.0099)*** |
| Married | −0.496 (0.50) |
0.613 (0.63) |
0.110 (0.0043)*** |
0.005 (0.0065) |
0.127 (0.0031)*** |
−0.181 (0.0060)*** |
| Children | −0.110 (0.014)*** |
−0.169 (0.0023)*** |
−0.083 (0.0022)*** | |||
| School | −0.228 (0.098)** |
−0.276 (0.013)*** |
−0.250 (0.010)*** | |||
| Income hh | −0.208 (0.026)*** |
−0.098 (0.0061)*** |
0.811 (0.0044)*** | |||
| Constant | 3.38 (0.57)*** |
−2.14 (0.71)*** |
3.19 (0.067)*** |
−2.43 (0.060)*** |
4.69 (0.023)*** |
−9.35 (0.055)*** |
| Observations | 5,486 | 5,486 | 256,300 | 256,300 | 308,271 | 308,271 |
-
Standard errors in parentheses.
-
*
Significant at 10%.
-
**
significant at 5%.
-
***
significant at 1%.
-
Source: Own estimations based on household surveys.
Number of children per type of household. 1996, 2007 and simulations for 2007 and 2013.
| 1996–2007 | 1996 | 2007 | Fertility size effect (FSE) | Change due to FSE |
|---|---|---|---|---|
| Lone parents | 1.08 | 1.02 | 0.93 | −8.4% |
| Biparental | 1.81 | 1.60 | 1.68 | 4.7% |
| Other | 1.63 | 1.67 | 1.46 | −12.4% |
| Total | 1.66 | 1.46 | 1.46 | −0.2% |
| 2007–2013 | 2007 | 2013 | Fertility size effect (FSE) | Change due to FSE |
| Lone parents | 1.02 | 0.90 | 0.89 | −1.3% |
| Biparental | 1.60 | 1.46 | 1.45 | −0.3% |
| Other | 1.67 | 1.45 | 1.48 | 2.1% |
| Total | 1.46 | 1.32 | 1.32 | −0.2% |
-
Source: Own estimations based on household surveys.
Main results from the microsimulations.
| 1996–2007 | 1996 | 2007 | Fertility size effect | Hours size effect | Hours parameter effect |
|---|---|---|---|---|---|
| Mean income | 8,381 | 7,641 | 7,645 | 7,597 | 7,335 |
| Poverty incidence | 17.0 | 29.8 | 26.7 | 30.3 | 31.6 |
| Extreme poverty incidence | 1.7 | 2.6 | 1.3 | 3.2 | 3.3 |
| Theil index | 32.4 | 38.7 | 36.1 | 39.1 | 39.4 |
| Gini coefficient | 42.6 | 45.7 | 43.7 | 45.9 | 45.9 |
| 2007–2013 | 2007 | 2013 | Fertility size effect | Hours size effect | Hours parameter effect |
| Mean income | 7,641 | 10,370 | 10,373 | 10,294 | 8,191 |
| Poverty incidence | 29.8 | 12.0 | 10.0 | 13.2 | 10.5 |
| Extreme poverty incidence | 2.6 | 0.5 | 0.3 | 0.7 | 0.7 |
| Theil index | 38.7 | 25.8 | 24.6 | 26.4 | 25.1 |
| Gini coefficient | 45.7 | 38.3 | 37.1 | 38.8 | 38.1 |
-
Source: Own estimations based on household surveys.
Impact of fertility changes on income, poverty and inequality.1996–2007, 2007–2014.
| Observed change | Fertility direct effect | Hours direct effect | Hour Parameter effect | Total effect | |
|---|---|---|---|---|---|
| 1996–2007 | |||||
| Mean income | −740 | 3 | −45 | −306 | −348 |
| Poverty | 12.8 | −3.1 | 0.5 | 1.8 | −0.8 |
| Extreme poverty | 1.0 | −1.3 | 0.6 | 0.7 | −0.1 |
| Theil | 6.2 | −2.6 | 0.4 | 0.7 | −1.5 |
| Gini coefficient | 3.1 | −2.0 | 0.2 | 0.2 | −1.6 |
| 2007–2013 | |||||
| Mean income | 2,728 | 4 | −75 | −2,179 | −2,250 |
| Poverty | −17.8 | −2.1 | 1.2 | −1.5 | −2.3 |
| Extreme poverty | −2.1 | −0.3 | 0.2 | 0.1 | 0.0 |
| Theil | −12.8 | −1.2 | 0.6 | −0.7 | −1.3 |
| Gini coefficient | −7.4 | −1.2 | 0.5 | −0.2 | −1.0 |
-
Source: Own estimations based on household surveys.
Estimation of fertility equations. Dependent variable: number of children in the household. Lone parent households.1996, 2007 and 2013.
| 1996 | 2007 | 2013 | |||||||
|---|---|---|---|---|---|---|---|---|---|
| OLS | Poisson | Neg. bin | OLS | Poisson | Neg. bin | OLS | Poisson | Neg. bin | |
| Education | |||||||||
| Medium hh | 0.220 (0.156) |
0.564 (0.217)*** |
0.558 (0.223)** |
−0.065 (0.0153)*** |
−0.228 (0.0274)*** |
−0.228 (0.0277)*** |
−0.047 (0.0132)*** |
−0.176 (0.0274)*** |
−0.176 (0.0274)*** |
| High hh | 0.003 (0.191) |
−0.037 (0.315) |
−0.037 (0.321) |
−0.201 (0.0184)*** |
−1.419 (0.0518)*** |
−1.420 (0.0520)*** |
−0.167 (0.0157)*** |
−1.333 (0.0476)*** |
−1.333 (0.0476)*** |
| Medium whh | −0.698 (0.184)*** |
−0.870 (0.227)*** |
−0.865 (0.235)*** |
−0.673 (0.0185)*** |
−0.186 (0.0283)*** |
−0.185 (0.0287)*** |
−0.519 (0.0166)*** |
−0.147 (0.0284)*** |
−0.147 (0.0284)*** |
| High whh | −0.750 (0.223)*** |
−0.507 (0.327) |
−0.508 (0.335) |
−1.127 (0.0219)*** |
0.415 (0.0528)*** |
0.416 (0.0531)*** |
−1.092 (0.0193)*** |
0.352 (0.0487)*** |
0.352 (0.0487)*** |
| Age | |||||||||
| Age hh | 0.083 (0.064) |
0.482 (0.143)*** |
0.478 (0.145)*** |
0.014 (0.0066)** |
0.334 (0.0207)*** |
0.330 (0.0208)*** |
0.000 (0.0052) |
0.281 (0.0194)*** |
0.281 (0.0194)*** |
| Age2 hh | −0.001 (9e-4) |
−0.006 (0.0018)*** |
−0.006 (1.9e-3)*** |
0.000 (9.1e-5) |
−0.004 (2.7e-4)*** |
−0.004 (2.7e-4)*** |
0.000 (7.3e-5)** |
−0.003 (2.5e-4)*** |
−0.003 (2.5e-4)*** |
| Age whh | 0.330 (0.079)*** |
−0.125 (0.149) |
−0.124 (0.152) |
0.359 (0.0083)*** |
−0.026 (0.0213) |
−0.021 (0.0214) |
0.374 (0.0069)*** |
0.038 (0.0200)* |
0.038 (0.0200)* |
| Age2 whh | −0.005 (1e-3)*** |
0.001 (0.0019) |
0.001 (0.002) |
−0.005 (1.2e-4)*** |
−0.001 (2.8e-4)*** |
−0.001 (2.8e-4)*** |
−0.005 (9.5e-5)*** |
−0.002 (2.9e-4)*** |
−0.002 (2.9e-4)*** |
| Region | |||||||||
| Region | −0.123 (0.144) |
−0.332 (0.195)* |
−0.335 (0.202)* |
−0.010 (0.0127) |
−0.074 (0.0257)*** |
−0.073 (0.0259)*** |
−0.008 (0.0102) |
−0.059 (0.0245)** |
−0.059 (0.0245)** |
| Region whh | −0.124 (0.167) |
0.171 (0.205) |
0.179 (0.213) |
−0.344 (0.0153)*** |
−0.174 (0.0265)*** |
−0.176 (0.0269)*** |
−0.060 (0.0128)*** |
0.009 (0.0254) |
0.009 (0.0254) |
| Sex | |||||||||
| Sex of hh | −3.594 (1.370)*** |
5.442 (2.826)* |
5.409 (2.878)* |
−3.825 (0.145)*** |
4.192 (0.403)*** |
4.106 (0.405)*** |
−4.283 (0.121)*** |
3.475 (0.381)*** |
3.475 (0.381)*** |
| Non-labour | |||||||||
| Inc. hh | 0.011 (6e-3)* |
0.026 (8.3e-3)*** |
0.026 (8.6e-3)*** |
0.003 (5.8e-4)*** |
0.016 (0.00125)*** |
0.016 (0.0013)*** |
0.003 (5.5e-4)*** |
0.020 (1.5e-3)*** |
0.020 (1.5e-3)*** |
| Inc. whh | 0.014 (7e-3)* |
−0.006 (0.0088) |
−0.006 (9.2e-3) |
0.030 (7.6e-4)*** |
0.015 (0.00135)*** |
0.015 (0.0014)*** |
−0.003 (7.8e-4)*** |
−0.019 (1.5e-3)*** |
−0.019 (1.5e-3)*** |
| Constant | −1.363 (1.083) |
−10.880 (2.713)*** |
−10.820 (2.753)*** |
−0.163 (0.115) |
−8.690 (0.394)*** |
−8.616 (0.395)*** |
0.030 (0.0909) |
−8.195 (0.371)*** |
−8.195 (0.371)*** |
| Observations | 1,205 | 1,205 | 1,205 | 102,096 | 102,096 | 102,096 | 114,463 | 114,463 | 114,463 |
-
Standard errors in parentheses.
-
*
Significant at 10%.
-
**
significant at 5%.
-
***
significant at 1%.
-
Source: Own estimations based on household surveys.
Estimation of fertility equations. Dependent variable: number of children in the household. Other households. 1996, 2007 and 2013.
| 1996 | 2007 | 2013 | |||||||
|---|---|---|---|---|---|---|---|---|---|
| OLS | Poisson | Neg. Bin. | OLS | Poisson | Neg. Bin. | OLS | Poisson | Neg. Bin. | |
| Med. educ hh | −0.379 (0.082)*** |
−0.225 (0.046)*** |
−0.229 (0.049)*** |
−0.637 (0.016)*** |
−0.323 (0.0074)*** |
−0.332 (0.0086)*** |
−0.679 (0.015)*** |
−0.353 (0.0075)*** |
−0.363 (0.0091)*** |
| High educ hh | −0.717 (0.12)*** |
−0.572 (0.083)*** |
−0.584 (0.086)*** |
−1.325 (0.021)*** |
−1.126 (0.015)*** |
−1.152 (0.016)*** |
−1.477 (0.019)*** |
−1.434 (0.015)*** |
−1.447 (0.017)*** |
| Med. educ. spouse | −0.251 (0.10)** |
−0.083 (0.053) |
−0.082 (0.056) |
−0.494 (0.022)*** |
−0.138 (0.0093)*** |
−0.131 (0.011)*** |
−0.437 (0.021)*** |
−0.124 (0.0097)*** |
−0.129 (0.012)*** |
| High educ. spouse | −0.332 (0.16)** |
−0.079 (0.088) |
−0.073 (0.093) |
−0.782 (0.031)*** |
−0.209 (0.016)*** |
−0.185 (0.019)*** |
−0.524 (0.031)*** |
−0.062 (0.018)*** |
−0.043 (0.021)** |
| Age hh | 0.128 (0.041)*** |
0.095 (0.027)*** |
0.093 (0.028)*** |
0.167 (7.2e-3)*** |
0.152 (4.4 e-3)*** |
0.147 (4.9e-3)*** |
0.145 (6e-3)*** |
0.123 (0.0041)*** |
0.120 (0.0047)*** |
| Age2 hh | −0.002 (5.7e-4)*** |
−0.001 (3.7e-4)*** |
−0.001 (3.9e-4)*** |
−0.002 (1e-4)*** |
−0.002 (5.9e-5)*** |
−0.002 (6.7e-5)*** |
−0.002 (8.7e-5)*** |
−0.002 (5.6e-5)*** |
−0.002 (6.5e-5)*** |
| Age spouse | 0.104 (9.5e-3)*** |
0.069 (0.0058)*** |
0.070 (0.0061)*** |
0.093 (1.8e-3)*** |
0.053 (8.5e-4)*** |
0.056 (1e-3)*** |
0.089 (1.6e-3)*** |
0.055 (8.4e-4)*** |
0.059 (0.0010)*** |
| Age2 spouse | −0.002 (2e-4)*** |
−0.001 (1.2e-4)*** |
−0.001 (1.3e-4)*** |
−0.001 (3.4e-5)*** |
−0.001 (1.7e-5)*** |
−0.001 (2e-5)*** |
−0.001 (3.2e-5)*** |
−0.001 (1.8e-5)*** |
−0.001 (2.1e-5)*** |
| Region | −0.283 (0.074)*** |
−0.178 (0.042)*** |
−0.182 (0.044)*** |
−0.176 (0.014)*** |
−0.120 (0.0069)*** |
−0.141 (0.008)*** |
−0.257 (0.012)*** |
−0.186 (0.0067)*** |
−0.198 (0.0083)*** |
| Sex of hh | 0.525 (0.11)*** |
0.433 (0.071)*** |
0.455 (0.076)*** |
0.643 (0.015)*** |
0.445 (0.0082)*** |
0.506 (0.010)*** |
0.655 (0.012)*** |
0.505 (0.0074)*** |
0.564 (0.0091)*** |
| Non labour inc. hh | 0.012 (3.8e-3)*** |
0.008 (0.0022)*** |
0.008 (0.0023)*** |
0.009 (6.6e-4)*** |
0.006 (3.5e-4)*** |
0.006 (4.1e-4)*** |
−0.042 (1.5e-3)*** |
−0.026 (7.7e-4)*** |
−0.028 (9.9e-4)*** |
| Non labour inc. sp. | 0.013 (0.0058)** |
0.005 (0.0029)* |
0.006 (0.0031)* |
0.008 (8.9e-4)*** |
0.004 (0.0004)*** |
0.004 (4.9e-4)*** |
(-) | (-) | (-) |
| Constant | −0.870 (0.700) |
−1.653 (0.48)*** |
−1.625 (0.50)*** |
−1.421 (0.13)*** |
−2.561 (0.079)*** |
−2.522 (0.088)*** |
−0.616 (0.106)*** |
−1.812 (0.072)*** |
−1.819 (0.082)*** |
| Observations | 1,431 | 1,431 | 1,431 | 53,661 | 53,661 | 53,661 | 59,329 | 59,329 | 59,329 |
-
Standard errors in parentheses.
-
*
Significant at 10%.
-
**
significant at 5%.
-
***
significant at 1%.
-
Source: Own estimations based on household surveys.