A fine grained hybrid spatial microsimulation technique for generating detailed synthetic individuals from multiple data sources: An application to walking and cycling
- Institute for Transport Studies University of Leeds, United Kingdom
- School of Geography University of Leeds, United Kingdom
- Article
- Figures and data
- Jump to
Figures

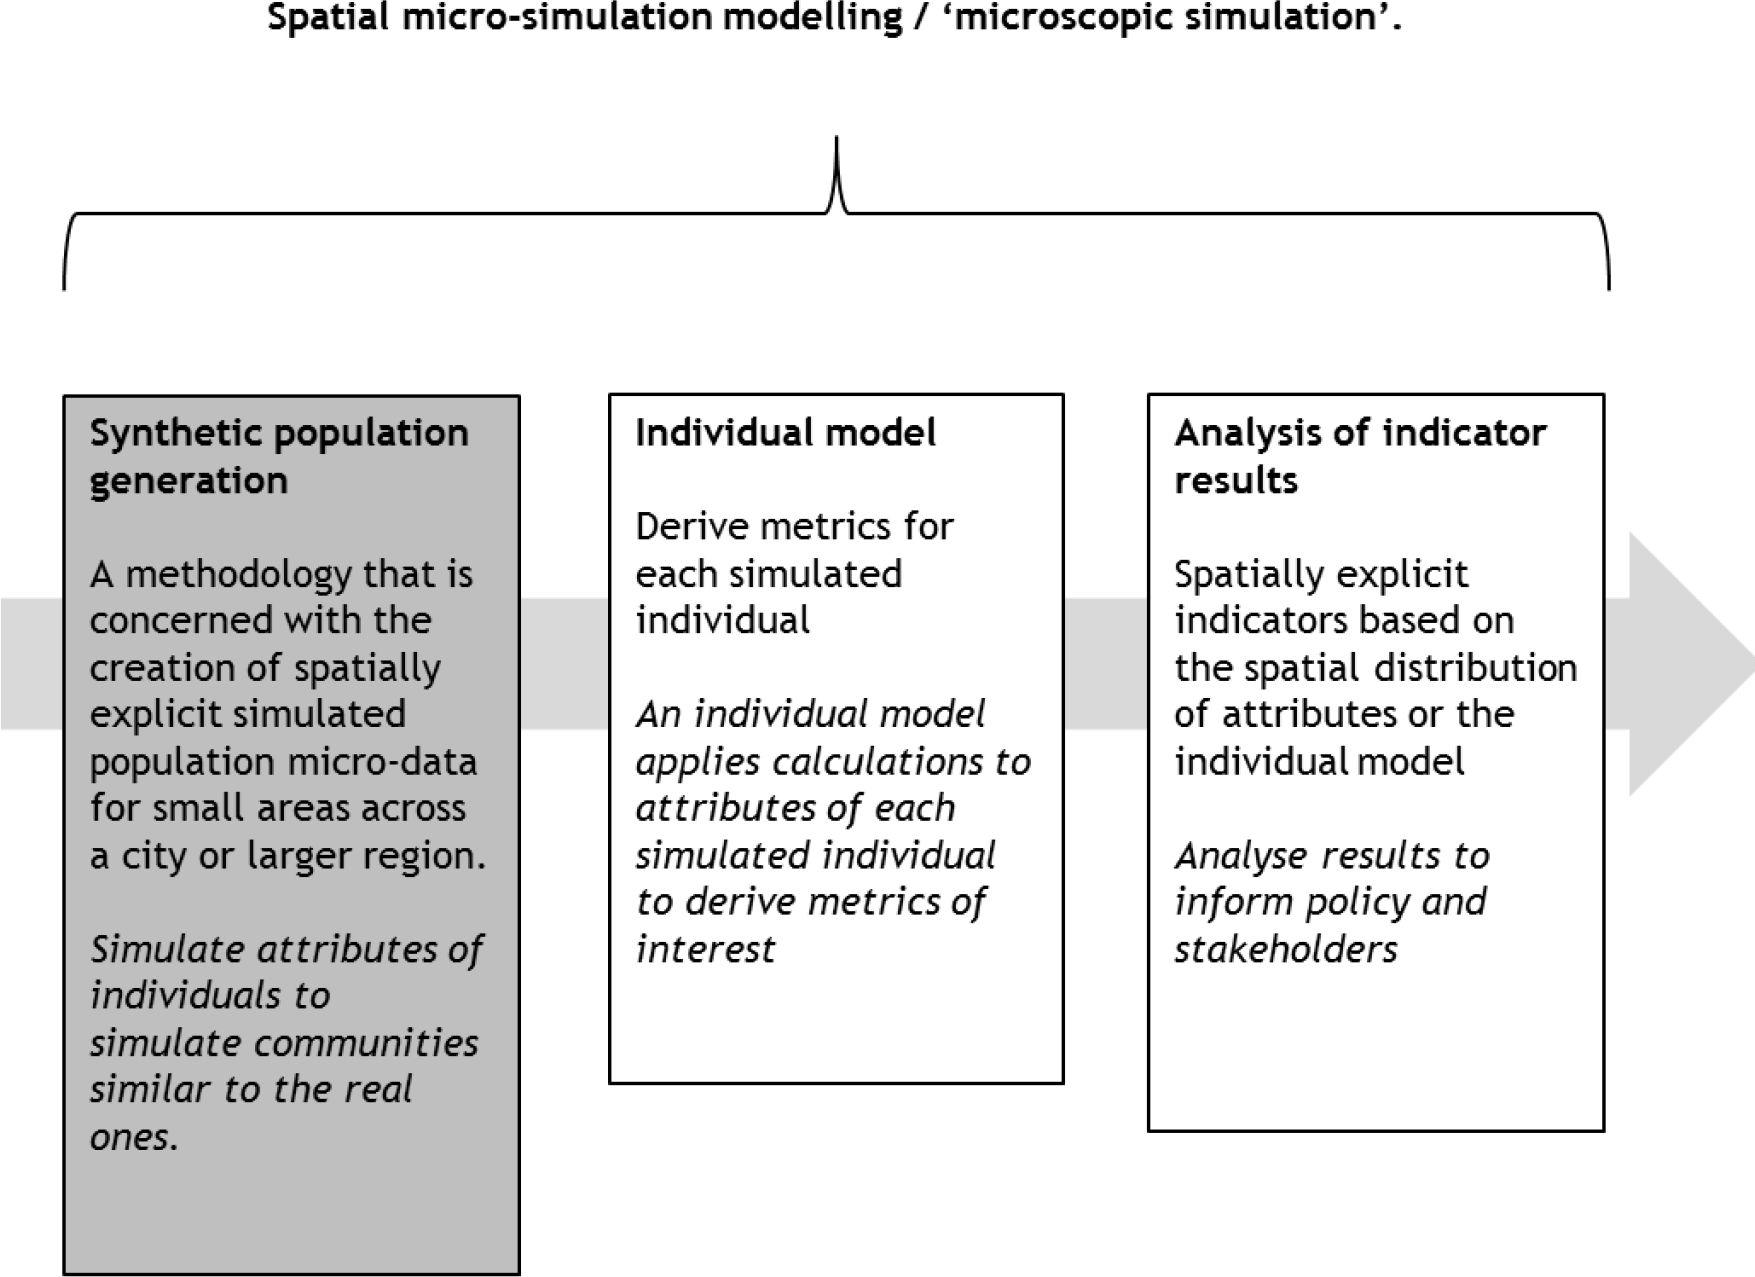
The phases of the spatial microsimulation modelling process. In this paper we are concerned with proposing a hybrid technique for synthetic population generation.

The main steps in the algorithm.

Stage 2 of the hybrid microsimulation technique using Monte-Carlo sampling.

An estimate of the percentage indicator error resulting from the hybrid spatial micro simulation technique, showing Leeds and surrounds.

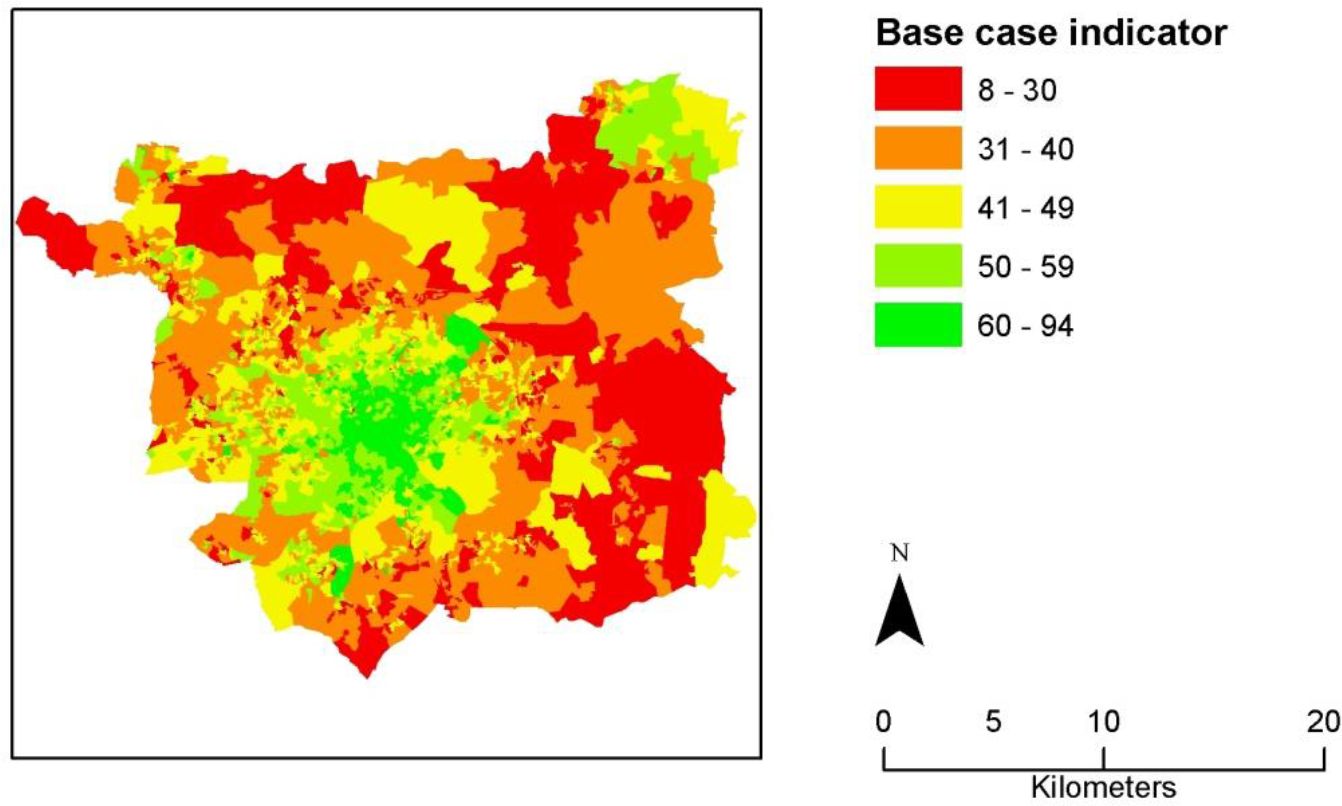
The indicator for Leeds Output Areas. The percentage of working individuals aged 16–74 in an Output Area capable of commuting to their current place of work by walking or cycling.

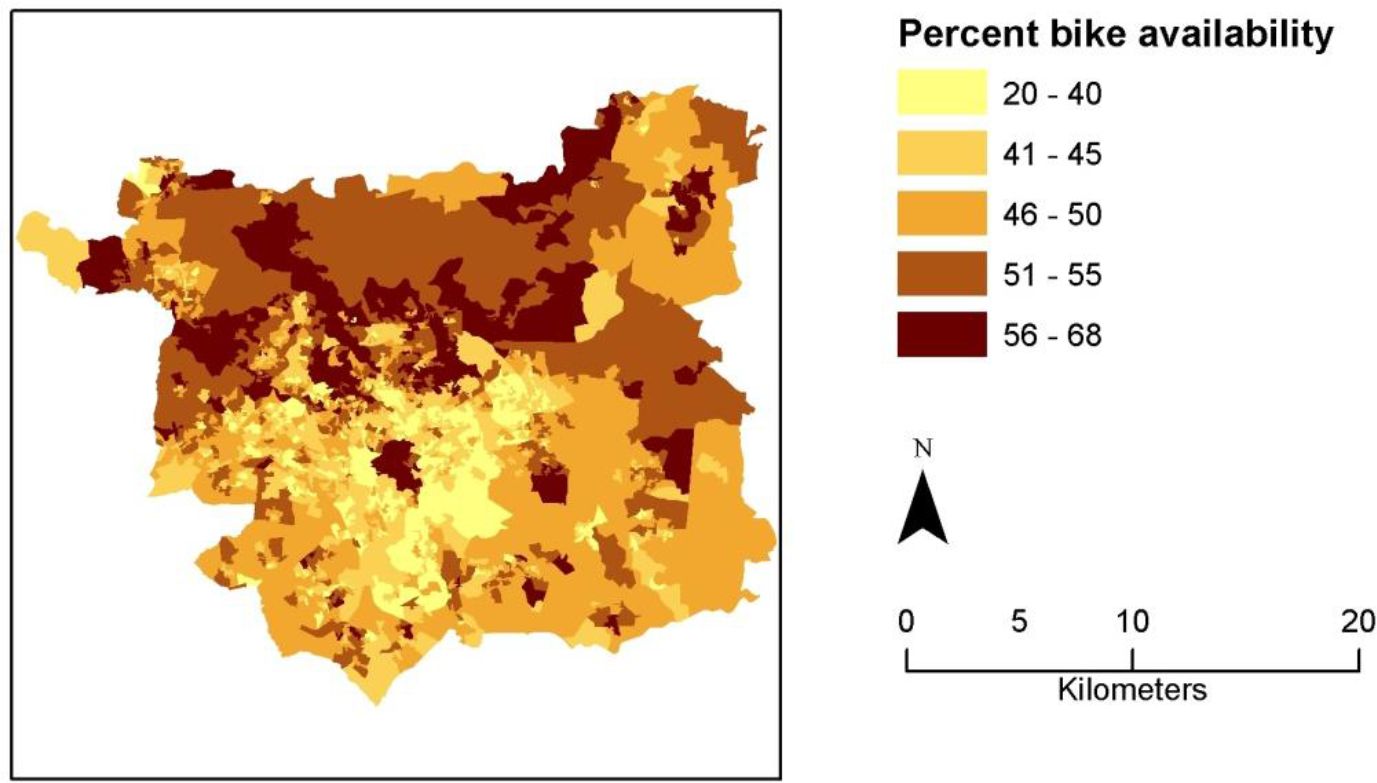
Percentage of working population in Leeds OAs with access to a bike.

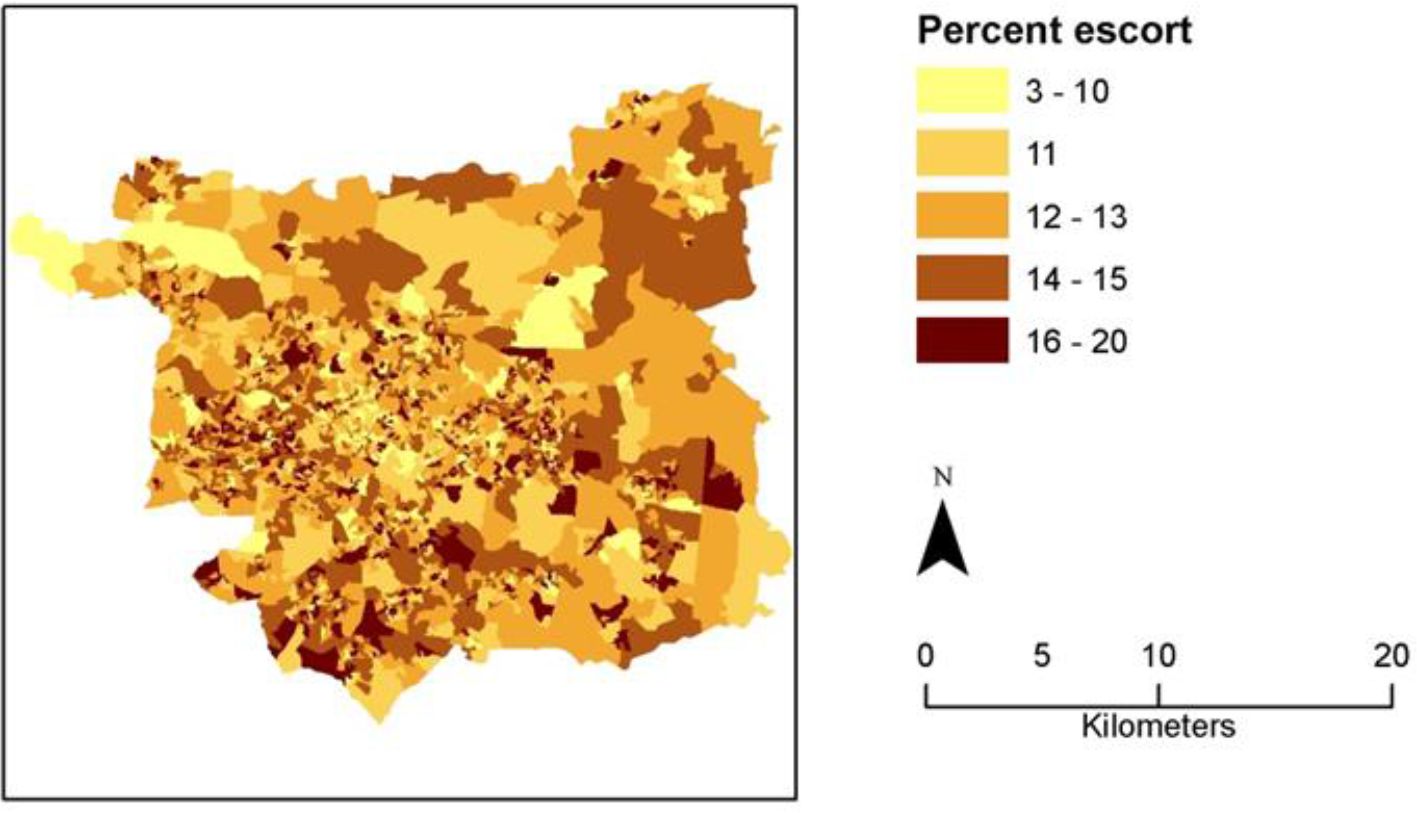
Percentage of working population in Leeds OAs needing to escort children during the commute to work.
Tables
Attributes and data sources used in Phase 1 (synthetic population generation) of the spatial-microsimulation modelling process.
| Variable | Data source | Possible values | Constraint | Stage * |
|---|---|---|---|---|
| Physical activity (days in last 4 weeks with 30+mins vigorous activity) | HSE | 0–28 | N | 1 |
| Body Mass Index (kg/m2) | HSE | 15–48 | N | 1 |
| Age group | Census: Table CS028 Sex and Age (16–74) by Economic Activity & HSE | 16–24, 25–34, 35–54, 55–64, 65–74. | Y | 1 |
| Gender | Census table CS028 & HSE | M/F | Y | 1 |
| Weight (kg) | HSE | 32–130kg | N | 1 |
| Bicycle availability | NTS /(Anable, 2010) | Probability given age, gender and NSSEC | N | 2 |
| The need to escort children on commute | NTS / Children & Early Years Survey, 2010 | Probability given age and gender | N | 2 |
| Current commute distance | Census table CAS120 | Bins, 0, 0–2, 2–5, 5–10, 10–20, 20–40, 40–60, < 60, not fixed. | Y | 2 |
| Economic activity | Census table CS028 & HSE | Working, unemployed, student, economically inactive. | Y | 1 |
| LLTI | Census table CS021 and HSE | Y/N | Y | 1 |
| Highest educational qualification | Census table KS013 and HSE | 6 categories | Y | 1 |
| NSSEC by sex | Census tables KS014 b and c. & HSE | 10 NSSEC categories by gender | Y | 1 |
-
Source: Health Survey for England, 2008 (HSE), National Travel Survey (NTS), UK Census, 2001, Limiting Long Term Illness (LLTI), National Statistics Socio-Economic Classification (NSSEC).
-
Notes: * The column ‘Stage’ refers to the simulated annealing Stage 1 or Monte-Carlo sampling Stage 2 of the synthetic population generation phase described in Section 4.
Summary of how proposed technique is distinct from other techniques.
| Technique | Comment on suitability for use on model of interest | How our proposed hybrid technique differs |
|---|---|---|
| Single-stage simulated annealing Deterministic reweighting Sample-based synthetic reconstruction | Not suitable because not all data in the model of interest is in one micro-data sample | Can deal with individual attribute data from multiple sources |
| Sample-free synthetic reconstruction | This may be suitable as it can handle data from multiple data sources and current developments mean it may be effective at simulating populations at the finest resolution | Specifically seeks to incorporate simulated annealing (rationale in text of Section 3.2) |
| Imputation using multiple existing synthetic populations | This may be suitable if it is accurate at simulating populations at the finest zones, and may be useful where there are existing synthetic populations | May be useful where suitable populations are not available |
| Imputation to better simulate under-represented individuals in a single micro-data sample | Not suitable on its own because not all data in model of interest is in one micro-data sample | Hybrid technique can deal with individual attribute data from multiple sources. We model stochastic variation in pedal power through cloning. Lymer, et al., 2009 also use a cloning approach which may inform future developments of our technique |
Pseudocode.
|
1: Select reference population table 2: Calculate cell value based on frequencies: 3: Raw cell value / raw row total) * reference population total 4: Intergerise the decimal value from the previous step: Round the value up or down 6: If rounded value ≠ reference population total then 7: If reference population total < integerised row total then 8: subtract 1 from a random cell in the row 9: If reference population total > integerised row total then 10: add 1 to a random cell in the row. 11: Repeat until rounded value = reference population total |
Pseudocode.
|
1: For Ntotal iterations 2: CREATE TABLE COMMUTE_DISTANCE_DRAW_N 3: For each gender by age group 4: For all individuals in EMPLOYEE table who are in this gender by age group 5: Set commute distance bin by drawing a random number between 0 and 1 and comparing it to the cumulative proportion in the cumulative distribution table 6: Set the commute distance = 7: minimum distance in bin + (random number [0–1] * maximum distance in bin). 8: For Ntotal iterations calculate the maximum distance the population can travel 9: CREATE TABLE MAXIMUM_DISTANCE_DRAW_N for iteration N 10: SELECT data from SAMPLEPOPULATION & EMPLOYEE (this table contains probability of bike availability given Stage 1 attributes and probability of escort trip given Stage 1 attributes) 11: WHERE the probability of having a bike > [random number between 0 and 1] set individual has bike = 1 12: WHERE the probability of having to escort children to school > [random number between 0 and 1] set individual has to escort children = 1 13: UPDATE MAXIMUM_DISTANCE_DRAW_N [Calculate maximum distance each individual is capable of travelling] |
Pseudocode.
|
1: For Ntotal iterations 2: CREATE TABLE INDIVIDUAL_RESULT_DRAW_N 3: JOIN commute distance draw N and maximum distance draw N 4: For each individual 5: Capability to commute = 1 where maximum distance – commute distance >= 0 6: Capability to commute = 0 otherwise. 7: CREATE TABLE INDICATOR_result_draw_N (fields: Output Area ID, sum of people with capability to commute, % of employed population with capability to commute). |
Synthetic population outputs.
| Output | Table | Attributes |
|---|---|---|
| Ntotal synthetic populations of individuals | INDIVIDUAL _RESULT_DRAW_N | Physical activity, BMI, age, gender, weight, bicycle availability, need to escort children on commute, pedalling power, maximum travel distance, commute distance, capability to commute by walking or cycling. |
| Ntotal summaries of the % of the working population in an Output Area capable of commuting by walking or cycling | INDICATOR_RESULT_DRAW_N | Zone code, % of population capable of commuting by walking or cycling |
| Summary of capability of all populations at Output Area resolution | INDICATOR_RESULT_DRAW_SUMMARY | Zone code, % of population capable of commuting by walking or cycling for each iteration, mean capability for all populations, standard deviation of capability for all populations |
Summary of internal validation tests.
| Variable name | Percent cell error |
|---|---|
| Sex by age by economic activity | 0.065 |
| Education | 0.065 |
| LLTI | 0.065 |
| NSSEC with 3 categories | 0.065 |
| Commute distance by age by sex | 0.76 |
Results of external validation tests.
| Unconstrained attribute | Results compared |
|---|---|
| BMI (Obesity used as a proxy) | % of adult population classified as obese |
| Public Health England (PHE) national estimate (HSE data, 2006 — 2008) | 24.2 |
| Synthetic population using hybrid technique | 23.9 |
| Bike availability | % of adult population with use of a bike |
| NTS, 2010 national estimate of bike availability amongst adults. | 37.2 |
| Synthetic population using hybrid technique | 38.3 |
| Physical activity | % of adult population with no participation in sport |
| Active People Survey (APS), people not doing 1x30 minutes sport per week | 57.0 |
| Synthetic population using hybrid technique | 58.7 |
Correlations of individual attributes with the indicator.
| Attribute | Correlation with indicator value |
|---|---|
| Age | −0.33 |
| % female | −0.58 |
| BMI | −0.156 |
| % obese | −0.132 |
| Pedal power | 0.247 |
| % bike | −0.305 |
| % escort | −0.082 |
| Slope | −0.122 |
| Commute distance | −0.267 |
| Maximum travel distance | 0.077 |