A tax-benefit model for Austria (AUTAX): Work incentives and distributional effects of the 2016 tax reform
- Independent Researcher, Austria
Abstract
This study introduces a tax-benefit model based on administrative data for Austria (AUTAX) that can be used for the ex ante and ex post evaluation of reforms of personal income taxation and social benefits. We analyze the effects of the 2016 Austrian tax reform ex ante and concentrate on the effects on the distribution of net income and on work incentives. Our results show that the changes to the tax brackets have slightly increased inequality, and the middle- and high-income earners profited most. This effect has been significantly lowered by an increase in the negative income tax for low-income earners. By calculating average effective tax rates (AETRs) as well as marginal effective tax rates (METRs) along the whole income distribution in our model, we discuss changes on work incentives on the extensive but also on the intensive margin. We show that the 2016 tax reform positively affected the work incentives on the extensive and the intensive margin for higher income groups. The additional change in the negative income tax had only an impact on the extensive margin of low-income earners. These low-income earners are usually part-time workers, therefore giving a higher incentive to work part-time but no additional incentive to increase working hours. We show that a decrease in social security contributions instead of an increase in the negative income tax for low-income earners would lead to an increase in both the extensive and the intensive margin.
1. Introduction
The Austrian income tax system is complex. Tax burden in Austria increases constantly due to the fact that the bracket creep is not automatically offset.1 Such increases in the tax burden have led to multiple tax reforms over previous years. The reforms, which take place irregularly, have led to a significant increase in the complexity and to constant changes not only in the tax brackets, but also in the tax rates and diverse allowances. Most of those reforms have influenced both the income distribution and the work incentives. Detailed informations regarding the development of the Austrian personal income tax system since 1955 is summarized by Schratzenstaller and Wagener (2009).
Tax reforms and the implied distributional effects and incentives are a topic of interest in Austria. Both, income distribution and work incentives are constantly being altered due to the reforms. While the latest tax reforms of 2005 and 2009 have been broadly discussed2, this study set up a tax-benefit model to analyze the effects of the 2016 tax reform on income distribution, as well as work incentives, on the extensive and intensive margin.
Many cash transfers and allowances are based on households and not individuals and are therefore not covered in the broadly used personal income statistics. This paper introduces a tax-benefit model (AUTAX) that simulates social contributions, personal income tax and most of the cash allowances on a personal level.3 Transfers are not covered in our model, except for the simulation of the negative income tax, which is in fact a transfer to low-income groups, and hence not covered by the usual wage tax statistics. It is a static model that implies that our results show first order effects. We use data from the wage tax statistics of the Austrian Statistical Office, which covers one percent of the taxable persons (including retired but excluding self-employed) in Austria.
Most of the studies on the 2016 Austrian tax reform do not or only partly consider work incentives in their analysis. Our model allows us to take a closer look on work incentive effects of changes in the tax system for specific income groups. By calculating average effective tax rates (AETRs) as well as marginal effective tax rate (METRs) along the whole income distribution, changes of work incentives due to the 2016 tax reform on the extensive but also on the intensive margin given a specific income level can be determined.
Several tax-benefit models already exist for Austria. EUROMOD, which is a tax-benefit microsimulation model for the European Union, is used by many researchers in Austria. Additionally, there is the tax-benefit model ITABENA generated by the Institute for Advanced Studies Vienna, as well as the ATTM (of the GAW institute), and the WIFO microsimulation model.
Our model offers one significant advantage over the above-mentioned tax-benefit models in Austria, which is the use of administrative instead of survey data. We use administrative tax data, which results in a much larger sample compared with the other Austrian models that use a mixture of survey and administrative data4 such as the Austrian part ofthe European Union Statistics on Income and Living Conditions (EU-SILC)5, and leads therefore to a smaller measurement error. That is especially important when one analyzes distributional effects. Moreover, as shown in detail later on, survey data do not often correlate well with the actual tax receipts at the lower end of the income distribution, and are therefore of limited use when it comes to analyzing work incentives for low-wage earners. This problem is overcome by using the administrative data.
However, the use of survey (or partly survey) data does have various advantages. The use of EU-SILC data allows for the consideration of household-based tax-credits and benefits. In addition, it is possible to not only consider employees, but also self-employed persons. It is therefore clear that AUTAX should be seen as an additional tool to validate results from the already existing tax-benefit models regarding data issues. As we will demonstrate later, AUTAX, as well as the other tax-benefit models, face data and implementation difficulties. For policy analysis in Austria, a tax-benefit model based on administrative data such as AUTAX does not exist. The possibility of comparing results from microsimulation based on administrative as well as survey data might help to identify data problems.
This paper is structured as follows: The next section (Section 2) covers the Austrian wage tax system before and after the 2016 tax reform. Section 3 introduces a new tax-benefit model for Austria and compares the simulated values of the model for 2014 and the wage tax statistics. In Section 4, we use the model to simulate the ex ante results of the 2016 Austrian tax reform. In Section 5, we introduce alternative policy options to reduce the tax burden for low and middle incomes – a decrease in social security contributions – and compare the distributional effects as well as the changes in work incentives with the increase in negative income tax that was part of the 2016 tax reform. Section 6 concludes the findings of our study.
2. Labor taxation in Austria
The total tax wedge in Austria consists of four main elements. The net income (in the broad sense) is the difference between the total labor costs and the sum of the payroll taxes paid by employers, social contributions paid by employers and by employees, and income taxes paid by employees. As the tax system itself is rather complex, we represent the standard taxation mechanism for a single person household, neglecting changes to several tax allowances and credits such as the tax credits for childcare (“Kinderfreibetrag”), single earners and other family-specific tax reliefs. Additionally, we can not take into account that (a subset of the) blue-collar workers pay into several special funds, which constitute an additional job insurance and compensation for this group of workers (e.g. “Nachtschwerarbeit” or “Schlechtwetterentschädigungsbeitrag”).
2.1 The tax system in 2015 (before the reform)
The main payroll taxes paid by the employers are “Diensgeberbeitrag zum Familienlastenausgleichsfonds” (federal tax for family benefits equaling 4.5% of the gross salary), “Zuschlag zum Diensgeberbeitrag” (employer-contribution surcharge for employees – its level depends on the federal state, e.g. in Vienna it equals 0.4% of the gross salary) and “Kommunalsteuer” (federally-regulated tax payable to municipalities – 3% of the gross salary).
The wage tax is calculated from the gross income. Wages in Austria are usually paid 14 times per year. In the tax system, the gross wage is divided into two differently-taxed categories. The first part, the recurrent wage income, contains the regular monthly income paid 12 times a year. The second part consists of the so-called special payments (holiday and Christmas bonuses) paid usually twice a year and is taxed at a lower rate. Employees are asked to pay the “Arbeiterkammerumlage” (contribution to the chamber of workers), which equals 0.5% of their gross salary. The”Wohnbauforderungsbeitrag” (tax contribution for subsidizing the construction of residential buildings) constitutes in total 1% of the gross salary and is equally divided between the employee and employer. These two contributions are paid only from the recurrent wage income.
Social security contributions are paid from both the recurrent wage income and the special payments. The main parts of the social contribution are: retirement insurance, health insurance and unemployment insurance (rates of these contributions are summarized in Table A.1 in the Appendix. Additional contributions are accident insurance (in total 1.3% of gross salary, paid exclusively by the employer), the insolvency fund (in total 0.45% of the gross salary, paid exclusively by the employer) and the occupational retirement benefits (“Betriebliche Vorsorge” – equalling 1.53% of the gross salary, paid exclusively by the employer). The actual levels of the first three elements of the social security contribution depend on the occupational group and are levied proportionally to the gross salary between a lower and upper threshold. The lower constraint is the so-called social security income threshold (“Geringfügigkeitsgrenze” – EUR 405.98 per month in 2016), while the upper threshold is called the social security income cap (“Höchstbemessungsgrundlage” – EUR 4,650 per month, in 2015). The rates of the social security contributions are summarized in Table A.1 in the Appendix.
All of the above-mentioned social security contributions paid by the employee reduce the tax base of the income tax. Some additional tax-base-reducing allowances for employees are the “Werbungskosten” (work- related deductions – EUR 132 per year) and the “Sonderausgaben” (extraordinary expenses – EUR 54 per year). The last allowance is also applied to pensioners.
The taxable recurrent wage is taxed according to the tax rate schedule highlighted in Table 1a. The first EUR 11,000 of the tax base are tax exempt; above this level, the tax rate increases stepwise to 50%. The special payments are taxed according to the tax rate schedule presented in Table 1b. One should note that this tax rate is applied only for special payments above a yearly exemption limit of EUR 2,100 (“Freigrenze”).
The tax system in 2015.
| (a) Recurrent wage income tax rates. | |
|---|---|
| Tax base(EUR) | Tax rate |
| 0 – 11,000 | 0% |
| 11,000 – 25,000 | 36.5% |
| 25,000 – 60,000 | 42.21% |
| > 60,000 | 50% |
| (b) Tax rates for special payments. | |
| Tax base(EUR) | Tax rate |
| 0 – 620 | 0% |
| 620 – 25,000 | 6% |
| 25,000 – 50,000 | 27% |
| 50,000 – 83,333 | 35.75% |
| > 83,333 | 50% |
-
Source: Schratzenstaller (2009).
The wage-tax burden for employees was calculated based on the two presented tax rate schedules and is further reduced by two tax credits, namely by the “Arbeitnehmerabsetzbetrag” (employee tax credit-EUR 54 per year) and the “Verkehrsabsetzbetrag” (travel expenses tax credit – EUR 291 per year). For pensioners the tax burden is reduced by the “Pensionistenabsetzbetrag” (pensioners tax credit), which amounts to EUR 400 per year for a tax base below EUR 17,000; between 17,000 and 25,000 EUR, the tax credit for pensioners decreases stepwise to zero.6
2.2 The tax system after the 2016 reform
The 2016 tax reform did not changed the general design of the wage tax system in Austria, it only adjusted the parameters. Apart from some minor changes in social security contributions, the the main adjustment was implemented on the tax rate schedule itself. The taxable recurrent income is now taxed according a new tax rate schedule highlighted in Table 2. The exemption limit as well as the taxation of the special payments below EUR 83,333 was left unchanged (see Table 1b). Similarly, as before the 2016 reform, special payments above EUR 83,333 are taxed as recurrent income, i.e. special payments between EUR 83,333 and EUR 166,667 are taxed at 50%, while above EUR 166,667 are taxed at 55% from 2016.
Tax rates for recurrent wage in 2016.
| Tax base (EUR) | Tax rate |
|---|---|
| 0 – 11,000 | 0% |
| 11,000 – 18,000 | 0% |
| 18,000 – 31,000 | 35% |
| 31,000 – 60,000 | 42% |
| 60,000 – 90,000 | 48% |
| 90,000 – 1,000,000 | 50% |
| > 1,000,000 | 55% |
New tax brackets have been introduced. The tax rate for a taxable income between EUR 11,000 and 18,000 has been lowered to 25% (compared to 36.5% before). For income between EUR 18,000 and 31,000 the tax rate was also slightly lowered to 35% (compared to 36.5% for wages between EUR 25,000 and 42.21% afterwards). Figure A.1 in the Appendix shows the changes in the tax rates and the tax brackets resulting from the last two income tax reforms in Austria.
In an additional step, the two tax credits for the employed, the employee tax credit and the travel expenses tax credit, have been merged to a single employee tax credit and its level was increased to EUR 400. The advertising expense lump-sum allowance and the extra charge lump-sum allowance stayed at the same level. Table 3 summarizes the changes in allowances and tax credits.
Lump-sum allowances and tax credits.
| Old system | New system | |
|---|---|---|
| (EUR) | ||
| Tax credits: | ||
| employee tax credit | 54 | - |
| deductible amount for travel expenses | 291 | 400 |
| pensioner tax credit | 400 | 400 |
| Lump-sum allowances: | ||
| advertising expense lump-sum | 132 | 132 |
| extra charge lump-sum | 60 | 60 |
The 2016 tax reform also introduced some minor changes regarding social security contributions. The social security income threshold has been increased to EUR 415.72 a month in accordance with the previous yearly adjustments. The social security income cap has been increased at a higher rate than the previous adjustments to EUR 4,860 a month. Moreover, the difference between blue-collar and white-collar workers has been abolished: the health insurance contributions for both groups is equal now 3.87%. Some changes for apprentices such as a reduction in contributions for health insurance as well as for unemployment insurance, were introduced. For a detailed overview of social security contributions, please consult Table A.1 in the Appendix.
For families, the child tax allowance (“Kinderfreibetrag”) has been increased. For single-income household with children, it has increased from EUR 220 to EUR 440. For a households with two incomes, the child tax allowance increased from EUR 132 to EUR 264 per parent. However, as argued by Gasior (2015), this tax allowance is not directly included in the tax system, therefore especially low-income groups tend not to apply for it.
In addition to the above mentioned changes that influence the net income, the negative income tax (NIT) was increased. The negative income tax can be considered a transfer that was introduced to adjust/reduce the social security contribution burden for low-income earners. The negative income tax is also not directly included in the tax system: the individual has to apply for this transfer via a yearly tax declaration. Until 2014, an individual with low income and social security contributions was eligible for 10% of his or her social security contributions (with a maximum of EUR 110 and pensioners were not eligible) as a transfer. In 2015, 20% of social security contribution (with a maximum of EUR 220 and EUR 55 for pensioners) could be received back as negative income tax. This was further increased in 2016 to 50% of social security contributions (with a maximum of EUR 400 and EUR 110 for pensioners). The idea behind this policy tool is to reduce the tax burden for low-income earners who do not pay income tax and are therefore not influenced by the changes in the tax rates and the tax brackets. Schratzenstaller et al. (2015) argues that only a portion of the low-income earners are compensated by the negative income tax, as not every employee makes the yearly tax declaration and hence receives this transfer.
In the old system, the elaboration of the negative income tax showed a discontinuity in payable taxes. According to the Budgetdienst (2015) this discontinuity in payable taxes was abolished due to a continuous decrease in the negative income. The abolished discontinuity can be seen also in Figure 6 in our study.
3. Model and data
To simulate the distributional effects of the 2016 Austrian tax reform, in the first step of our analysis we set up a traditional tax-benefit model.7 For an overview of the characteristics and features that are desirable for tax-benefit models see Immervoll and O’Donoghue (2009).
As previously mentioned, several other tax-benefit models exist that are based on (partly) survey data (EU-SILC8), but our model is the first to be based on administrative data and concentrates not only on distributional features, but also work incentives (by calculating marginal effective tax rates and average effective tax rates). We model the standard taxation mechanism on individual wage income, neglecting several tax allowances and tax credits for childcare (“Kinderfreibetrag”), single earners and other family-specific tax reliefs due to the fact that this information is not contained in the administrative data.
3.1 The data
Our model is based on the wage-tax statistics 2014 of the Austrian Statistical Office. The sample consists of 65535 observations and corresponds to 1% of the wage taxpayers. The dataset contains e.g. annual gross income, social security contributions, the total wage tax and some individual characteristics of the tax payers. Table 4 presents the summary statistics of the main variables.
Summary statistics (annual data).
| Variable | Mean | Std. Dev. | Obs. |
|---|---|---|---|
| (EUR) | |||
| Gross wage | 26,512.47 | 28,273.13 | 65,535 |
| Special payments (paragraph 67 (1–2) of the ESt)a | 3,437–61 | 3,284.93 | 65,535 |
| Social security and other contributions | 3,411.15 | 3,415.68 | 65,535 |
| Other wage income (paragraph 67 (3–8) of the ESt)b | 375.38 | 4,722.25 | 65,535 |
| Tax base | 18,982.57 | 21,216.19 | 65,535 |
| Total wage tax | 4,036.57 | 9034.34 | 65,535 |
-
a
The income tax law (“Einkommensteuergesetz 1988”, short ESt).
-
b
E.g. severance indemnities, dismissal wages etc.
3.2 The model
Our simulation model (AUTAX) covers the main components of the tax system. Figure 3.2 presents the steps of the simulation of the wage tax and the net income, which is subsequently used for the analysis of distributional effects. Starting with the gross wage, we distinguish between recurrent wage income and special payments. In the case of recurrent wage income, we deduct the social security contributions, contributions to the chamber of workers and the tax for subsidizing the construction of residential buildings. In the next step, we deduct the lump-sum job and non-job related allowances such as the expenses allowance.9
The gross recurrent income reduced by all social contributions and allowances is the taxable recurrent income, which is the tax base for the wage tax. We calculate the wage tax and deduct all possible tax credits (such as the employee tax credit, the travel expenses tax credit and the pensioner tax credit). Similarly, for special payments we deduct the social security contributions and calculate the wage tax according to the tax rate schedule on the special payments. Combining the wage tax on recurrent wage and the special payments, we calculate the total wage tax of each individual. The net income of a person equals, therefore, the gross income minus all social security contributions and the total wage tax.
To analyze the distributional effects ofthe tax reform, we compare the net wage income ofindividuals under the old and the new tax systems. Since we are interested in the distributional effects of the change in the tax system itself, we use the latest available data for 2014 and simply adjust the gross wages to the inflation rates in 2015 and 2016.10 This makes the assumption that there were no other changes in the wage structure (such as demographic changes, changes in real wages, changes in employment situation etc.) during this period, and therefore enables us to extract the effect of the reform only.
For the analysis of incentive effects of the tax reform, we compare the average effective tax rate as well as the marginal effective tax rates. Both are widely recognized concepts. While the average effective tax rate (AETR) is straightforwardly defined as:
The simulation model.
| Gross wage income | |
|---|---|
| Recurrent wage income | special payments (13. and 14. payment) |
| + additional wage (except 13. and 14.) | |
| - social security contributions on recurrent income (see Table A.1) | |
| - lump-sum commuter allowance | - social security contributions on special payments |
| - other job-related allowances | |
| - non-job-related allowances | |
| = taxable recurrent income (tax base) | = taxable special payments (tax base) |
| - income tax (see Table 2) | - income tax |
| + tax credits | on special payments (see Table 1b) |
| = net wage income (recurrent wage income) | = net wage income (special payments) |
where t is the total tax burden, which in our model is the social security contributions, the income tax and, if eligible, the negative income tax and y is the gross wage income. Due to the data restrictions, the social security contributions and other taxes paid by the employer cannot be taken into account.
Calculation of the marginal effective tax rate (METR) is analytically straightforward. It is defined by the first differences of the AETR, but since tax systems are usually characterized by discontinuities, we use a numerical approach to calculate the METR. We follow the definition of Immervoll (2004) to calculate the increase in net income that comes along with a marginal wage increase:
where y is again the gross wage income, d is the margin, AETR* is the average tax rate at a gross income level of y + d (in the case of an gross income increase by d), and AETR defines the average effective tax rate at an gross income level of y.
3.3 Advantages and disadvantages of the model
There exist several tax-benefit models for Austria. EUROMOD, a tax-benefit microsimulation model for the European Union, is used by many researchers in Austria. Additionally, there is the tax-benefit model ITABENA (see Dearing & Lietz, 2007), as well as the ATTM (see Steiner & Wakolbinger, 2009), and the WIFO microsimulation model (see Rabethge, 2009). All these models use the Austrian part of the European Union Statistics on Income and Living Conditions (EU-SILC) as the data source.
AUTAX is a static tax-benefit model, which implies that the results show first-order effects. The advantage of the model is that it uses the wage-tax statistics. Compared to other data sources, e.g. to EU-SILC data, the administrative wage-tax data has the advantage that it offers more than 65000 observations, while EU-SILC is based on survey data (only parts of the EU-SILC stem from administrative data), which has a sample size of about 12000 observations, depending on the survey year.11.
One disadvantage of the administrative data, however, is that it is not possible to distinguish between different lump-sum allowances (e.g. commuter, child care, single-earner and other family-specific tax allowances) as the wage-tax statistics 2014 allows us only to calculate the overall sum of the non-job-related allowances. Hence, the analysis is restricted to the individual and can only partly take into account the interaction between household-related tax benefits and income tax by simulating the overall observed tax-reliefs, however without the possibility of distinguishing between the effects of the different components.12 On the other hand, social transfers (for instance, child and housing benefits) cannot be accounted for due to missing data (with the exception of the negative income tax) – they are not recorded in the income-tax data.
The general limitations of survey data are described in Rossi, Wright, and Anderson (2013), while Hauser (2008) highlights the problems with the EU-SILC data for Germany and compares it to other data sources. Ceriani, Fiorio, Gigliarano, et al. (2013) additionally argues that national microsimulation models based on administrative data show a lower measurement error compared with models based on survey data.
Problems with survey data might arise, in particular, when we study the distributional effects. Lohmann (2011) shows that some results (such as the percentage of working poor) are most likely driven by different approaches to data collection (survey vs. administrative).
The data collection effects on the distribution ofincome can also be seen in Table 6, which compares the gross wage incomes according to the wage tax statistic 2014 and EU-SILC 2015. Especially on the lower tail of the distribution, significant differences may be observed between the two data sets – a problem that has already been identified by Liégeois, Berger, Islam, Wagener, et al. (2011) in the case of Luxembourg. The reasons for these differences are highlighted in Statistik Austria (2016). Nevertheless, this difference is reduced when only workers employed through the whole year are taken into account and in general, the overall shapes of the distributions remain similar (Liégeois et al., 2011). Yet, since in this work we are interested in analyzing work incentives specifically for low-wage earners, referring to survey data might result in a bias. Administrative data are a much more reliable source of information in this case. In general, Table 6 suggests, that EU-SILC data and administrative data differ significantly for the first four deciles of the income distribution.
Comparison of annual gross wage incomes: wage tax statistics 2014 and EU-SILC 2015.
| Percentile | Wage tax | EU-SILC | Difference |
|---|---|---|---|
| (EUR) | |||
| 10 | 4,463 | 2,860 | −35.9% |
| 20 | 10,743 | 8,061 | −25.0% |
| 30 | 16,943 | 14,938 | −11.8% |
| 40 | 22,420 | 20,774 | −7.3% |
| 50 | 27,714 | 26,612 | −4.0% |
| 60 | 32,704 | 31,903 | −2.4% |
| 70 | 38,367 | 38,265 | −0.3% |
| 80 | 46,483 | 45,809 | −1.4% |
| 90 | 61,317 | 59,943 | −2.2% |
| mean | 32,208 | 30,858 | −4.2% |
-
Source: Statistik Austria (2016)
3.4 Parametrization
As already outlined in the previous section the 2016 tax reform has mainly addressed the adjustment of the tax brackets and the tax rates. The wage taxes before and after the reform are computed using the tax rate schedules introduced in Tables 1a – 2.
Lump-sum allowances that reduce the tax base and tax credits that reduce the tax burden are chosen according to the Austrian tax law as follows: the social security income threshold and social security income cap are set to equal the 2015 levels. Both were increased by 2.17% a year on average between 2010 and 2015, which is slightly above the inflation rates during these years. The 2016 tax reform increased the upper ceiling for social insurance contributions from EUR 4,650 to EUR 4,860, which is an increase by 4.52%, thus by 2.35 percentage points above the regular level. In our model, we consider this as an additional change in the tax system caused by the tax reform, therefore the analyzed effects of the 2016 tax reform include the effect of this exceptional increase in the upper ceiling of the social security contribution.
Table 7 indicates the values for the social security contributions used in both models: the value of 4,750 Euro in the left column corresponds to the simulated level of the upper ceiling for social insurance contributions from the year 2015 as if it had been increased at the regular rate.
Monthly ceilings for social security contributions, 2016.
| Old system | New system | |
|---|---|---|
| (EUR) | ||
| Social security income cap | 4,750 | 4,860 |
| Social security income threshold | 416 | 416 |
Lump-sum allowances and tax credits are chosen according to the values mentioned in the previous section.
3.5 Robustness
To check the robustness of our simulation model we compare the simulated values with the actual ones included in the wage tax statistics 2014. Starting with the gross wage income, we simulate the wage tax and the net wage income and compare it with the actual data from 2014. In the second step we compare the distributions and take a closer look at the effects of the reform on the inequality measures.
Looking at the summary statistics in Table 8, we can see that we underestimate the average wage tax by approximately 10 Euro per person, mainly because we cannot control for some household-specific tax allowances. Regarding the net wage income, our simulation model underestimates the value by 137 Euro. For both the simulated wage tax and the net wage income our model leads to a higher standard deviation compared to the real data.
Summary statistics – simulated values (annual).
| Variable | Mean | Std. Dev. | N |
|---|---|---|---|
| (EUR) | |||
| Wage tax | 4,036.6 | 9,034.3 | 65,535 |
| Wag tax (sim) | 4,025.2 | 9,233.0 | 65,535 |
| Net wage income | 19,064.8 | 17,442.6 | 65,535 |
| Net wage income (sim) | 18,928.1 | 17,249.5 | 65,535 |
As highlighted in Table 9, the actual values and the simulated values ofthe model for wage tax and net income show a high correlation. The same holds true for all groups of individuals. Only the wage tax for apprentices seems to show some differences between the data and the simulated results.
Correlation realized values and simulated values.
| Wage tax | Net income | |
|---|---|---|
| Apprentices | 0.8508 | 0.9969 |
| Blue-collar workers | 0.9742 | 0.9979 |
| White-collar workers | 0.9931 | 0.9976 |
| Civil servants | 0.9905 | 0.9961 |
| Public-contract staff | 0.9853 | 0.9956 |
| Civil-servant pensioners | 0.9918 | 0.9972 |
| Pensioners | 0.9897 | 0.9971 |
| Individuals with care allowance | 1.0000 | 1.0000 |
| Other individuals | 0.9873 | 0.9975 |
| Total | 0.9922 | 0.9977 |

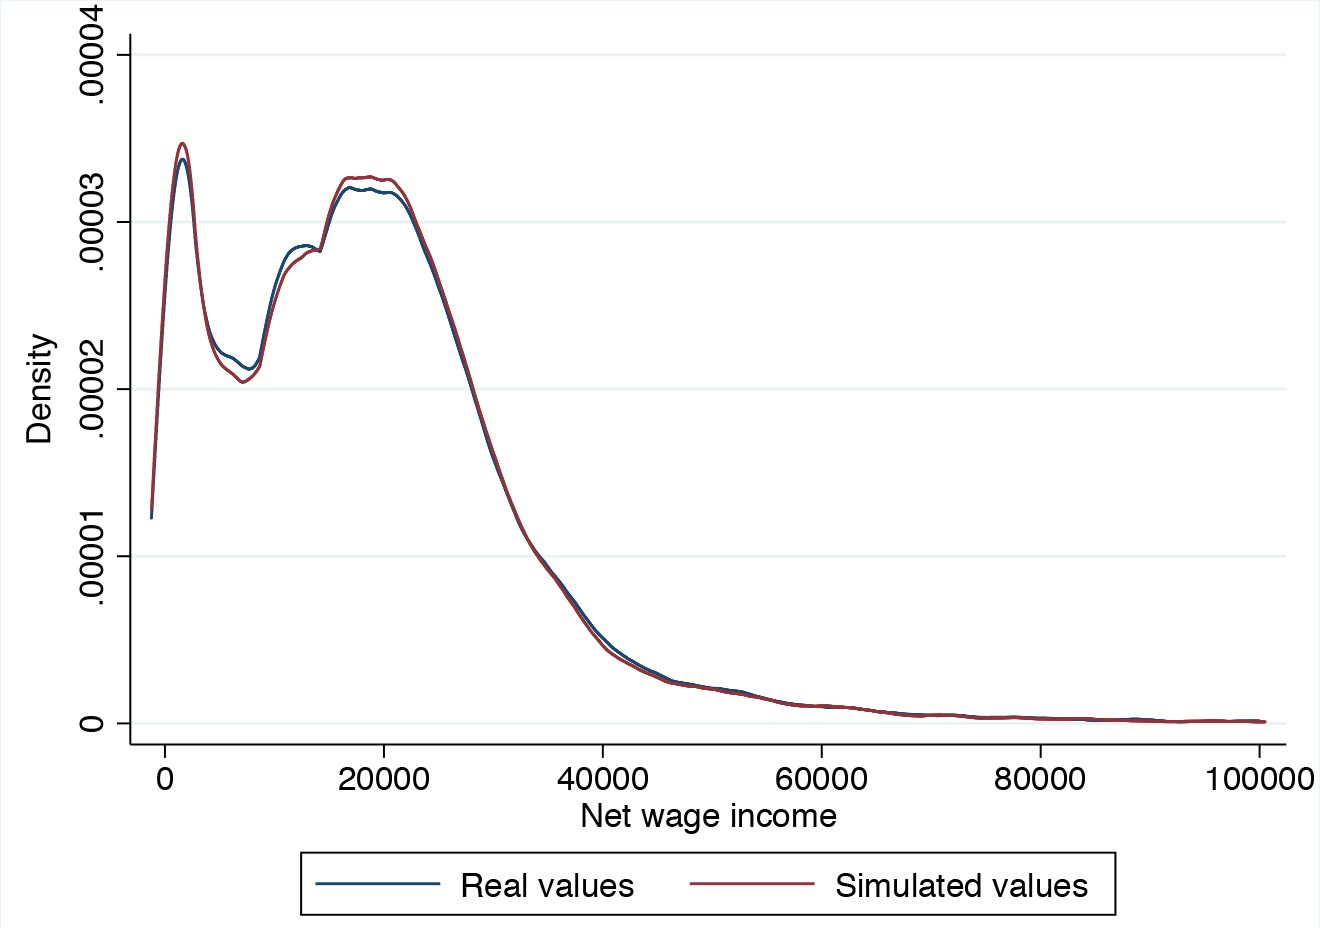
Distributions of the realized and the simulated values for net wage income.
When we compare the distributions of the simulated net wage income and the realized values of the Wage tax statistics 2014, we can again observe similar distributions. In the simulation, low annual net wage incomes (between EUR 0 and EUR 4,000) are slightly overestimated, while incomes of individuals with anet wage income between EUR 400 and EUR 12,000 are slightly underestimated. For the income level between EUR 12,000 and EUR 25,000 individuals are again slightly overestimated in the simulation. Between EUR 30,000 and EUR 50,000, the simulated data slightly underestimates the original data, and for a yearly income above EUR 50,000 the fit is almost perfect.
We use the independent 2-group Mann-Whitney U Test to test the equality of both distributions (see Table A.2 in the Appendix). It is used to test whether two independent samples are drawn from the same distributions. An advantage of this test is that the two samples under consideration do not necessarily need to have the same number ofobservations.
The effects on inequality measures are shown in Table 10. Our simulation slightly underestimates the income inequality measured by the Gini coefficient and the Theil Index. Nevertheless, when we compare the distributional impact of the tax reform, we compare the simulated values, therefore the simulation error will be included in both tax systems and therefore should not have a significant influence on the estimate of the distributional effects. Further inequality measures are listed in Table 10.
Inequality measures.
| Inequality measure | Net income | Simulated net income |
|---|---|---|
| Gini coefficient | 0.40911 | 0.40706 |
| Theil index (GE(a), a = 1) | 0.31261 | 0.31107 |
| Atkinson inequality measures (eps = 1) | 0.35335 | 0.35734 |
4. Simulation results
In this section, we firstly summarize the revenue effects of the 2016 tax reform according to our simulation model. Secondly, we analyze the effects on individual incomes and thirdly, we analyze the implications of the tax reform on the income distribution. Finally, we simulate some policy options that were discussed in recent political debates in Austria.
4.1 Effects on tax and social security revenues
The total financial relief resulting from the tax reform is estimated to be around EUR 4.2 billion. This is in line with other studies (Budgetdienst (2015); Rocha-Akis (2015)) that report a reduction in government revenues of approximately EUR 4.4 billion (including self-employed workers).
The tax reform leads to higher social security contributions, due to the adjustment of the upper threshold for social security contributions. This, in turn, indicates a lower tax base and consequently lower wage tax revenue for the government from high-wage incomes. In total, an increase of the upper threshold leads to an additional revenue of EUR 127 million for social security.
Changes in tax and social security revenues in 2016.
| Old system | New system | |
|---|---|---|
| (MEUR) | ||
| Total wage tax revenues | 27,644 | 23,451 |
| Net tax revenues | −4,193 | |
| Social security contributions | 23,912 | 24,039 |
| Net social security contributions | 127 | |
4.2 Effects on individual net wage income
Obviously, the tax reform decreased the individual tax burden for all taxpayers above the tax exemption limit. However, not all individuals are relieved at the same rate, e.g. on average employees have higher income (an pay higher social security contributions) than pensioners. Therefore, we take a closer look at socio-economic characteristics and study how different social groups have profited from the reform.
Table 12 shows large differences for distinct groups. While the 2016 tax reform increased the net wage income on average by EUR 620, for women this increase was only EUR 416, while men profited on average by EUR 836. This is mainly due to the fact that women in Austria have, on average, lower gross wage incomes because of higher employment in part-time jobs.13 In the relative terms men profited as well more than women from the 2016 tax reform, as net income has increased by 3.47% and 2.87%, respectively. The reason for this difference is that two thirds of the individuals who do not pay income taxes are women and for those individuals, net wage income was not influenced by the tax reform itself.14 If we only consider female and male employees, we can see that on average males profit more than females in absolute but also in relative terms.
Average annual net income by social groups.
| Old system | New system (EUR) |
Difference | ||
|---|---|---|---|---|
| Women | 14,504 | 14,920 | 416 | (2.87%) |
| Men | 24,107 | 24,942 | 836 | (3–47%) |
| Pensioners | 16,346 | 16,835 | 490 | (2.99%) |
| Employees | 20,673 | 21,362 | 689 | (3.33%) |
| Female employees | 16,511 | 17,021 | 510 | (3.09%) |
| Male employees | 24,363 | 25,211 | 848 | (3.48%) |
| Total | 19,179 | 19,799 | 620 | (3.23%) |
On average employees profit slightly more than pensioners. Their net wage income has increased by EUR 689, while pensioners net wage income has only increased by EUR 490. By contrast, in the relative terms, the increase was similar for the two groups: 3.33% for employees and 2.99% for pensioners.
Table 13 shows the effect of the tax reform for specific social groups. Those that profit most by the tax reform in absolute terms are civil servants (EUR 1,393) and civil servant pensioners (EUR 1,208), followed by white-collar workers (EUR 828) and public-contracted staff (EUR 823). The same holds true for the relative income gain. Both groups (civil servants and civil servant pensioners) profited by around 4%. This is driven by the fact that in these social groups, the proportion of income earners, who are less affected by the 2016 tax reform, is low.
Average annual net income by social status.
| Old system | New system (EUR) |
Difference | ||
|---|---|---|---|---|
| Apprentices | 7,255 | 7,627 | 372 | (5.12%) |
| Blue-collar workers | 14,616 | 15,075 | 459 | (3.14%) |
| White-collar workers | 25,112 | 25,940 | 828 | (3.30%) |
| Civil servant | 35,732 | 37,124 | 1,393 | (3.90%) |
| Public contract staff | 23,444 | 24,266 | 823 | (3.51%) |
| Civil servant pensioner | 29,850 | 31,058 | 1,208 | (4.05%) |
| Pensioner | 15,285 | 15,709 | 424 | (2.77%) |
| Other individuals | 8,927 | 9,145 | 218 | (2.45%) |
| Total | 19,179 | 19,799 | 620 | (3.23%) |
Calculating the effects of the tax reform for specific age groups (see Table 14), we can see that the differences are small compared with the differences relating to social groups mentioned above. However, the average tax reduction due to the 2016 reform is highest for those between 46 and 55 years (EUR 838), followed by the wage income earners aged between 36 and 45 years (EUR 749) and those between 56 and 65 years (EUR 692).
Average annual net income by age.
| Old system | New system (EUR) |
Difference | ||
|---|---|---|---|---|
| 16 to 25 years | 10,054 | 10,351 | 297 | (2.96%) |
| 26 to 35 years | 18,260 | 18,884 | 624 | (3.42%) |
| 36 to 45 years | 22,306 | 23,056 | 749 | (3.36%) |
| 46 to 55 years | 25,133 | 25,972 | 838 | (3.34%) |
| 56 to 65 years | 22,313 | 23,005 | 692 | (3.10%) |
| 66+ years | 16,682 | 17,197 | 515 | (3.09%) |
| Total | 19,179 | 19,799 | 620 | (3.23%) |
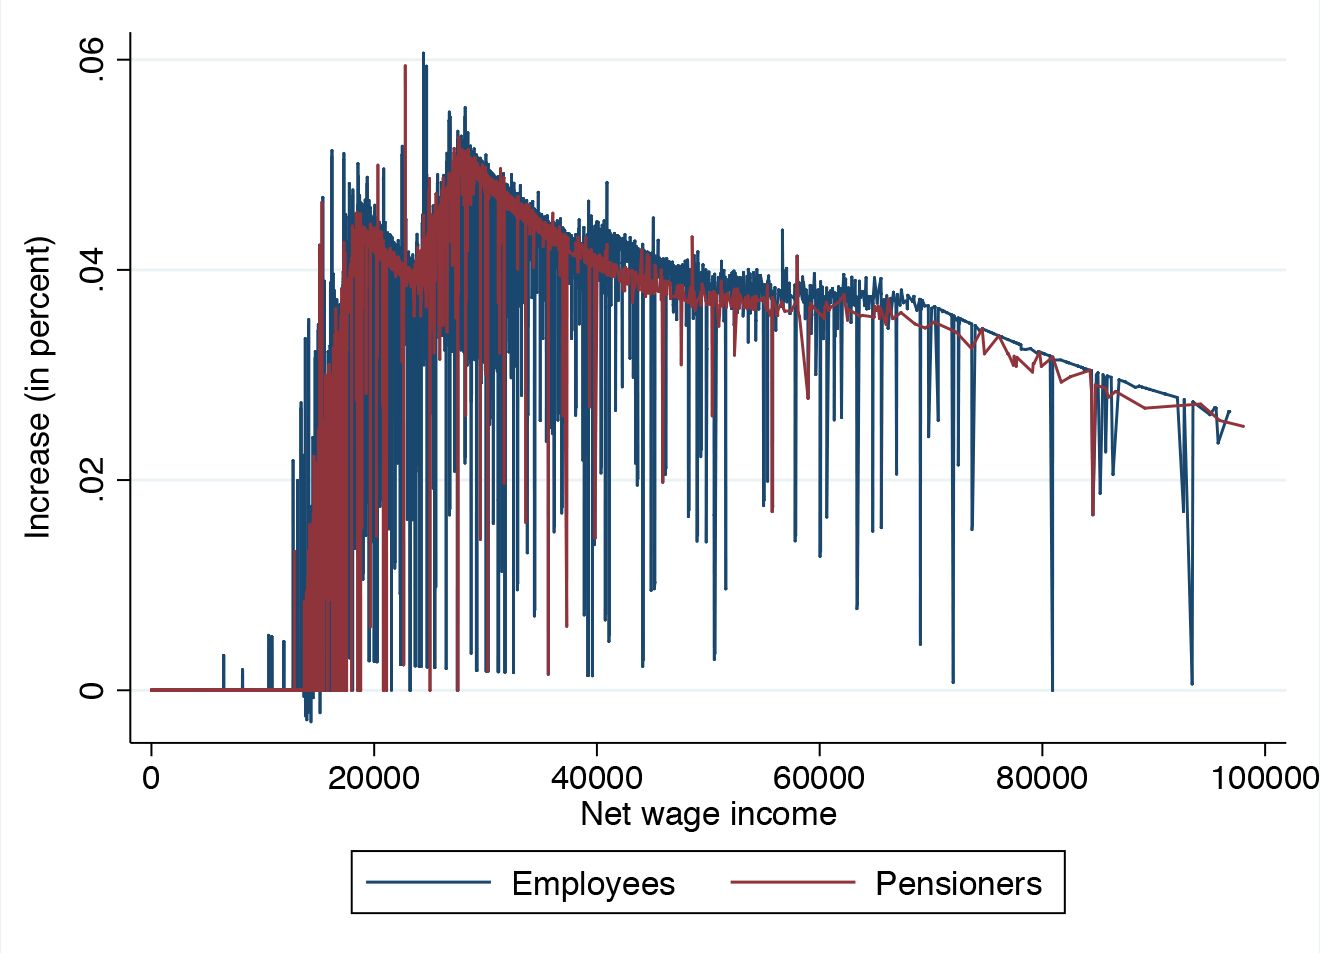
Taking a closer look at the tax burden reduction for specific income groups, Figure 2 shows that people with a gross income between EUR 20,000 and EUR 45,000, in particular, profited the most from the 2016 tax reform. The annual net income of this group increased by about 4 to 5%. Figure 2 also highlights the huge complexity of the Austrian tax system: there are significant differences in the income tax paid at the same gross income levels.

Annual net income increase of the 2016 tax reform.
4.3 Distributional effects
The distributional effects of the tax reform are particularly interesting for policy makers. The Austrian 2016 tax reform was intended to reduce the overall tax burden. As already mentioned, following the structure of the wage tax system, 28.1% of wage earners were not paying wage taxes in 2014. The idea of the 2016 reform was to reduce the tax burden especially for low income-groups. Nevertheless, it is not clear, whether this goal was met.
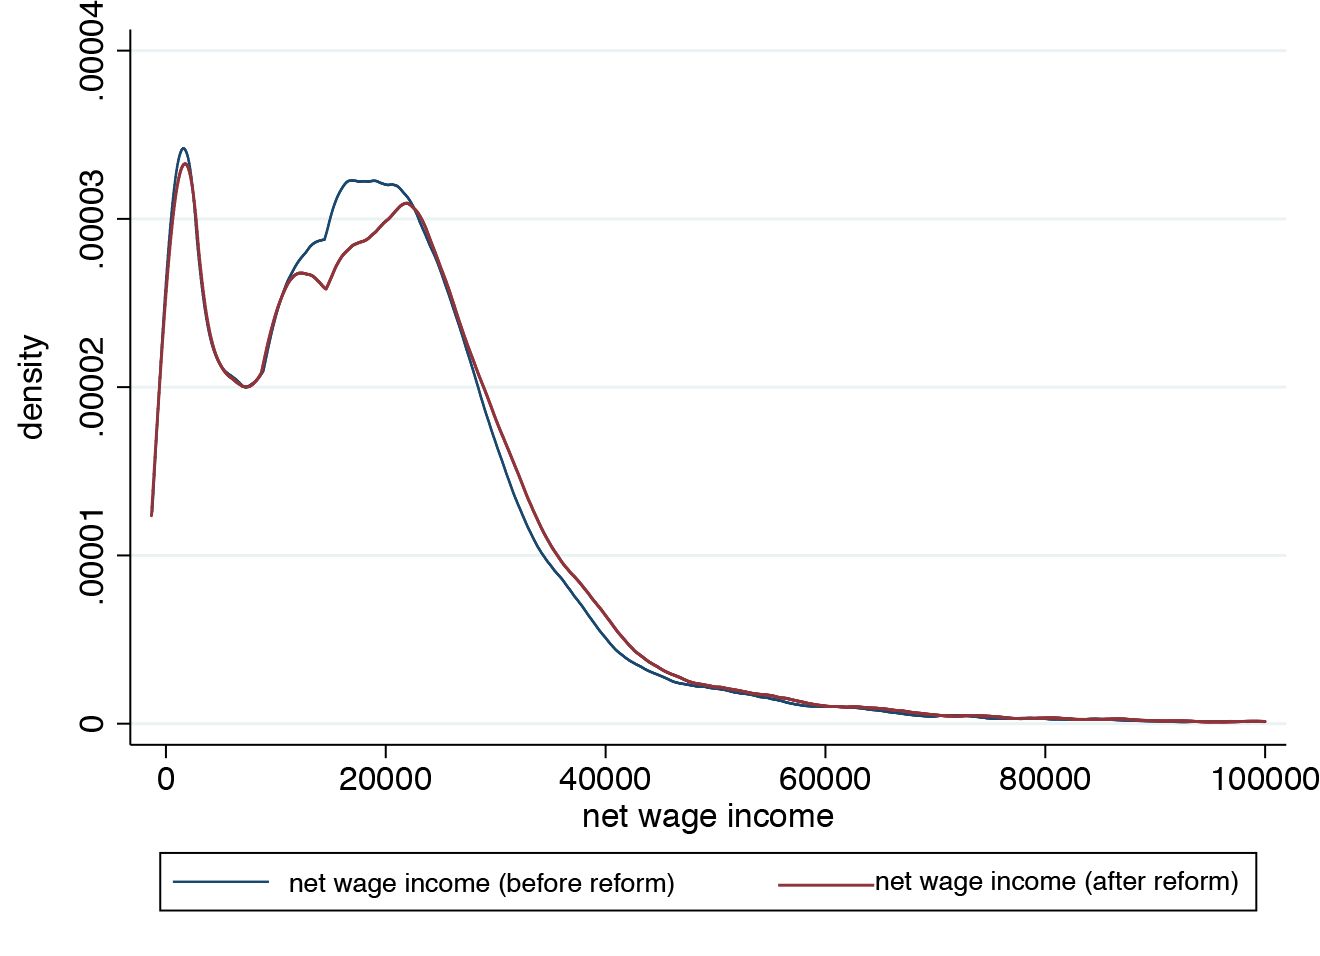
Figure 3 shows the density plot of net wage incomes before and after the tax reform. We can see a slight shift to the right for low incomes, which is mainly a result of the increased tax credits. The shift to the right in the distribution for net incomes between EUR 15,000 and EUR 25,000 is to a large extent an effect of the new tax rate of 25% that was introduced for the tax base between EUR 11,000 and EUR 18,000. In general, the outward shift indicates that as a result of the 2016 tax reform, the net wage income increased significantly for wage earners with a net wage income level between EUR 15,000 and EUR 35,000.

Distribution of net wage income before and after the 2016 tax reform.
Typical inequality measures for income distributions show that the inequality in wage incomes has increased. The Gini coefficient as well as the Theil-Index increased by almost 0.4 percentage points.
Inequality measures for 2016.
| Inequality measures | Old system | New system |
|---|---|---|
| Gini coefficient | 0.40606 | 0.41005 |
| Theil index (GE(a), a = 1) | 0.30688 | 0.31050 |
| Atkinson inequality measures (ε = 1) | 0.45917 | 0.46408 |
Indeed this result is somehow surprising. The fact that high-incomes profit more in absolute value but not in relative terms (see Figure 2) would suggest that the income inequality might be reduced. Howerver, this effect is masked by the fact that 28.1 percent of wage earners in 2014 did not pay any wage tax at all and therefore do not profit from the tax reform itself.
Next, we analyze the reform for different net wage income groups. Splitting our sample into deciles (see Table 16), we can take a closer look at the tax reduction for specific income groups. The results indicate that the 9th decile is the one that profited the most. The net wage income in this income group increased on average by EUR 1383 or 4.47%. Followed by the 8th decile, the 6th decile and the 7th decile. The 10th decile has on average a net income of EUR 53,066 after the reform and did not profit as much as the other income groups in relative terms mainly because of the increase of the upper threshold for social security contributions as well as of the decreasing effect of the tax reform for high-wage incomes (see Figure 2).
Annual net wage income by deciles.
| Old system | New system (EUR) |
Difference | ||
|---|---|---|---|---|
| 1st decile | 735 | 735 | 0 | (0.00%) |
| 2nd decile | 3,905 | 3,912 | 7 | (0.18%) |
| 3rd decile | 8,704 | 8,730 | 26 | (0.30%) |
| 4th decile | 12,684 | 12,710 | 26 | (0.20%) |
| 5th decile | 16,081 | 16,468 | 387 | (2.40%) |
| 6th decile | 19,177 | 19,942 | 765 | (3.99%) |
| 7th decile | 22,303 | 23,185 | 882 | (3.95%) |
| 8th decile | 25,841 | 26,902 | 1,061 | (4.11%) |
| 9th decile | 30,954 | 32,337 | 1,383 | (4.47%) |
| 10th decile | 51,400 | 53,066 | 1,667 | (3.24%) |
As shown in Table 16, the first three deciles do not profit from the 2016 tax reform, since most of them do not pay any wage tax because their tax base is below the lowest tax bracket. The fact that these individuals do not profit from the reform already suggests that the reform has distributional consequences. One should note that the increased negative tax is not included in our analysis, as this policy is considered a transfer. It might nevertheless positively influence the wage distribution.
In the next step, we decompose the distributional effects by using standard Theil decomposition. We analyze the distributional effects for several individual characteristics, such as tax status (being a tax wage payer or not), age, social status (blue-collar workers, white-collar workers etc.), as well as working hours (part-time or full-time employed).
Decomposing the Theil index into an effect between the taxpayers and the non-taxpayers and within these groups, Table 17 points out that the Theil index has increased from 0.3063 to 0.3122. While the decrease of the within-effect suggests that the tax reform reduced inequality within the two groups, the between-effect indicates increased inequality between the two groups.
Theil decomposition by tax status (taxpayer or not).
| Old system | New system | |
|---|---|---|
| Total | 0.3069 | 0.3105 |
| Within | 0.1398 | 0.1377 |
| Between | 0.1671 | 0.1728 |
This is not surprising since, in relative terms, low-income taxpayers profit less from the reform. Moreover, the increase in inequality of net wage incomes is also due to the fact that non-taxpayers did not profit from the tax reform directly.
Repeating the Theil decomposition for different social groups, Table 18 (a) indicates, that not only the inequality between, but also within these groups is increasing. However, the effect between the groups is low indicating that there was no special treatment of any of the social groups.
Theil decomposition by social status, working time, age groups and gender.
| (a) by social status | (b) by working time | |||
|---|---|---|---|---|
| Old system | New system | Old system | New system | |
| Total | 0.3069 | 0.3105 | 0.3069 | 0.3105 |
| Within | 0.2521 | 0.2551 | 0.2526 | 0.2548 |
| Between | 0.0547 | 0.0554 | 0.0543 | 0.0557 |
| (c) by age groups | (d) by gender | |||
| Old system | New system | Old system | New system | |
| Total | 0.3069 | 0.3105 | 0.3069 | 0.3105 |
| Within | 0.2718 | 0.2752 | 0.2872 | 0.2903 |
| Between | 0.0351 | 0.0353 | 0.0197 | 0.0202 |
The same holds true for part-time and full-time workers (Table 18 b). There is only a slight increase in the effect between the groups, which is mainly due to the fact that part-time workers are more often not paying any wage taxes and are therefore not profiting from the tax reform. The effect is small because simultaneously high-wage part-time workers are those that profit the most from the tax reform in absolute terms (see also Figure 2).
Analysis of the age groups suggests (Table 18 c) that there is almost no inequality between the age groups and that the impact of the tax reform on the between effect is negligible. We conclude that there is no change in the distributions between the age groups, whilst inequality within age groups is rising.
Comparing the results by gender (Table 18 d), we observe almost no change in the distribution between males and females. The increase in overall inequality results from changes within the distributions.
5. Policy options
As we concluded in the previous section, the main reason for the increase in inequality of net wage incomes resulting from the tax reform, is that low-wage-income earners did not directly profit from the changes to the tax scheme. As the Theil decomposition has shown, inequality within the group of taxpayers has decreased, while the overall increase in inequality stems only from the inequality between the groups of taxpayers and non-taxpayers.
To overcome this problem, the Austrian government has increased one of the transfers to low-wage earners – the negative income tax. The idea was to reduce the high burden of social security contributions for low-wage earners. Prior to the reform, the negative income tax was at maximum EUR 110 for all employees. In 2015, it was increased to EUR 220 and in 2016 further to EUR 400. Additionally, for pensioners, a negative income tax was introduced in 2015 at maximum of EUR 55 and further increased to EUR 110 in 2016. The negative income tax is limited at a maximum of 50% of the social security contributions.
Even though the negative income tax might increase the incentive to work in general, it decreases the incentive to work for low-wage-income earners. The marginal benefit of working an additional hour is reduced since an additional Euro earned will lead to a lower increase in the net income than before the tax reform. In this section we discuss the fiscal effects of this policy and also whether the policy has reached the goal of compensating the effects on the net wage income distribution. Additionally, we analyze alternative policy options that can help compensate for the distributional effects.
It is often argued that social security contributions are the largest burden for low-wage income earners in Austria, as they belong to one of the highest in Europe15. A reduction in social security contributions might reduce wage-income inequality as it reduces the total tax burden especially for low-income groups. For high-income groups, the positive effect of lower social security contributions is reduced by the effect ofhigher taxes, resulting from the higher tax base.
For simplicity, we consider two specific reductions to social security contributions (SSC):
SSC1: A reduction of social security contributions by 1 percentage point
SSC2: A reduction of social security contributions for low-and middle-income groups by 1 percentage point (gross incomes below EUR 50,000 per year).
5.1 Costs
We analyze the fiscal effects of the three policies: the actual change to the negative income tax and the two scenarios described above. The fiscal effect of the negative income tax is unclear, as it depends on the actual tax declaration. In fact, both the fiscal costs and the effect of the negative income tax on individual income take place only in 2017. However, for simplicity, we assume that the negative income tax is collected by every “eligible” person already in 2016 and is therefore added to the individual net wage income.
According to our model, the increase in the negative income tax will result in an increase in total expenditure of 370 million EUR. This effect can be separated to a transfer of EUR 90 million to pensioners with low income, and approximately EUR 280 million to low-income earners.
Costs of the policy proposals.
| Old system | New system | Proposals | ||
|---|---|---|---|---|
| SSC1 | SSC2 | |||
| (MEUR) | ||||
| Wage tax revenue | 23,451 | 24,006 | 23,830 | |
| SSC revenue | 24,039 | 22,389 | 22,883 | |
| Additional wage tax revenue | 556 | 379 | ||
| Loss in SSC | −1,649 | −1,155 | ||
| Total costs | −370 | −1,094 | −776 | |
A reduction of social security contributions for all individuals will lead to an increase in wage tax revenues of EUR 556 million but this will be offset by a loss of social security contributions of EUR 1,649 million. In total, the additional costs for the government would equal EUR 1,094 million.
A reduction in the security contributions for gross-wage incomes below EUR 50,000 will lead to an overall cost of EUR 776 million, which is almost double what is needed for the increase in the negative income tax. Tax revenues would increase by EUR 379 million, while social security contributions would decrease by EUR 1,115 million.
5.2 Distributional effects
The distributional effects of the reform on the net wage income have already been discussed in the previous section. This section will focus on the distributional effects of transfers, such as the negative income tax, and the two other policy tools, which would reduce the tax burden of low-income workers.
From a theoretical point of view, a negative income tax in Austria is more effective for increasing net income for low-wage earners, since it is a direct transfer and it is independent of income (up to a certain level). Therefore, it is a redistributional instrument to support low-wage-income earners. However, a decrease in social security contributions for low-wage-income earners or for the general population should also lead to a more equal distribution of wage incomes.
Table 20 shows the effects of the mentioned policy tools on income deciles and compares it to the pre-reform values. The increase of the negative income tax to 400 EUR leads to an significant increase in disposable income especially in the second and third decile. The second decile will be the decile with the highest relative increase in income (4.92%). On the other hand, the social security reductions (SSCi and SSC2) increase the disposable income in the second and third decile on a lower level but additionally, the disposable income of higher deciles will be decreased as well.
Impact of policy options on wage income deciles.
| Old system | New system 400 EUR NIT | Proposals | |||||
|---|---|---|---|---|---|---|---|
| SSC1 | SSC2 | ||||||
| (EUR) | |||||||
| 1st decile | 780 | +16 | (2.07%) | +7 | (0.92%) | +8 | (0.97%) |
| 2nd decile | 3,980 | +196 | (4.92%) | +51 | (1.28%) | +52 | (1.32%) |
| 3rd dec1le | 8,771 | +243 | (2.78%) | +122 | (1.40%) | +126 | (1.43%) |
| 4th dec1le | 12,715 | +164 | (1.29%) | +162 | (1.27%) | +167 | (1.31%) |
| 5th dec1le | 16,081 | +391 | (2.43%) | +529 | (3.29%) | +535 | (3.33%) |
| 6th dec1le | 19,177 | +765 | (3.99%) | +925 | (4.82%) | +932 | (4.86%) |
| 7th dec1le | 22,303 | +882 | (3.95%) | +1,066 | (4.78%) | +1,075 | (4.82%) |
| 8th dec1le | 25,841 | +1,061 | (4.11%) | +1,287 | (4.98%) | +1,297 | (5.02%) |
| 9th dec1le | 30,954 | +1,383 | (4.47%) | +1,647 | (5.32%) | +1,590 | (5.14%) |
| 10th dec1le | 51,400 | +1,668 | (3.24%) | +2,075 | (4.04%) | +1,672 | (3.25%) |
Our calculations in Table 21 show that the Gini coefficient decreases irrespective of the policy option, and that negative income tax leads to the strongest decline in wage-income inequality. However, reduction of social security contributions for gross incomes below EUR 50,000 also decreases inequality as measured by the Gini coefficient. As the Gini coefficient reacts especially strongly to changes in the middle part of the distribution, we compare the effects on another measure of inequality, the Theil index. The results do not change. All three policy alternatives decrease the net-income inequality, and again the increase in the negative income tax has the highest impact.
Inequalitymeasures and Theil decomposition of policy options.
| New system 110 EUR NIT | New System 400 EUR NIT | Proposals | ||
|---|---|---|---|---|
| SSC1 | SSC2 | |||
| Gini coefficient | 0.405 | 0.406 | 0.408 | 0.407 |
| Theil Total | 0.305 | 0.306 | 0.308 | 0.307 |
| Theil Within | 0.140 | 0.137 | 0.137 | 0.136 |
| Theil Between | 0.166 | 0.168 | 0.171 | 0.171 |
The decrease in the Theil index follows almost entirely from a decrease in the inequality between non taxpayers and taxpayers in the case of an increase in the negative income tax. If the reduction of social security contributions (SSC1 and SSC2) is chosen as a policy tool to reduce inequality, we observe not only a decrease in inequality between the two groups, but also within the groups.
5.3 Effects on work incentives
Work incentives can be split into incentives to start working (extensive margin) and incentives to increase working hours (intensive margin). The distinction between the extensive and intensive margins has long been recognized by the literature on the labor supply16. The labor supply responses at the intensive and extensive margin are crucial for the tax design of any income-tax system17. Participation tax rates, AETR, as well as METR for low incomes remain high in many current tax systems18, indicating that there is room for policies that aim to increase incentives on both the extensive and the intensive margin.
There are to the best of our knowledge two studies regarding work incentives of the 2016 tax reform in Austria. First, the IHS (2015) argues that the work incentives increased due to a significant decrease in the tax burden for all income groups (for low-income earners due to the negative income tax). Whereas, the GAW (2015) follows Saez, Slemrod, and Giertz (2012) and argues, that not only the average tax rate, but also the marginal and the transfer tax rate are decisive for labor supply decisions. They show that the effect of negative income tax for low-income earners will not increase work incentives because disposable income will not increase due to a loss in transfers. They argue that the total effects on both the intensive and the extensive margins will be small. They estimate an increase of employment of 10.000 full-time equivalents.
In general, work incentives depend on the marginal tax burden, which not only includes the marginal tax rate, but also the additional social security contributions as well as the transfer withdrawal rate. In our analysis, we do not consider the potential decrease in the transfer withdrawal rate. We also exclude marginally employed from our calculations of the average and marginal effective tax rates, since it is not clear, whether they pay social security contributions. The employer of a marginally-employed individual pays accident insurance, but pension and health insurance contributions are the individual choice of the employee. Both, the AETR as well as the METR, would equal zero according to our model, since we do not know whether the employee pays social security contributions or not.
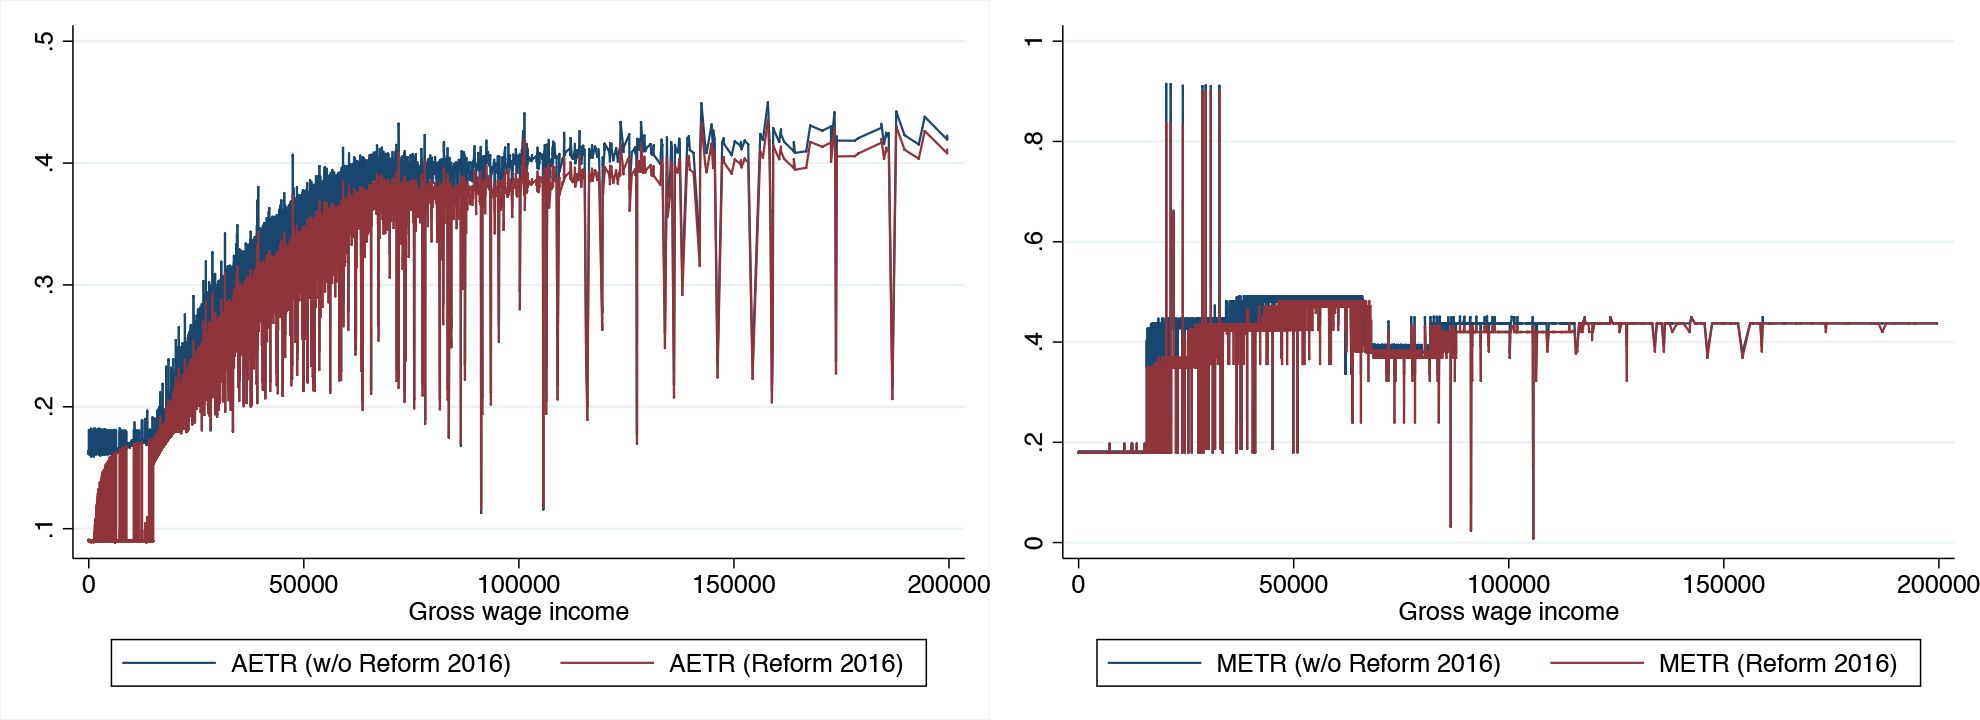
From an incentive point of view, the 2016 tax reform decreased the AETR for a given gross income level not only above the tax-free amount, but also below due to changes in the negative income tax, as indicated in Figure 4. This implies that the incentives on the extensive margin increased, since more people would be willing to work because of the increased net income as a result of the changes in the tax rates and the tax brackets, but also because of the increased negative income tax. In particular, the incentive to work for women, which on average have lower gross-wage incomes, was increased by the reform19.

2016 tax reform – Incentives on the extensive margin (AETR) and intensive margin (METR).
However, the tax reform will also increase the incentives on the intensive margin since the METR was decreased, especially above the tax-free amount. Therefore, taxpayers will have a higher incentive to work more hours. Both effects will, however, be reduced by the fact that an increase in net income reduces social benefits for lower-income groups. The effects for the lowest-income earners are not influenced by the changes in the tax rates and the tax brackets, but mainly by the increase of the negative income tax. However, we can already see that the METR does not change for low-income earners, indicating that the incentive to increase working hours did not change. Next, we take a closer look at the alternative policy options discussed above.
5.3.1 Effects for low-wage earners
One has to keep in mind that the increase in the negative income tax increases the work incentives on the extensive and the intensive margins only indirectly, as the negative income tax is paid out on request only one year later. One advantage of a decrease in social security contributions is that the effect on net wage income would be immediate.
For low-wage income earners with no additional social transfers, the incentive to start working would be increased, no matter which policy tool we choose. Still, if other transfers, such as the unemployment benefits and the means-tested minimum income (German: “bedarfsorientierte Mindestsicherung”), are decreased due to higher-wage income, the incentives effect can be negligible, as argued by the GAW (2015).
Figure 4 shows that the average effective tax rate decreases due to the 2016 reform for low-wage earners. This indicates that the incentive on the extensive margin increases if other social benefits do not decrease due to the higher net income. By contrast, the effect on the intensive margin, measured as the METR, remains unchanged by the increase in negative income tax. The METR stays almost the same for incomes below the tax-free amount indicating that an additional Euro earned is taxed at almost the same rate as under the old system. Therefore, there is no additional incentive to increase the hours worked for low-income groups. Since the number ofpart-time workers is already quite high in Austria, this is something policy-makers should be aware of.
By contrast, a reduction in social security contributions effects the incentives on both the extensive and the intensive margins. Figure 5 shows the average and marginal effective tax rates under the new system (with an increase in the negative tax rate) and under a system where the social security contributions have been lowered instead (SSC2). The AETR indicated that starting to work in general gets less attractive for low-wage income earners. But the incentives on the extensive margin for low-wage income earners would significantly increase (under the assumption that other social benefits are not reduced due to the higher net wage income) as the lower METR indicates. While the negative income tax gives no additional incentive to low-income earners to increase their working hours, the reduction in social security contributions does.
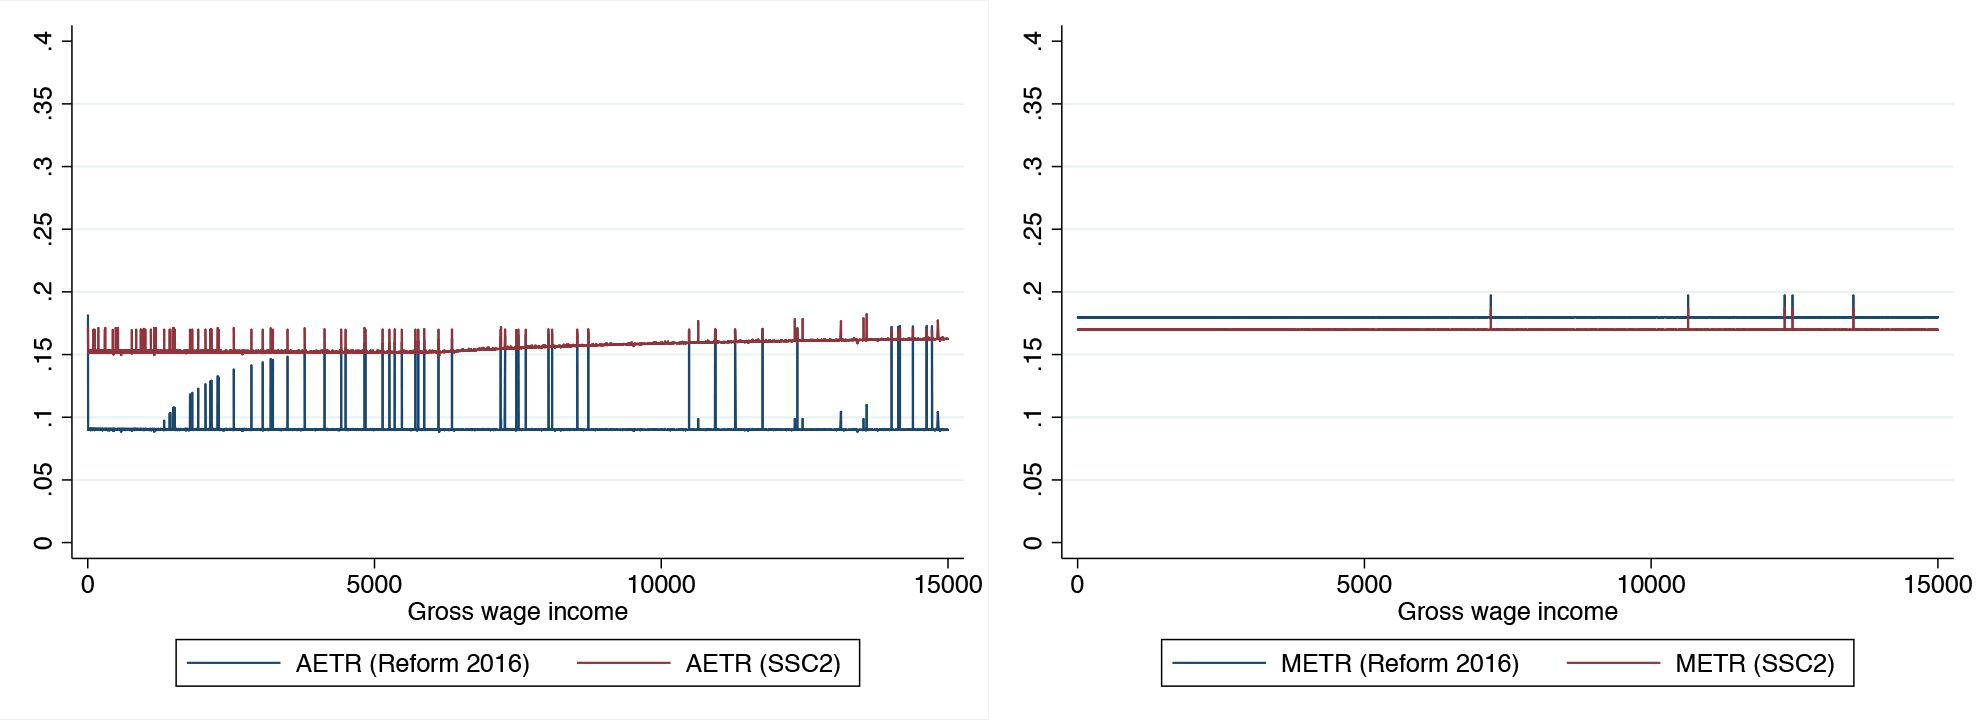

Policy options – Incentives for low wage incomes on the extensive (AETR) and intensive margin (METR).
5.3.2 Effects for middle-wage earners
The increase in the negative income tax influences only low-wage incomes. By contrast, the discussed decrease in social security contributions would influence the work incentives of middle-wage income earners not only on the extensive but also on the intensive margin.
Figure 6 compares AETR and METR for both policy options, the increase of the negative income tax, as well as the alternative increase in social security contributions (SSC2). We can see that a reduction in social security contributions leads not only to a lower AETR but also to a lower METR for middle-wage earners indicating both a increase in incentive on the extensive and intensive margins for the gross-income groups between EUR 20,000 and EUR 50,000.
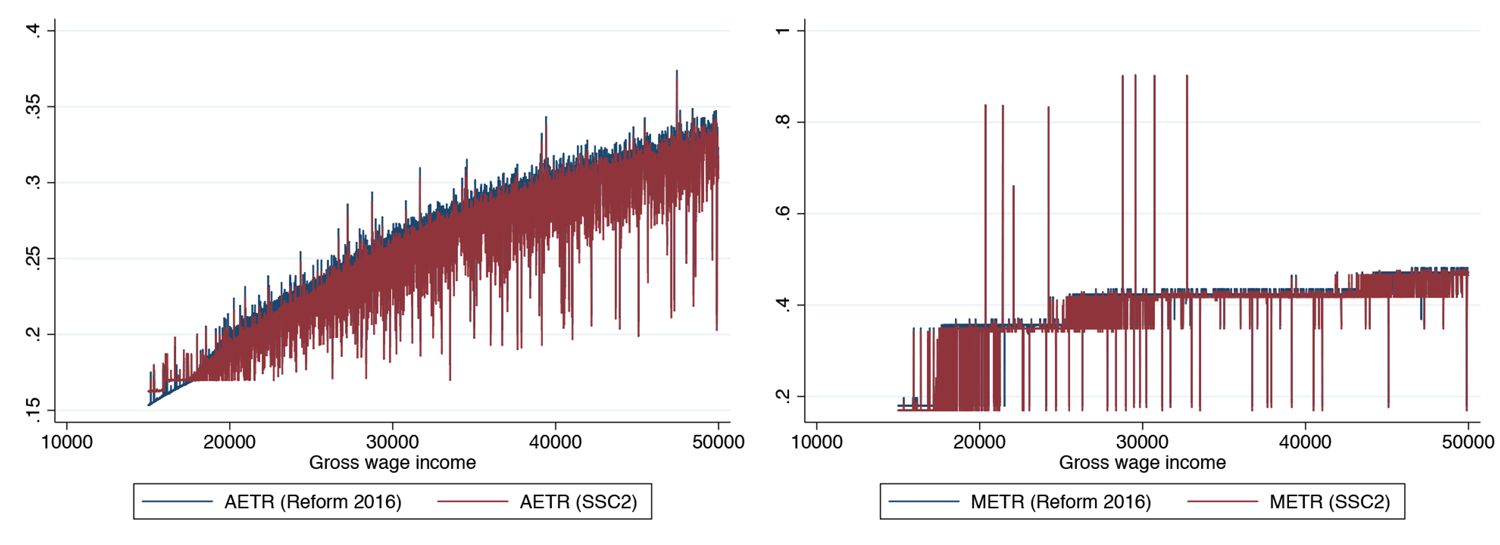
Policy options – Incentives for middle wage incomes on the extensive (AETR) and intensive margin (METR).
The decrease in social security contributions for incomes up to EUR 50,000 (SSC2) would lead to higher incentives to work more hours, as an additional Euro earned is taxed less than before. Reducing the social security contributions for all taxpayers (SSCi) would lead to additional incentives for higherwage income earners on the extensive as well as the intensive margin.
Any change in the tax system affects work incentives and therefore the labor supply. The 2016 tax reform itself increased not only the incentives on the extensive but also on the intensive margin for the taxpayers. In addition, the increase in the negative income tax has introduced an incentive on the extensive margin for low-wage workers who are often employed part-time, in marginal employment or as interns. But for this group ofworkers, the incentives on the extensive margin did not change.
In almost all sectors in the Austrian economy, collectively-bargained minimum wages for full-time jobs are above EUR 21,000. The “middle-wage income jobs” are in fact mostly low-paid full-time jobs. If the goal of the policy-makers is to increase the net incomes and the incentives to work for people that work full-time, there is no doubt that a decrease in the social security contributions is more effective than an increase in the negative income tax.
Additionally, the increase in the negative income tax makes part-time work and marginal employment more attractive compared with a decrease in social security contributions and leads to lower incentives to increase working hours. If the goal of the policy-makers is to raise the incentives to increase working hours for people that work part-time, a decrease in social security contributions would be more efficient as well.
6. Concluding remarks
The goal of2016 tax reform in Austria was to increase net wage incomes for low-and middle-income groups. When we focus on individual net wage income distribution, we conclude that this goal was only partially met. On average, the net income of the Austrian taxpayer has increased on average by about EUR 620, which is an increase in net income of 3.23%. Looking at specific socio-economic factors, we find that, on average, the net wage income of male workers has increased by about EUR 836, while for women it has increased by about EUR 416. In absolute, as well as relative terms, men profited more than women. Additionally, employees (EUR 689) profited more than pensioners (EUR 490) and male employees (EUR 848) more than female employees (EUR 510), in both absolute and relative terms.
Taking a closer look at occupational categories, civil servants as well as civil-servant pensioners profited on average the most in absolute terms. Both groups experienced net income gains of more than EUR 1,200. In relative terms, both groups also profited more than others groups (by almost 4%); however, apprentices profited the most (5.12%) due to some specific changes that only affected them.
Looking at the distributional effects of the tax reform, we can see that the changes in the tax system increased inequality. The Gini index increased from 0.406 to 0.410 and the Theil index increased from 0.307 to 0.311, both indicating a significant increase in inequality. Our analysis shows that this increase stems mainly from the fact that income inequality between the wage taxpayers and non-taxpayers increased, while inequality within these two groups reduced. The reform decreased the tax burden, but many wage-income earners in Austria are not paying any wage taxes due to their low incomes. Taking a closer look at the deciles of the net wage incomes, we can see that in relative terms, the 9th decile, which are net wage incomes of around EUR 30,000, profit the most from the tax reform. On average, the net income in this group increased by 4.47% or EUR 1,383. The lowest 4 deciles did not significantly profit from the tax reform.
To decrease the tax burden of low-wage income groups, the Austrian government decided to increase the negative income tax. We analyze this policy tool, as well as the alternative scenario i.e. a decrease in social security contributions for gross incomes below EUR 50,000. Our analysis shows that both policies would reduce income inequality, however not to the pre-reform level. The increase in the negative income tax leads to a Theil index of 0.306, while the decrease in social security contributions by one percentage point for gross incomes below EUR 50,000 leads to a Theil index of 0.307, compared with the pre-reform level of 0.305.
While both policies lead to higher-wage incomes for lower-wage income earners, our analysis shows that the two policies influence work incentives differently. While the tax reform has increased work incentives on both the extensive and the intensive margins for taxpayers, the negative income tax only had an impact on the intensive margin of low-income earners. The low-income earners are more often part-time workers and the reform therefore provides a higher incentive to work part-time and no additional incentive to increase working hours. If the goal of the policy-makers is to increase the net incomes and incentives to work for people that work full-time, there is no doubt that a decrease in the social security contributions is more effective than an increase in the negative income tax, which makes part-time work and marginal employment more attractive.
Footnotes
1.
see e.g. Steiner and Wakolbinger (2015) or Christl and Kucsera (2015).
2.
3.
Due to the lack of data, we are forced to neglect some tax allowances and tax credits such as childcare-, single earners and some family-specific tax reliefs.
4.
According to Statistik Austria (2016), 86 percent of the household income information of EU-SILC stems from administrative data. Still, the number ofobservation is much lower than while using administrative data.
5.
see e.g. Sutherland and Figari (2013).
6.
Under specific circumstances the tax credit for pensioners can be increased to EUR 764 depending on e.g. marital status, income of the partner and the claim for the “Alleinverdienerabsetzbetrag”. This effect is neglected in our calculations.
7.
See e.g. Atkinson and Sutherland (1988).
8.
According to Statistik Austria (2016), 86 percent of the household income information stems from administrative data. Still, the number of observation is lower than in administrative data.
9.
Because of data availability, it is not possible to distinguish between the different lump-sum allowances (e.g. commuter, child care, single-earner and other family-specific allowances) in our model as the wage tax statistics 2014 contain only the overall sum of the non-job related allowances.
10.
“Inflation rate was 0.9 percent in 2015 and in 2016, a value of 1.7 percent is forecasted.
11.
“See e.g. Fuchs and Gasior (2015). The sample size in 2015 was around 10000 observations.
12.
We cannot control for the 2016 reform of the tax allowance for childcare.
13.
For additional factors see e.g. Böheim, Himpele, Mahringer, and Zulehner (2013).
14.
As already mentioned, the negative income tax will increase the income of this income groups, but this is considered a social transfer in our analysis.
15.
For a comparison of social security contributions across Europe see OECD (2016)
16.
See, e.g., Heckman (1993) or Blundell, Bozio, and Laroque (2013).
17.
See, e.g., Diamond (1980), Saez (2000) or Laroque (2005).
18.
19.
See also Schratzenstaller (2015).
Appendix
Social security contributions.
| HI | PI | UI | add. taxes | Total | |
|---|---|---|---|---|---|
| 2015 | |||||
| other individuals | 3.82% | 10.25% | 3.00% | 1.00% | 18.07% |
| apprentices | 3.95% | 10.25% | 3.00% | - | 17.20% |
| blue-collar workers | 3.95% | 10.25% | 3.00% | 1.00% | 18.20% |
| white-collar workers | 3.82% | 10.25% | 3.00% | 1.00% | 18.07% |
| civil servant | 4.10% | 11.80% | 3.00% | 1.00% | 19.90% |
| public contract staff | 3.82% | 10.25% | 3.00% | 1.00% | 18.07% |
| civil servant pensioner | 5.10% | 10.25% | - | - | 15.35% |
| pensioner | 4.90% | 10.25% | - | - | 15.15% |
| individual with care allowance | 4.90% | 10.25% | - | - | 15.15% |
| 2016 | |||||
| other individuals | 3.87% | 10.25% | 3.00% | 1.00% | 18.12% |
| apprentices | 1.67% | 10.25% | 1.20% | - | 13.12% |
| blue-collar workers | 3.87% | 10.25% | 3.00% | 1.00% | 18.12% |
| white-collar workers | 3.87% | 10.25% | 3.00% | 1.00% | 18.12% |
| civil servant | 4.10% | 11.75% | 3.00% | 1.00% | 19.85% |
| public contract saff | 3.87% | 10.25% | 3.00% | 1.00% | 18.12% |
| civil servant pensioner | 5.10% | 10.25% | - | - | 15.35% |
| pensioner | 5.10% | 10.25% | - | - | 15.35% |
| individual with care allowance | 5.10% | 10.25% | - | - | 15.35% |
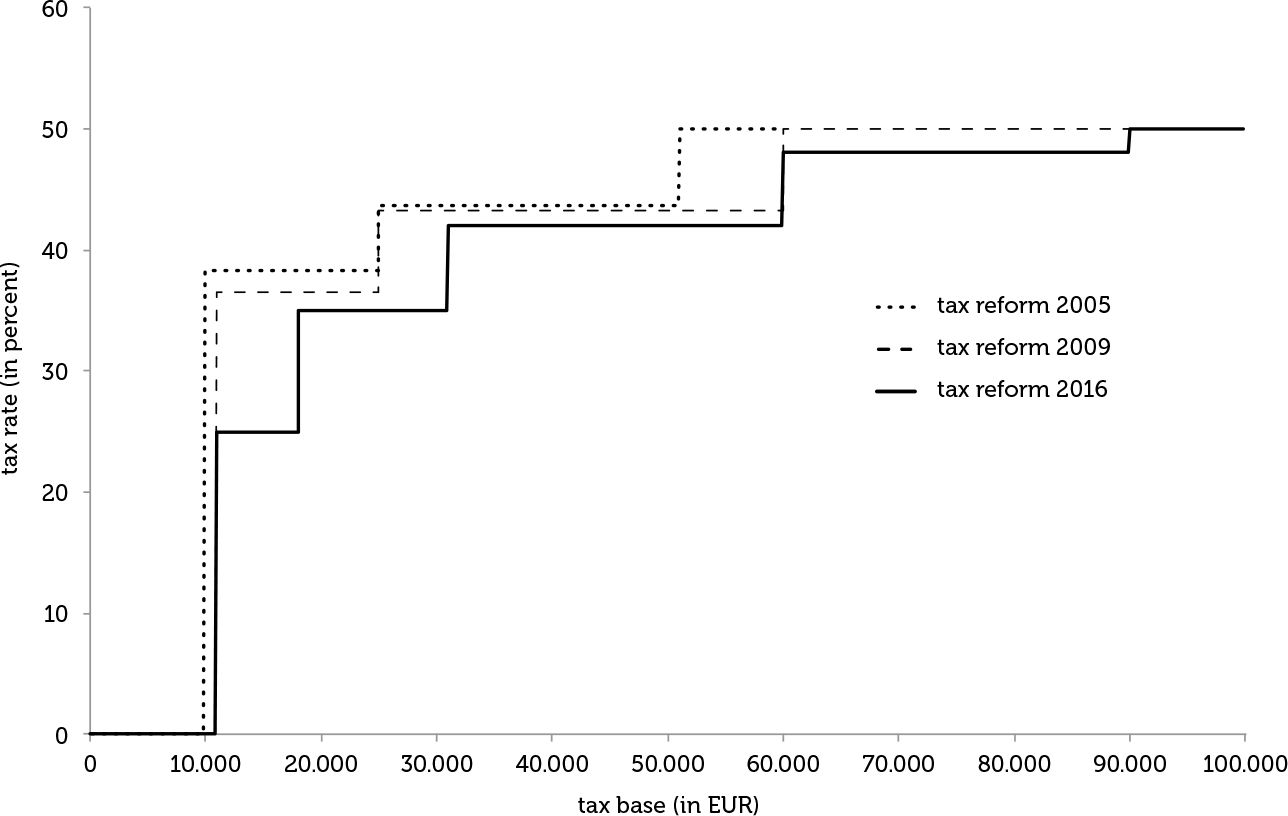

Tax rates in different tax reforms.
Independent 2-group Mann-Whitney U Test.
| W | p-value |
|---|---|
| 2,152,840,096 | 0.4286 |
-
Note: Alternative hypothesis – true location shift is not equal to 0.
References
-
1
Tax-benefit modelsTax-benefit models, London School of Economics; Suntory Toyota International Centre for Economics and Related Disciplines.
-
2
Steuerreformgesetz 2015/2016 (StRefG 2015/2016) (Tech. Rep.). Author.Steuerreformgesetz 2015/2016 (StRefG 2015/2016) (Tech. Rep.). Author..
-
3
Extensive and intensive margins of labour supply: Work and working hours in the US, the UK and FranceFiscal Studies 34:1–29.
-
4
The distribution of the gender wage gap in Austria: evidence from matched employer-employee data and tax recordsJournal for Labour Market Research 46:19–34.
-
5
The tax reform 2004-05-measures and macroeconomic effectsAustrian Economic Quarterly 9:127–142.
-
6
Gesamtwirtschaftliche Auswirkungen der Konjunkturpakete 1 und 2 und der Steuerreform 2009WIFO-Österr. Inst. für Wirtschaftsforschung.
-
7
Means-testing and tax rates on earningsDimensions of Tax Design: The Mirrlees Review pp. 90–173.
- 8
-
9
The importance of choosing the data set for tax-benefit analysisInternational Journal of Microsimulation 6:86–121.
-
10
Will the tax reform of 2015-16 offset the cumulative effect of bracket creep?WIFOMonatsberichte (monthly reports) 88:447–453.
-
11
Dokumentation des IHS Steuer-Transfer Mikrosimulationsmodells ITABENA (Tech. Rep.). IHS.Dokumentation des IHS Steuer-Transfer Mikrosimulationsmodells ITABENA (Tech. Rep.). IHS..
- 12
-
13
Austria (AT) 2011-2015. EUROMOD Country reportAustria (AT) 2011-2015. EUROMOD Country report.
-
14
Wer bekommt ein Stück vom Kuchen?Kurzstudie European Centre for Social Welfare Policy and Research.
-
15
Steuerreform erhöht Arbeitsanreize kaumGesellschaft für angewandte Wirtschaftsforschung.
-
16
Problems of the German contribution to EU-SILC - a research perspective, comparing EU-SILC, microcensus and SOEPProblems of the German contribution to EU-SILC - a research perspective, comparing EU-SILC, microcensus and SOEP.
-
17
What has been learned about labor supply in the past twenty years?The American Economic Review 83:116–121.
- 18
-
19
Average and marginal effective tax rates facing workers in the EUImmervollH, Average and marginal effective tax rates facing workers in the EU.
-
20
Towards a multi-purpose framework for tax-benefit micro-simulation: lessons from EUROMODInternational Journal of Micro Simulation 2:43–54.
-
21
Tax-benefit systems, income distribution and work incentives in the European UnionInternational Journal of Microsimulation 6:27–62.
- 22
-
23
Cross-validating administrative and survey datasets through microsimulationInternational Journal of Microsimulations 4:54–71.
-
24
Comparability of EU-SILC survey and register data: The relationship among employment, earnings and povertyJournal of European Social Policy 21:37–54.
- 25
-
26
Die Methode der Mikrosimulation am Beispiel einer Abschaffung des Allein-verdienerabsetzbetragsUniversity of Vienna.
- 27
- 28
-
29
Optimal income transfer programs: intensive versus extensive labor supply responsesNational Bureau of Economic Research (NBER).
-
30
The elasticity of taxable income with respect to marginal tax rates: A critical reviewJournal of economic literature 50:3–50.
- 31
-
32
Steuerreform 2015/16 - Maßnahmen und GesamteinschätzungWIFO-Monatsberichte 88:371–385.
-
33
Tax reform of 2015-16 - measures and overall assessmentWIFO Monatsberichte (monthly reports) 88:371–385.
- 34
-
35
Standard-Dokumentation: Metainformationen zu EU-SILC 2015Standard-Dokumentation: Metainformationen zu EU-SILC 2015.
-
36
The Austrian Tax-Transfer Model ATTM-Version 1.0.The Austrian Tax-Transfer Model ATTM-Version 1.0..
-
37
Tax Reform 2015-16 and Bracket Creep 2010-2019: A Microsimulation Analysis for AustriaWIFO Monatsberichte (monthly reports) 88:425–430.
-
38
EUROMOD: the European Union tax-benefit microsimulation modelInternational Journal of Microsimulation 6:4–26.
Article and author information
Author details
Acknowledgements
We thankfully acknowledge the suggestions and advice of Gerhard Reitschuler and anonymous referees on the previous versions of this paper.
Publication history
- Version of Record published: August 31, 2017 (version 1)
Copyright
© 2017, Christl
This article is distributed under the terms of the Creative Commons Attribution License, which permits unrestricted use and redistribution provided that the original author and source are credited.