Cite as: D. Fredriksen, N. Stølen; 2017; Life time pension benefits relative to life time contributions; International Journal of Microsimulation; 10(2); 177–207. doi: 10.34196/ijm.00161
Abstract
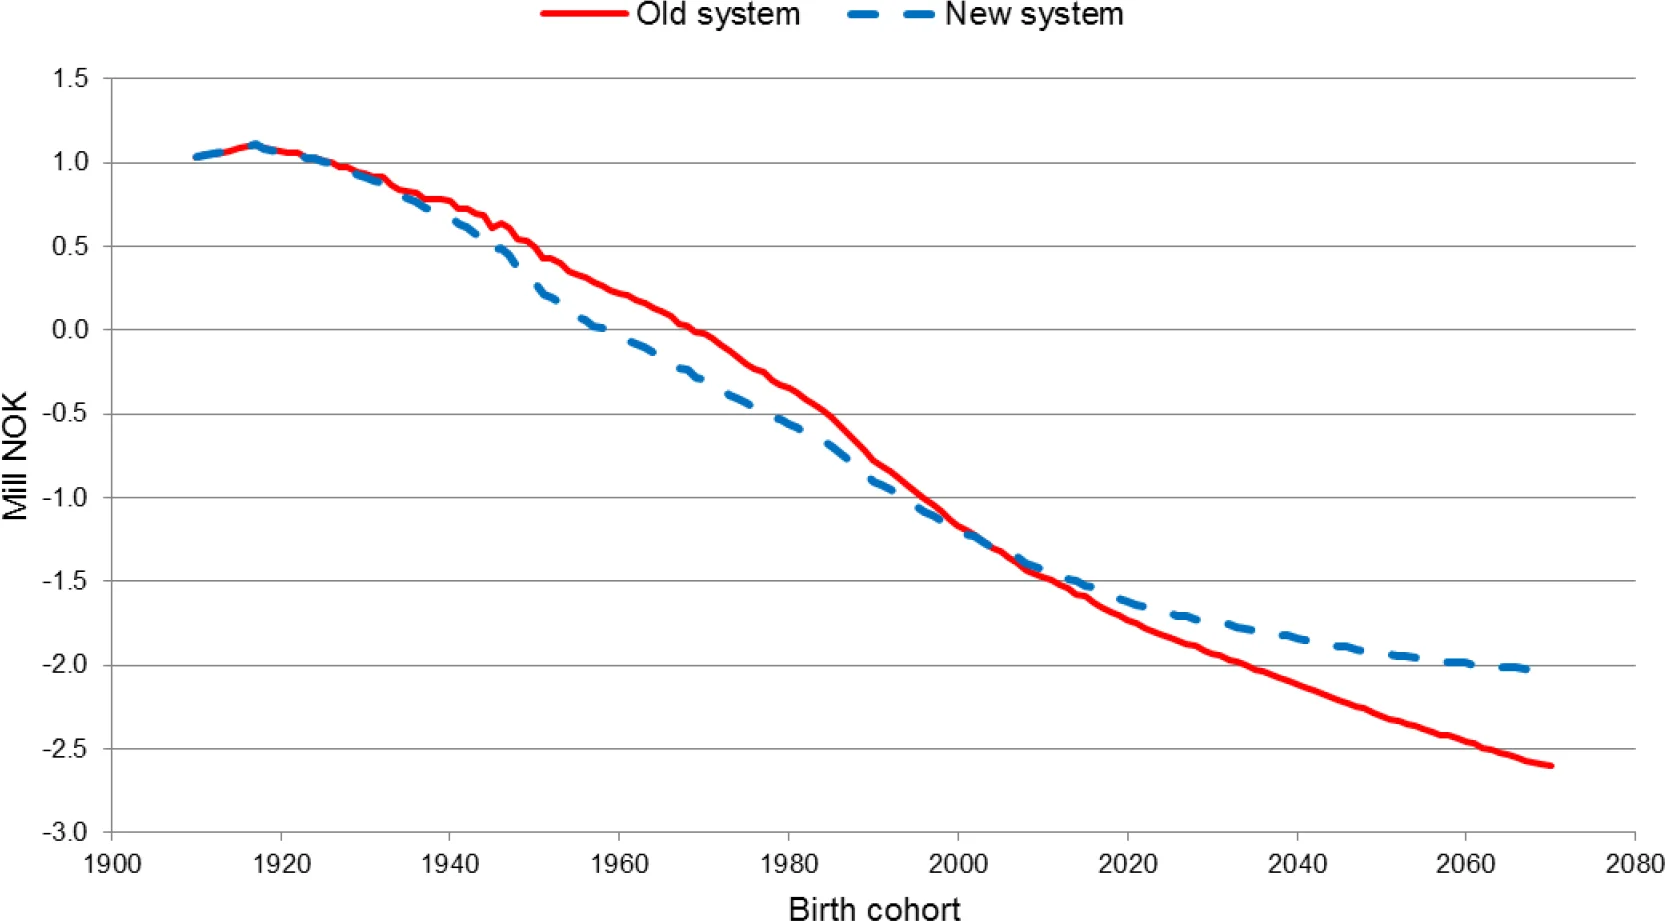
By extending a dynamic micro simulation model we compare total expected discounted contributions to the Norwegian National Insurance System with expected discounted sum of benefits from pensions received for cohorts born between 1910 and 2070. The results show that the cohorts, who established the pay-as-you-go system in 1967, experienced a substantial gain by letting future generations pay. As a result of the pension reform from 2011 future pension benefits will be tightened. With a positive net rate of interest cohorts born between 1950 and 1980 are those who are most hurt by the reform, while cohorts born after 2000 gain.
This article contains 10 figures.
Figures
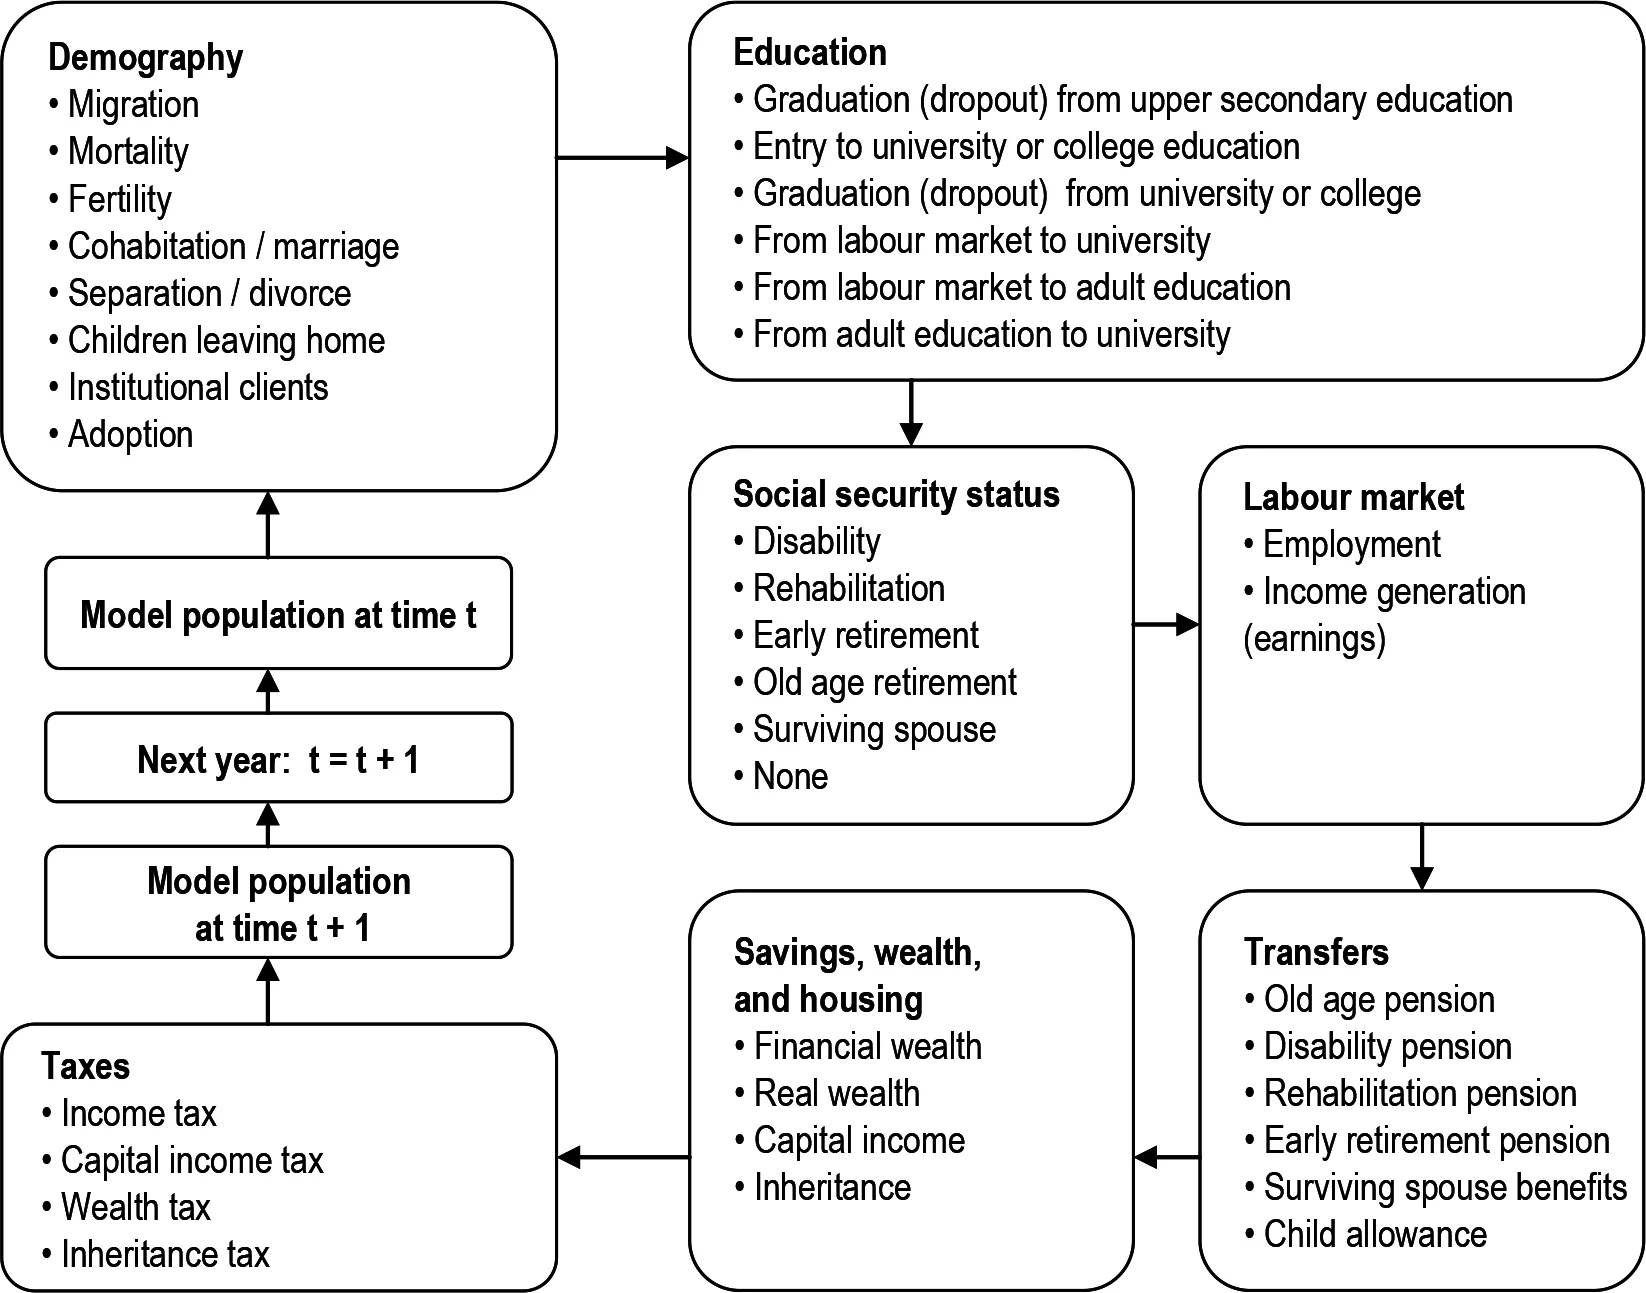
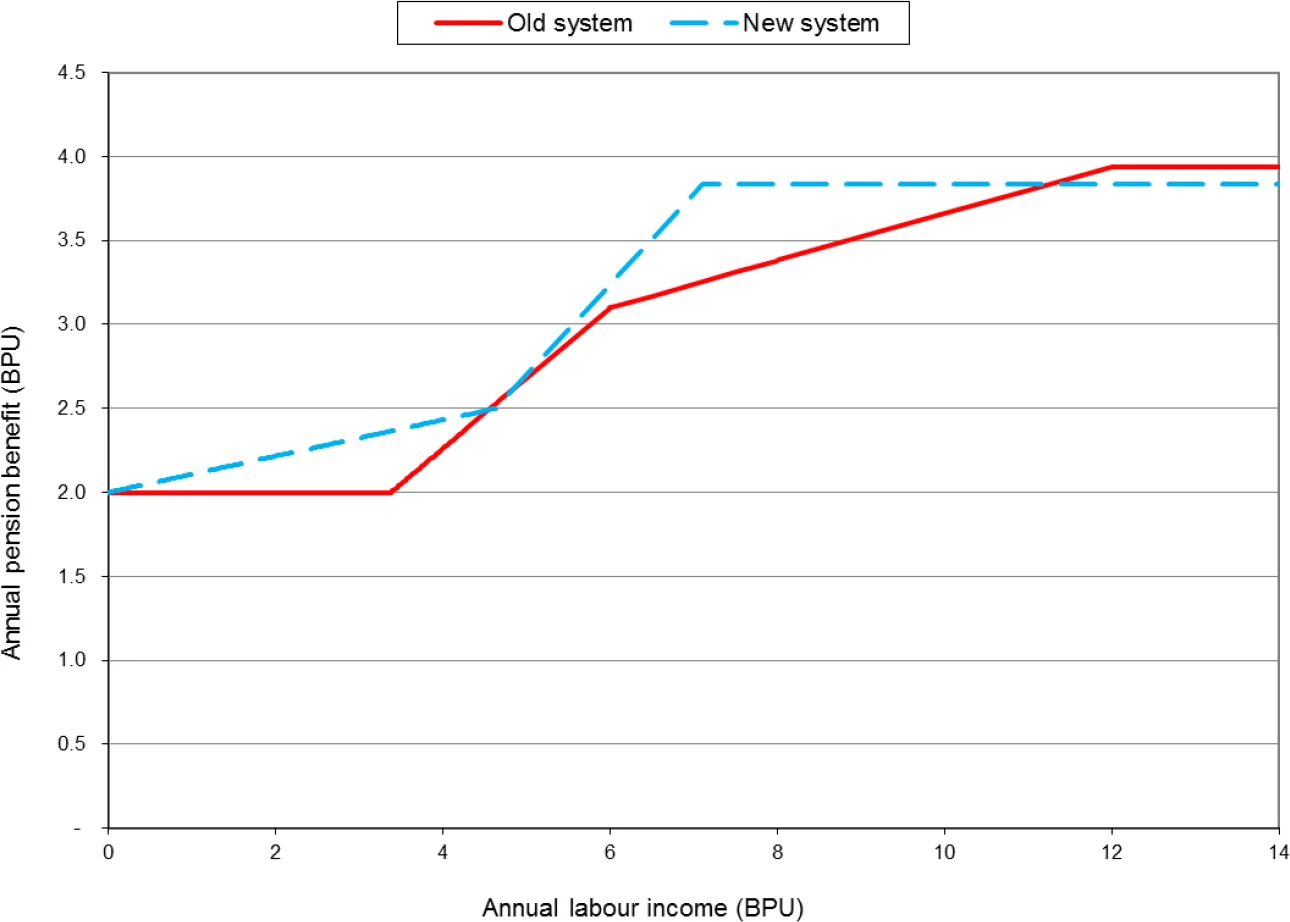
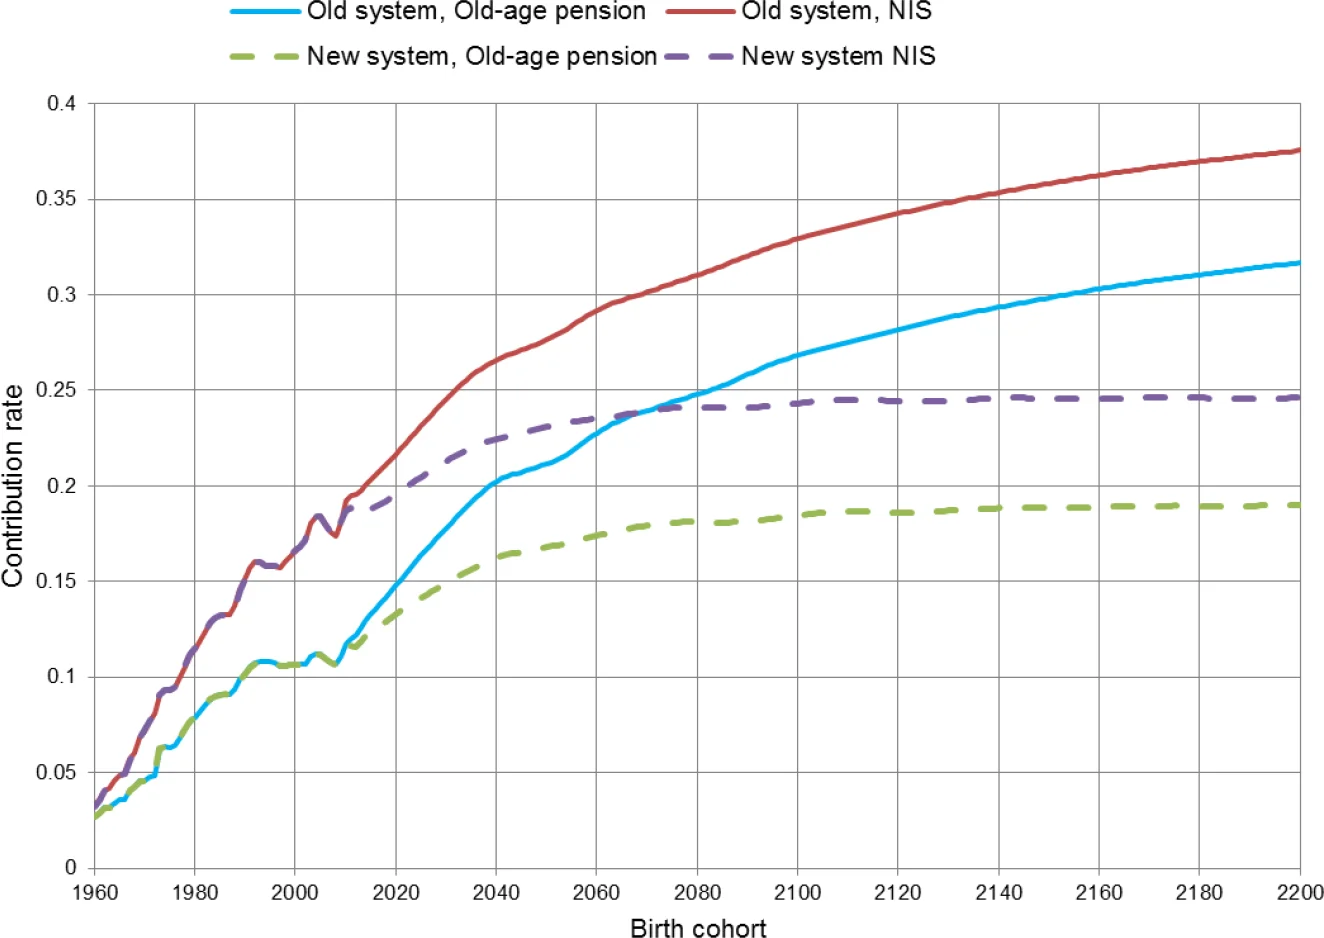
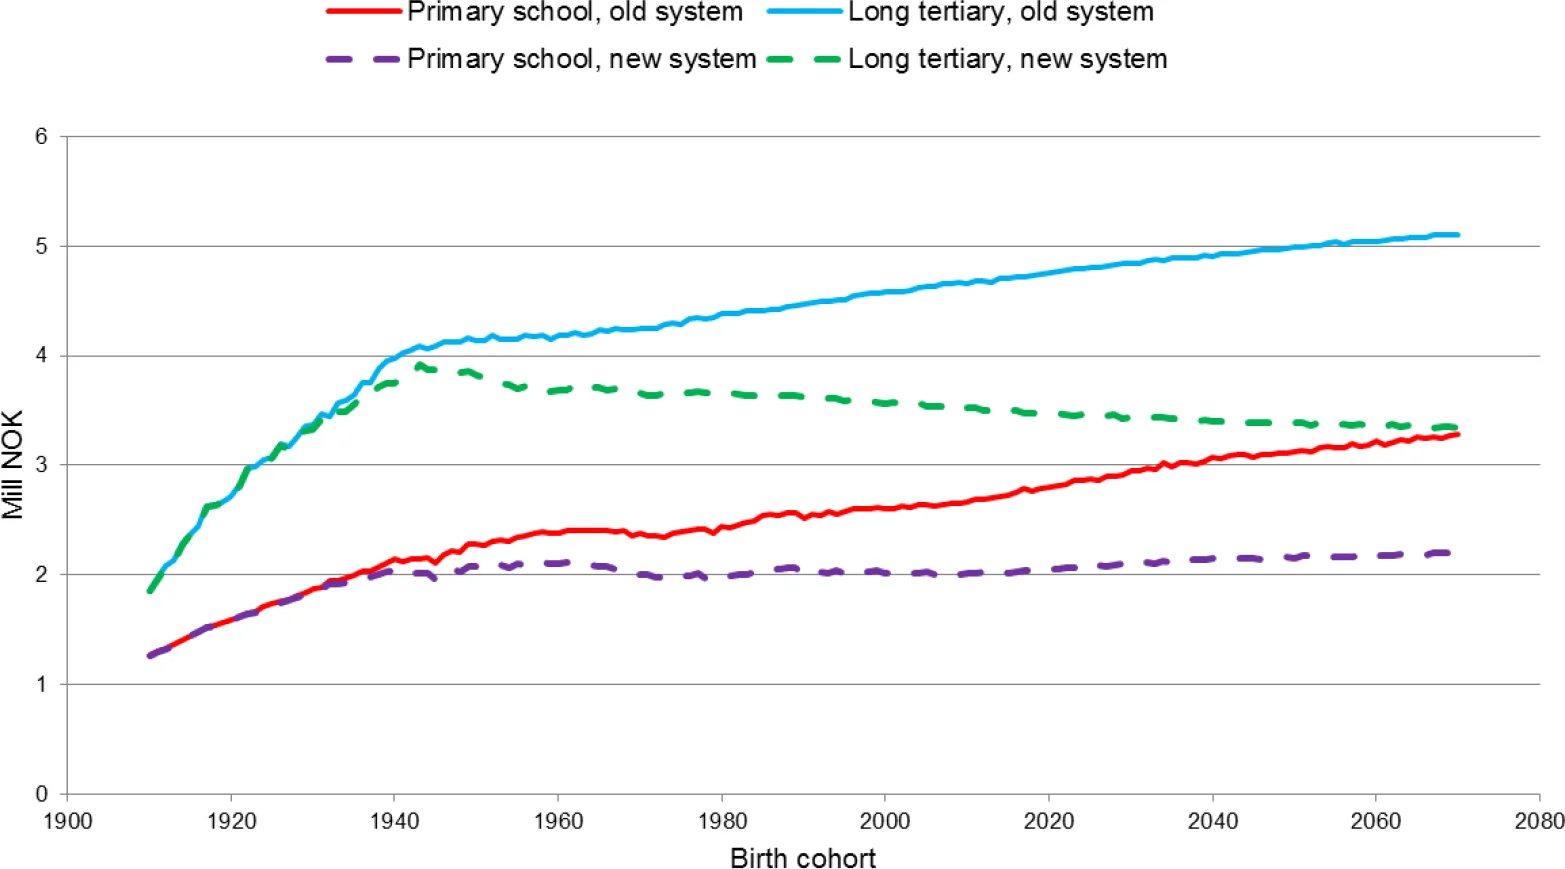
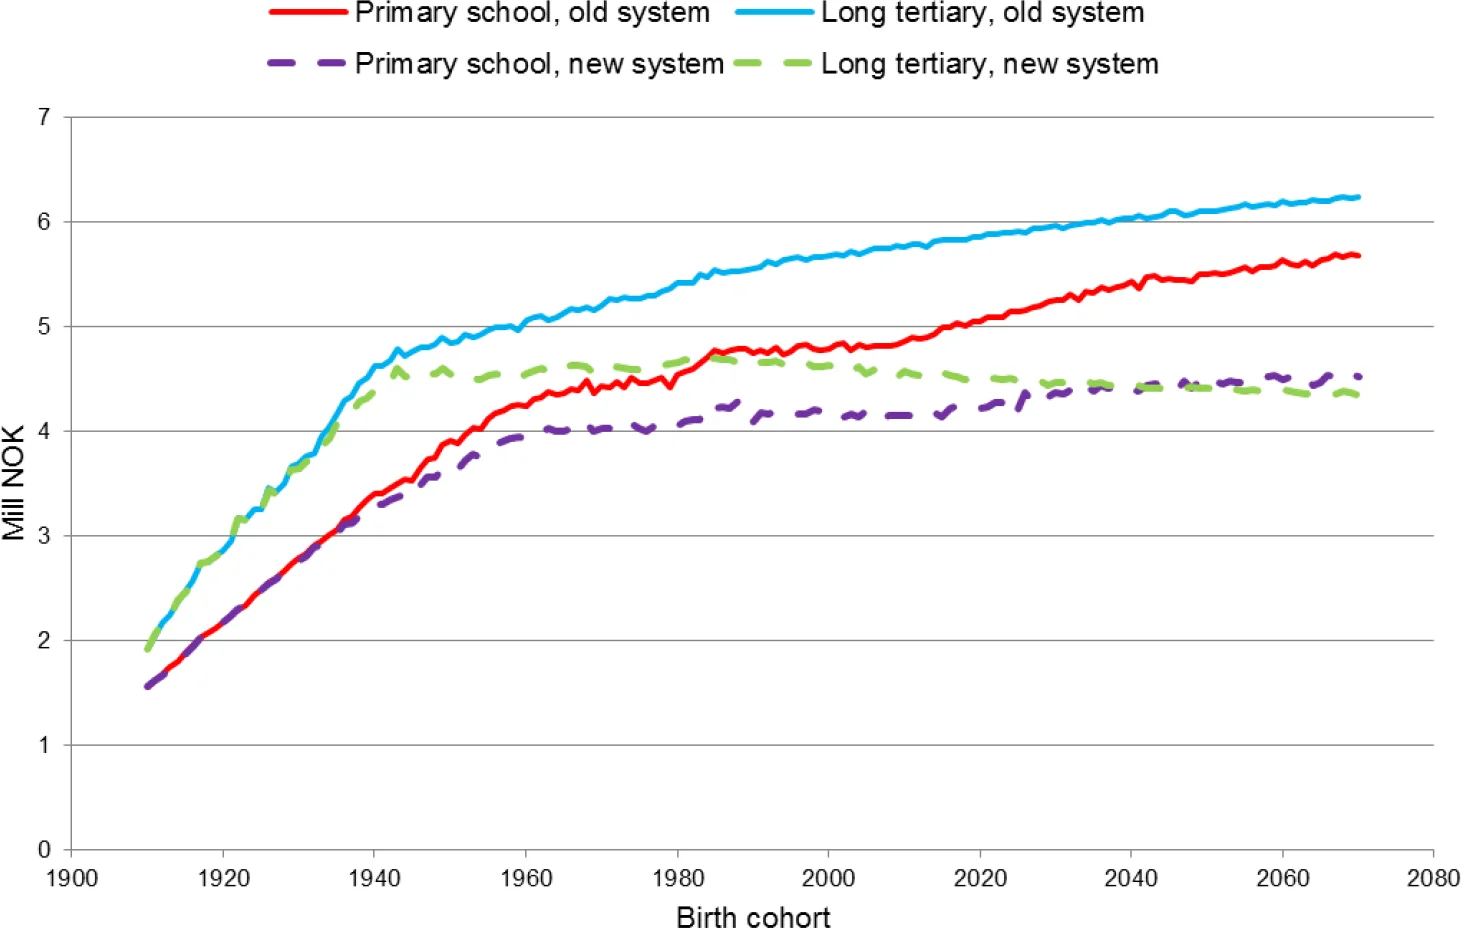
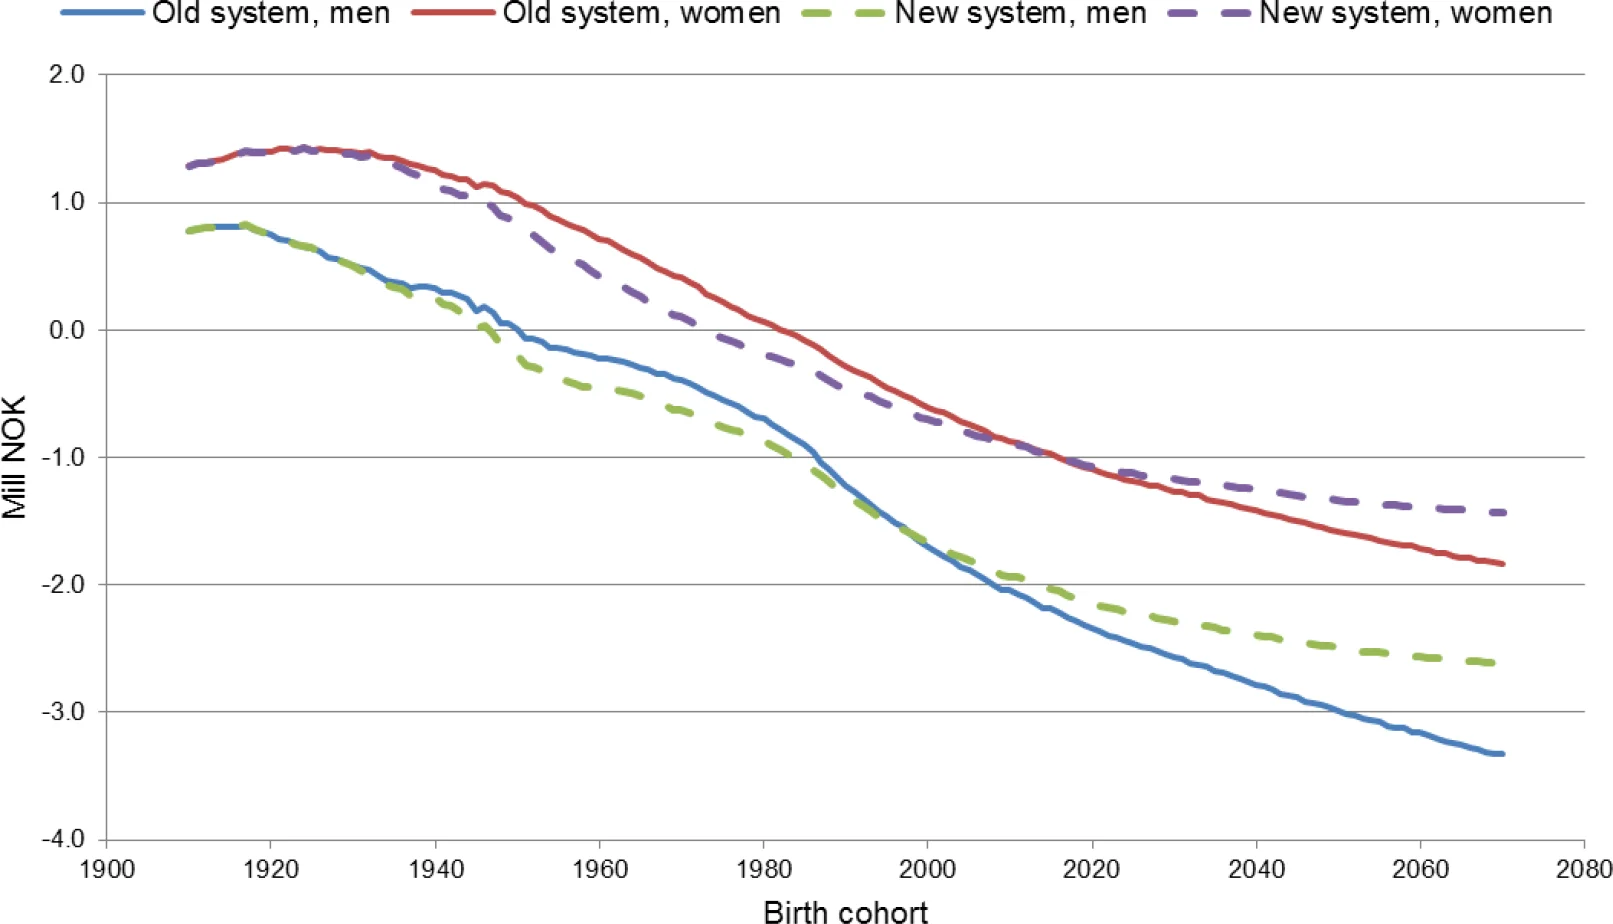
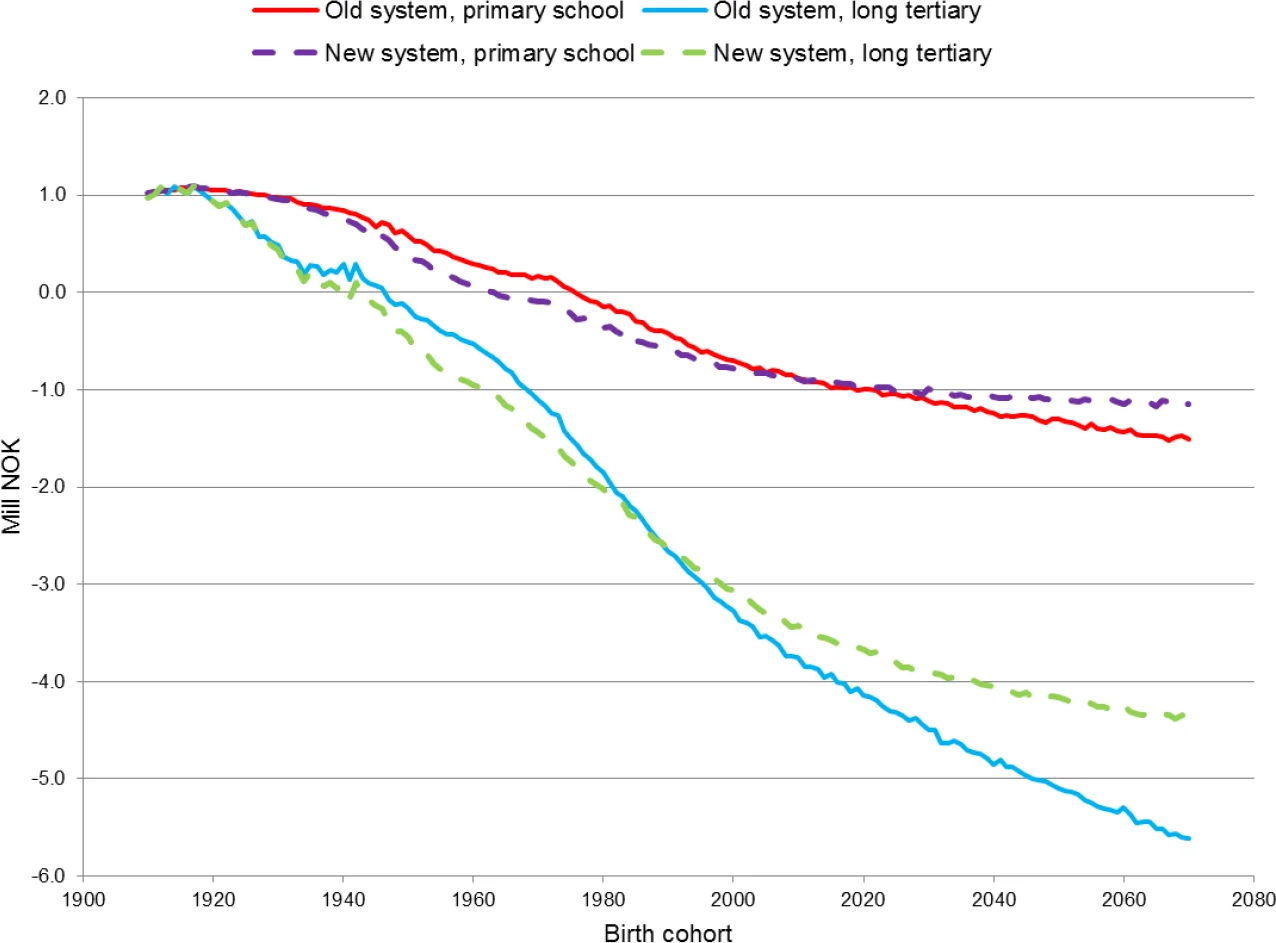
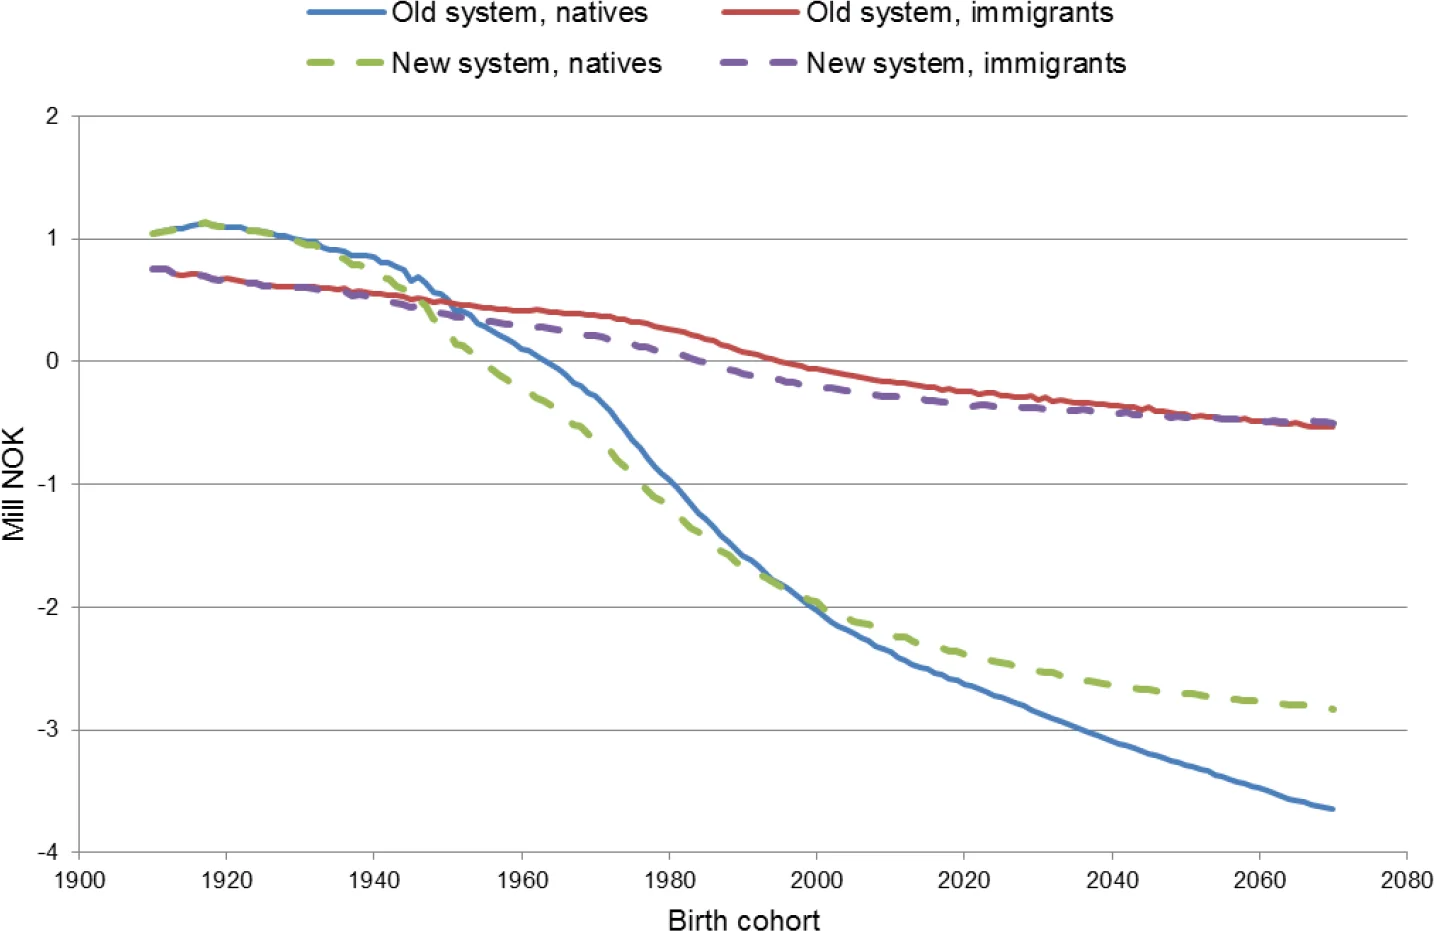
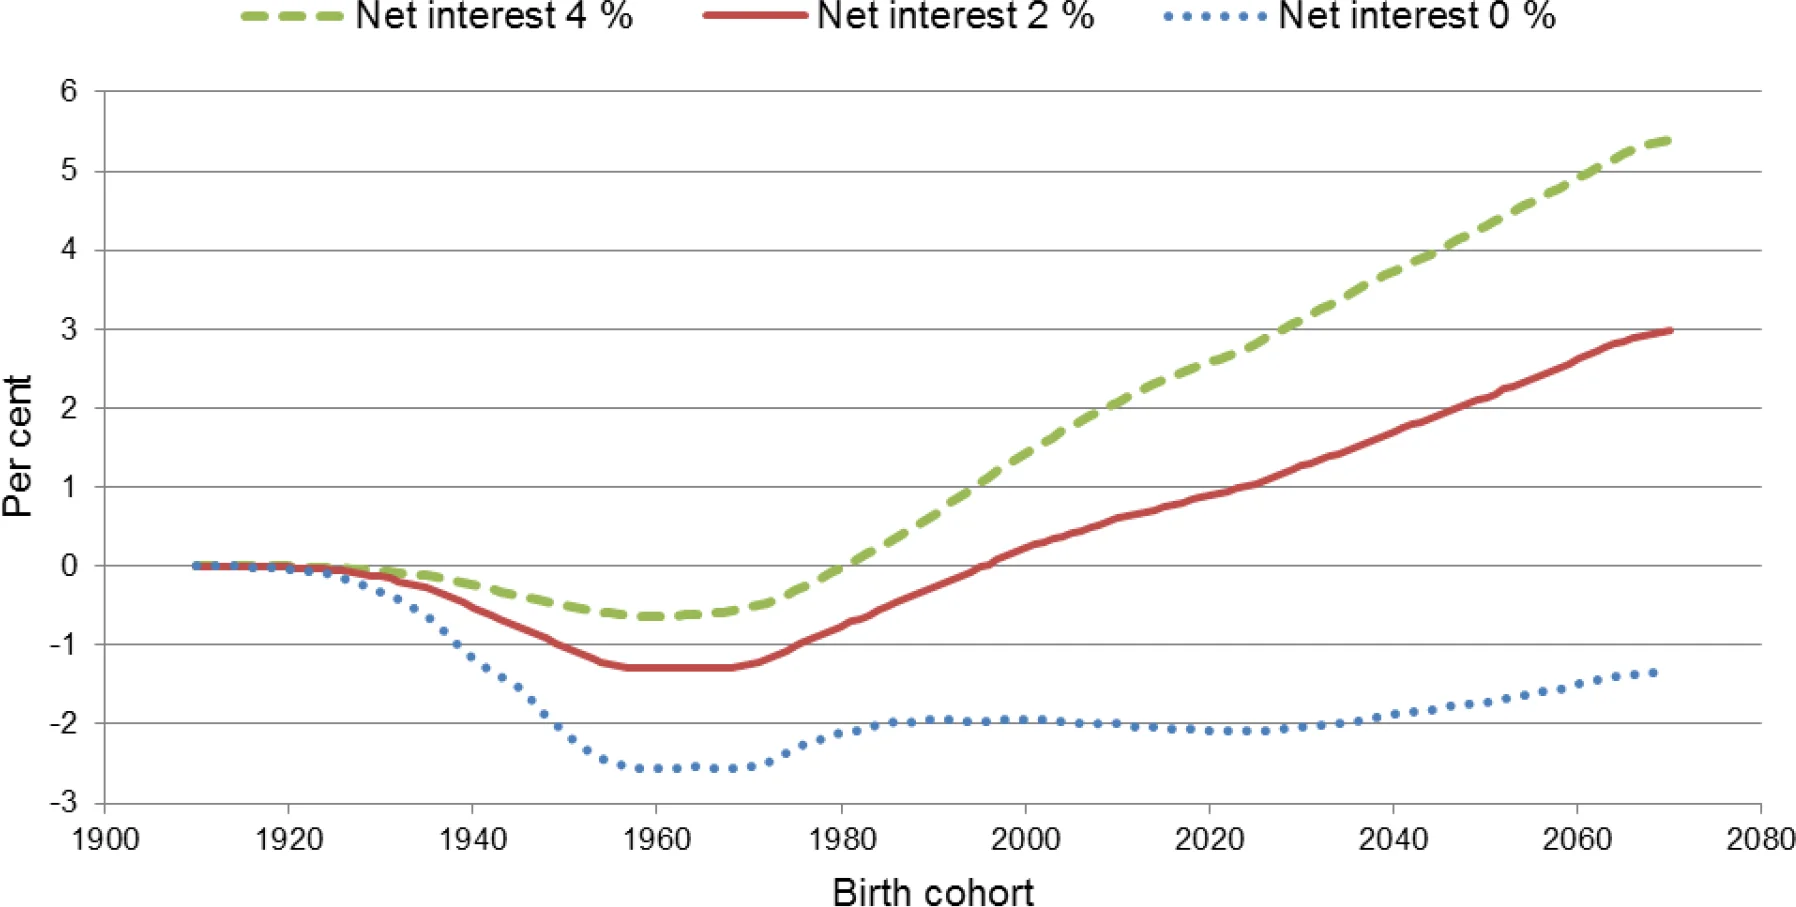
Figure 1. Structure of the dynamic micro simulation model MOSART.Figure 2. Connection between annual labour incomes and annual pension benefits with old and new pension system.Figure 3. Average contribution rates dependent on pension system and benefits included.Figure 4. Average discounted gross pension wealth at age 62 by level of education and pension system, old age pensions, net discount rate of 2 per cent. Mill NOK in 2011 amounts.Figure 5. Gross discounted pension wealth at age 62 by level of education and pension system, NIS, net discount rate of 2 per cent. Mill NOK in 2011 amounts.Figure 6. Net discounted value at age 62 for old age pension benefits and contributions, all inhabitants, net discount rate of 2 per cent. Mill NOK in 2011 amounts.Figure 7. Net discounted value at age 62 for old age pension benefits and contributions by gender, net discount rate of 2 per cent. Mill NOK in 2011 amounts.Figure 8. Net discounted value at age 62 for old age pension benefits and contributions by level of education, net discount rate of 2 per cent. Mill NOK in 2011 amounts.Figure 9. Net discounted value at age 62 for old age pension benefits and contributions, natives and immigrants, net discount rate of 2 per cent. Mill NOK in 2011 amounts.Figure 10. Change in net value for old age pensions for natives as a result of the pension reform. Change in per cent relative to labour incomes over the life course.