MILC: A microsimulation model of the natural history of lung cancer
- Brown University School of Public Health, United States
Cite this article
as: S. A Chrysanthopoulou; 2017; MILC: A microsimulation model of the natural history of lung cancer; International Journal of Microsimulation; 10(3); 5-26.
doi: 10.34196/ijm.00164
- Article
- Figures and data
- Jump to
Figures
Figure 1

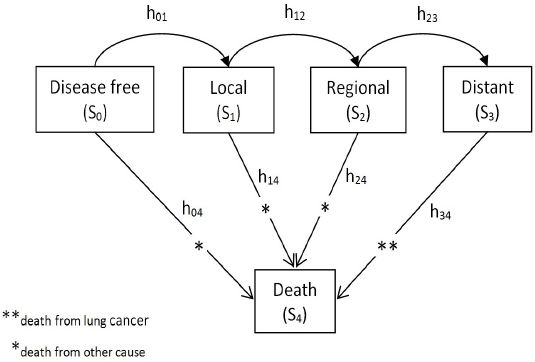
Markov state diagram of the MILC model.
Figure 2

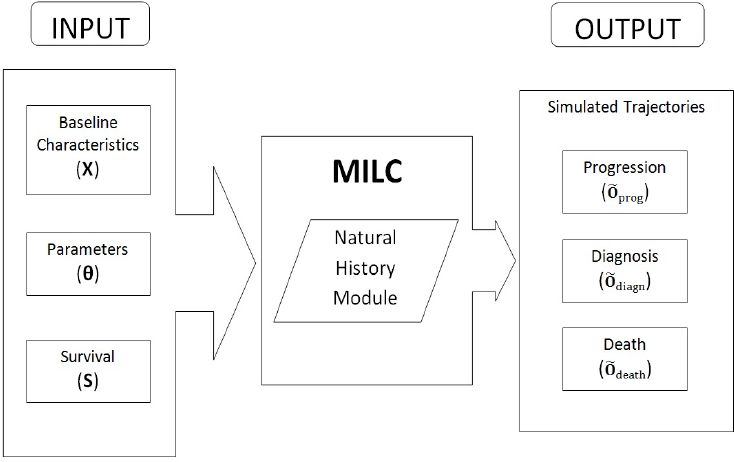
Structure of the MILC model.
Figure 3

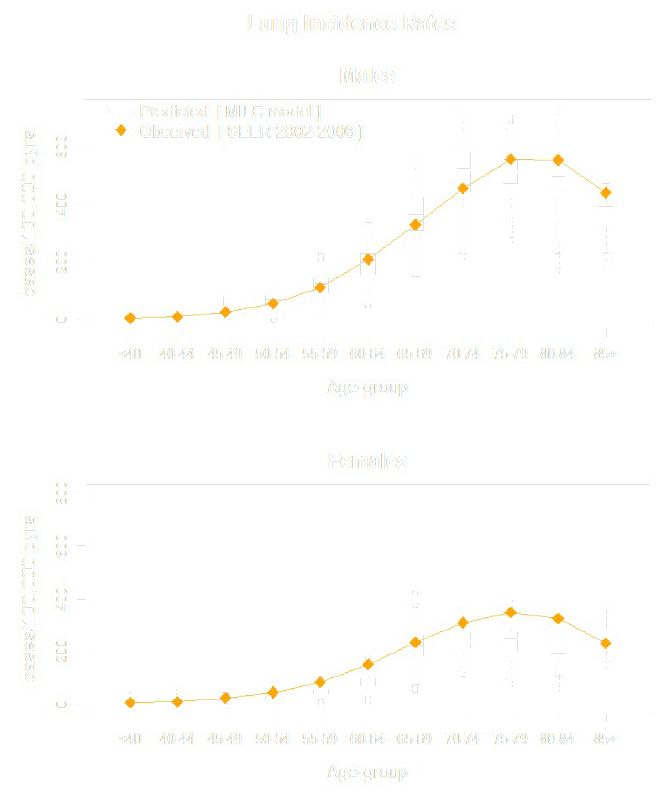
Predicted versus observed lung cancer incidence rates by age-group and sex.
Figure 4

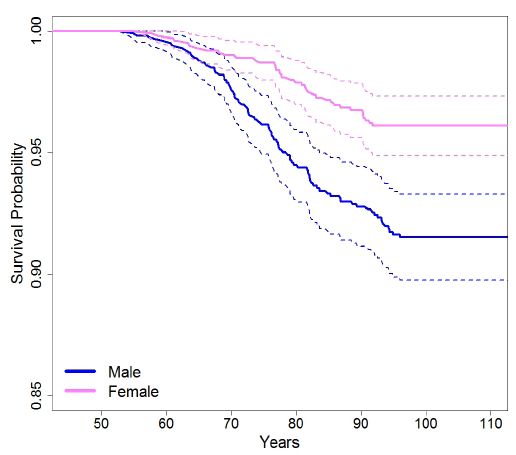
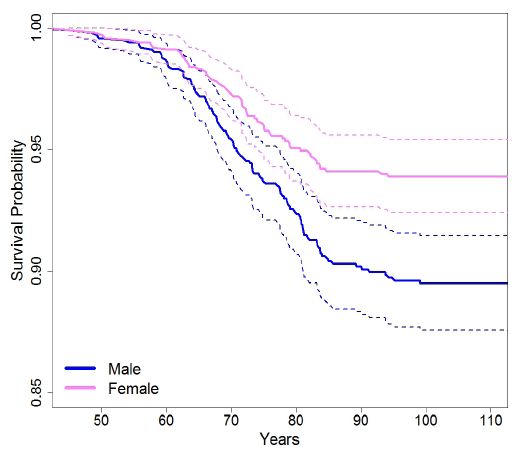
Predicted individual risk of lung cancer for people, 50 years old, smoking on average 10 cigarettes per day, by sex.
Figure 5

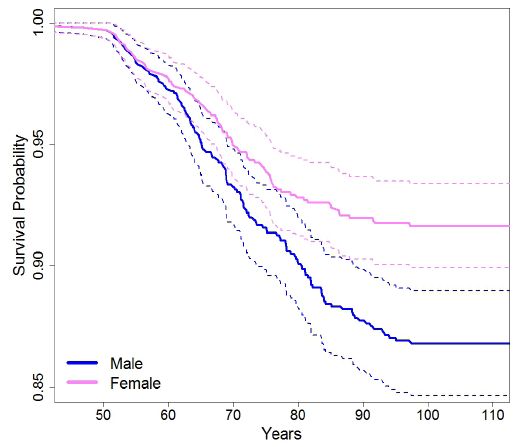
Predicted individual risk of lung cancer for people, 50 years old, smoking on average 30 cigarettes per day, by sex.
Figure 6

Predicted individual risk of lung cancer for people, 50 years old, smoking on average 50 cigarettes per day, by sex.
Figure A.1

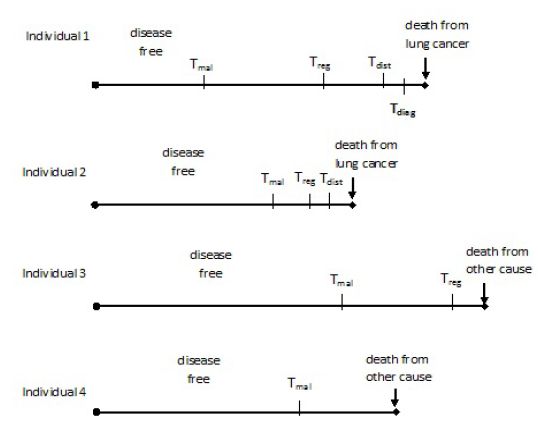
Examples of individual trajectories generated by the MILC model.
Tables
Table 1
MILC model parameterization.
| Model components |
|---|
| Initiation of the local stage: Two-Stage Clonal Expansion (TSCE) carcinogenesis model |
| Risk for the onset of the first malignant cell: |
| where
γ = α − β − µ and X: total number of normal stem cells ν: normal cell initiation rate α: division rate of initiated cells β: apoptosis rate of initiated cells µ: malignant conversion rate of initiated cells |
| Effect of smoking on α and γ parameters: <disp-formula id="equu1"> </disp-formula> |
| where q(t): average number of cigarettes smoked per day at age t (αs, γs) and (αns, γns): parameters for smokers and non-smokers respectively. |
| Tumor growth: Gompertz function <disp-formula id="equu2"> </disp-formula> |
| where V(t): tumor volume at age t V0: minimum tumor volume (one malignant cell) |
| Assuming spherical tumor growth:
<disp-formula id="equu3">
</disp-formula>
d(t): diameter at age t d0 = 0.01mm, diameter of one malignant cell dmax = 13cm, maximum tumor diameter |
| Disease progression: Transition to regional and distant stages and tumor diagnosis |
| Tumor volume at: — the beginning of the regional stage: Vreg ~ log-normal (µreg, sdreg) — the beginning of the distant stage: Vdist ~ log-normal (µdist, sddist) — diagnosis: Vdiagn ~ log-normal(µdiagn, sddiagn) |
| where <disp-formula id="equu4"> </disp-formula> |
Table 2
Values and calculations for the fixed and calibrated parameters of the MILC model.
| Parameter | Sex | Description | |
|---|---|---|---|
| Male | Female | ||
| Onset of the first malignant cella | |||
| All | |||
| X | IOe+7 | Total number of normal stem cells | |
| Non-Smokers | |||
| vns | 7.16e-8 | 1.07e-7 | Normal cell initiation rate |
| αns | 7.7 | 15.82 | Division rate of initiated cells |
| γns | 0.09 | 0.071 | |
| µns | vns | Malignant conversion rate of initiated cells | |
| βns | αns − µns γns | Apoptosis rate of initiated cells | |
| Smokers | |||
| νs | νns | 0.98xνns | Normal cell initiation rate |
| α1 | 0.6 | 0.5 | |
| α2 | 0.22 | 0.32 | |
| αs | αns×(I+α1 × [q(t)]α2) | Power law relationships between γ, α and | |
| γs | γns×(I+α1 × [q(t)]α2) | smoking intensity q(t) at age t | |
| µs | µns | Malignant conversion rate of initiated cells | |
| βs | αs − µs − γs | Apoptosis rate of initiated cells | |
| Tumor growthb | |||
| d0 | 0.01mm | Minimum tumor diameter (one tumor cell) | |
| dmax | 130mm | Maximum tumor diameter | |
| m | 3.4e-4 | Scale parameter of the Gompertz distribution | |
| [3.2e-4, 3.6e-4] | |||
| s | 31× m | Shape parameter of the Gompertz distribution | |
| Disease progression | |||
| µreg = sdreg | 2.16 [1.37, 3.06] | Mean and sd of the logNormal distribution for | |
| µdist = sddist | 5.62 [3.59, 8.02] | the tumor volume at the beginning of the regional, | |
| µdiagn = sddiagn | 2.65 [1.52, 3.94] | distant stage, and diagnosis | |
-
Notes: Values for the calibrated MILC parameters are presented as Q2 [Q1, Q3], where Q2 is the median, and Q1, Q3 are the 1st and 3rd quartiles respectively. The values and distributions of MILC parameters are the same for males and females, unless otherwise indicated.
-
Sources:
-
a
Ad hoc values from Hazelton et al. (2005).
-
b
Ad hoc values from Koscielny et al. (1985).
Table A.1
Simulation algorithm to predict the lung cancer trajectory of an individual using the MILC model.
| Steps |
|---|
| 1. “Feed” the model with the individual baseline characteristics X=(age, sex, smoking history a). |
| 2. Simulate age of death (Td_other) from a cause other than lung cancer given age, sex, and smoking status. |
| 3. Simulate age at the onset of the first malignant cell (Tmal), given sex, and smoking history. |
| 4. Simulate ages at the beginning of regional (Treg), and distant stage (Tdist) given Tmal, and tumor growth rate. |
| 5. Simulate age (Tdiagn) at diagnosis given Tmal, and tumor diameter (ddiagn). |
| 6. Find tumor stage at diagnosis comparing Tdiagn with Treg and Tdist. |
| 7. Simulate age of death from lung cancer (Td_lung) given the simulated individual’s characteristics at diagnosis (Tdiagn, and tumor stage). |
| 8. Predict one trajectory, that is, combine the simulated characteristics to “tell” a story for the specific individual with covariates X. |
-
a
Smoking history comprises: smoking status (never, former or current smoker), smoking intensity (average number of cigarettes smoked per day), as well as start and quit smoking ages where relevant.
Download links
A two-part list of links to download the article, or parts of the article, in various formats.