Female labour force projections using microsimulation for six EU countries
- Institute for New Economic Thinking at the Oxford Martin School, United Kingdom
- Universita’ di Torino and LABORatorio Revelli, Italy
- University of Milan-Bicocca and LABORatorio Revelli, Italy
- Institute for New Economic Thinking at the Oxford Martin School and Nuffield College, Italy
- Article
- Figures and data
- Jump to
Figures
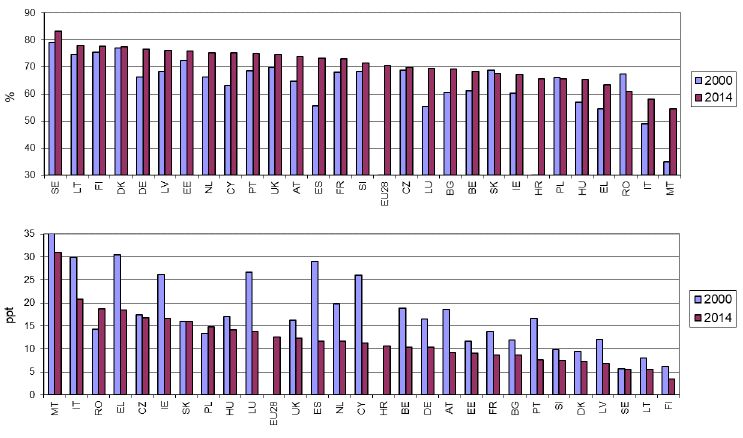
Female participation rates (top panel) and gender participation gaps (bottom panel). Age group: 20–64.

Female employment rates (top panel) and gender employment gaps (bottom panel). Age group: 20–64.

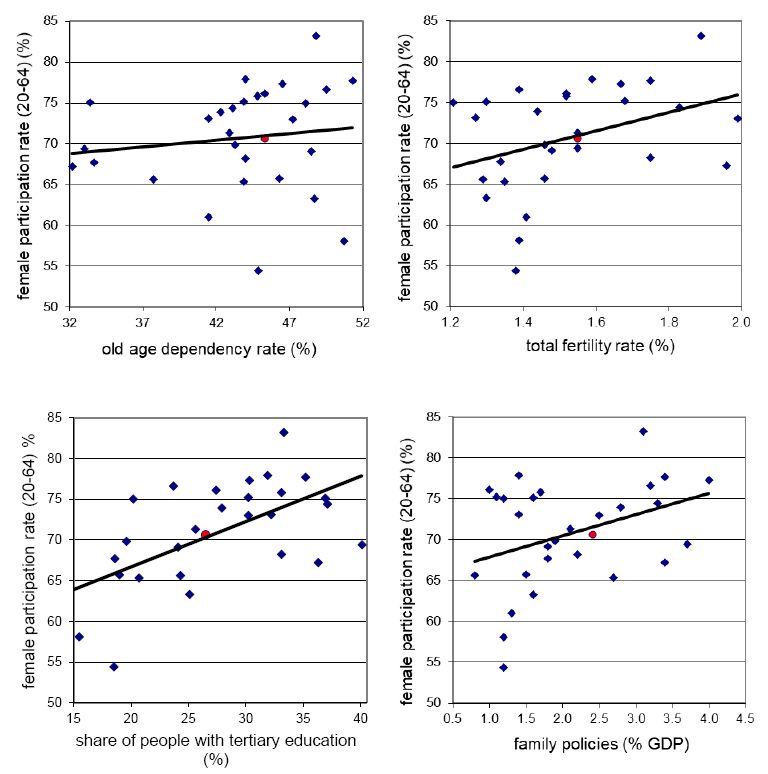
Correlations between the female participation rate and key demographic and economic variables in the EU28 countries. Red dot: EU28 average.

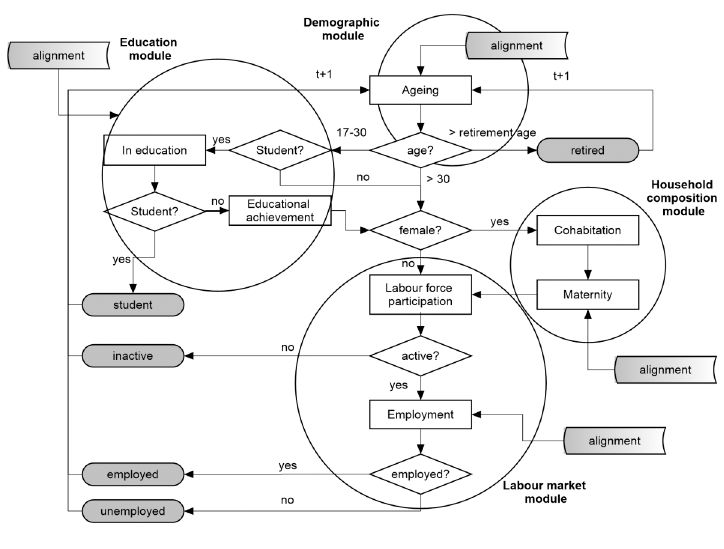
Model structure.

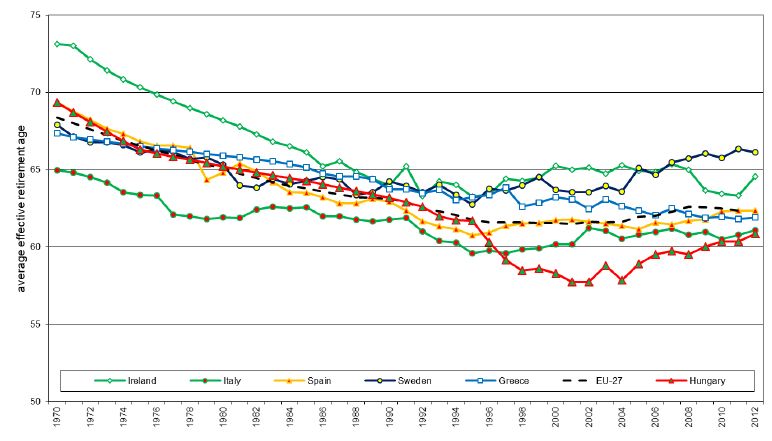
Average effective age of retirement – men.
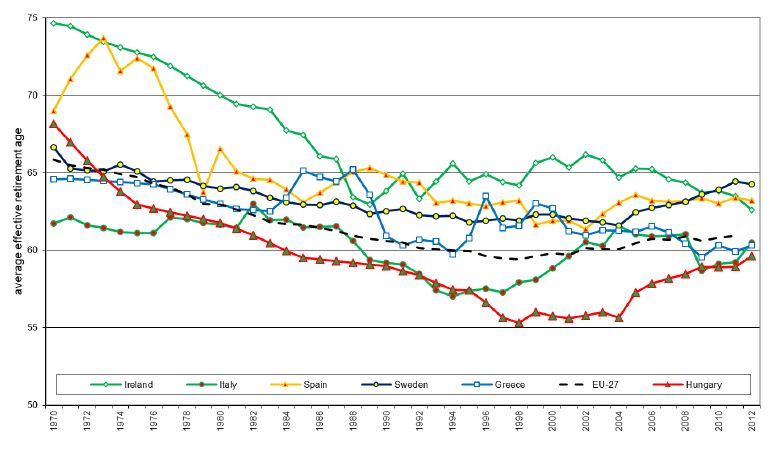

Average effective age of retirement – women.
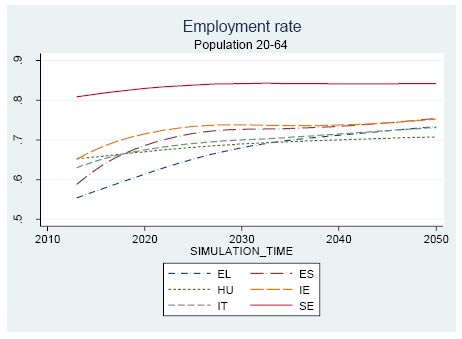
Projected employment rates (20–64 years old), and target line at 75%.

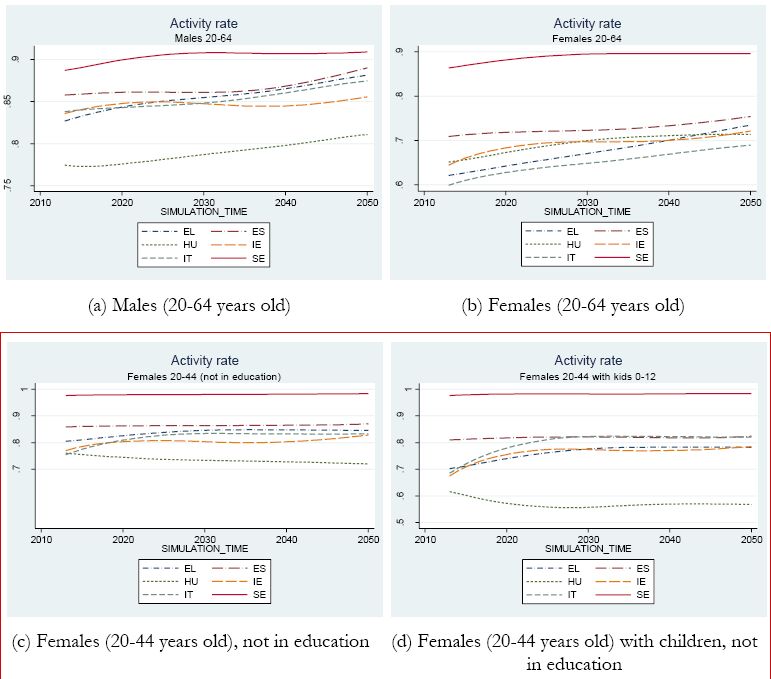
Projected labour force participation rates.

Projected employment rates.
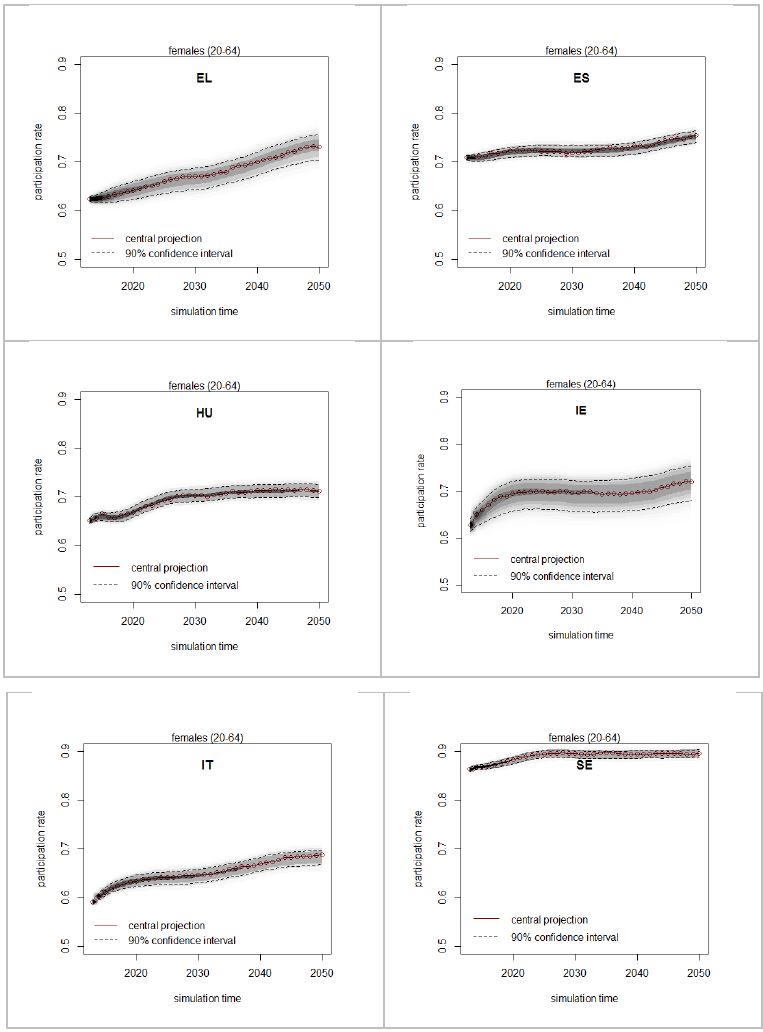
Uncertainty analysis.
Tables
Gender Equality Index: Participation.
| Country | Index | Country | Index |
|---|---|---|---|
| Sweden | 94.7 | France | 75.0 |
| Denmark | 85.3 | Bulgaria | 72.9 |
| Finland | 85.3 | Slovakia | 72.3 |
| Estonia | 83.6 | Romania | 71.8 |
| Latvia | 80.8 | Luxembourg | 71.3 |
| Lithuania | 79.8 | Poland | 71.1 |
| Cyprus | 79.6 | Ireland | 69.8 |
| Portugal | 78.4 | Spain | 69.5 |
| Slovenia | 77.4 | Hungary | 67.5 |
| United Kingdom | 77.4 | Belgium | 66.9 |
| Austria | 77.0 | Croatia | 62.0 |
| Germany | 75.9 | Greece | 59.5 |
| Netherlands | 75.6 | Italy | 57.1 |
| Czech Republic | 75.3 | Malta | 56.2 |
-
Notes: The index ranges from 0 (maximum inequality) to 100 (maximum equality). Countries selected for analysis are in bold.
Determinants of the estimated processes at an individual level.
| Outcome | Determinants |
|---|---|
| Student | age, gender, region |
| Education | age, gender, region |
| Consensual union (female only) | age, student(t−1), education, participation(t−1), cohabitation(t−1), children(t−1), region, retired(t−1) |
| Maternity (female only) | age, student(t−1), education, participation(t−1), cohabitation(t−1), children(t−1), region, fertility rate, public childcare, maternity benefits, part-time rate |
| Participation: women with children aged 0–3 inclusive | age, student(t−1), education, participation(t−1), cohabitation(t−1), region, public childcare, maternity benefits, part-time rate, post-crisis dummy |
| Participation: women with children aged 4–12 inclusive | age, student(t−1), education, participation(t−1), cohabitation(t−1), region, part-time rate, post-crisis dummy |
| Participation: women without children aged 0–12 inclusive | age, student(t−1), education, participation(t−1), cohabitation(t−1), region, post-crisis dummy |
| Participation: men | age, student(t−1), education, participation(t−1), region, post-crisis dummy |
| Employment | age, gender, student(t−1), education, participation(t−1), unemployment rate, region, post-crisis dummy |
-
Notes: Determinants annotated with (t−1) symbolise that the one-period (one year) lag is used.
Scenario and model parameters.
| Scenario parameters | Differentiated by* | Modules affected |
|---|---|---|
| Initial status at age 17 years | gender and simulation time | 17-year olds |
| Persistence of the effects of the Great Recession | simulation time | Participation |
| Overall unemployment rate | simulation time | Employment |
| Policy parameters | Differentiated by* | Modules affected |
| Average retirement age | gender and simulation time | Retirement |
| Standard deviation of retirement age | gender and simulation time | Retirement |
| Public childcare expenditures | region (NUTS 116) and simulation time | Maternity Participation (females with children aged 3 years or under only) |
| Leave benefits | simulation time | Maternity Participation (females with children aged 3 years or under only) |
| Availability of part-time work | region (NUTS 1) and simulation time | Maternity Participation (females with children only) |
-
*
All parameters (not further distinguished by region) are also differentiated by countries. Simulation time runs from 2013 to 2050.
Comparison of microsimulation model (MSM) outcomes with the projections of the cohort simulation model (CSM) of the 2015 Ageing Report (European Commission, 2015). Labour force participation (male and female population).
| Outcome | Participation rate (%) | Participation rate (%) | ||||
|---|---|---|---|---|---|---|
| Model | Eurostat | CSM | MSM | Eurostat | CSM | MSM |
| Age group | 15–64 | 15–64 | 18–64 | 55–64 | 55–64 | 55–64 |
| Time | 2013 | 2060 | 2050 | 2013 | 2060 | 2050 |
| Greece (EL) | 67.7 | 75.4 | 77.3 | 42.4 | 78.0 | 76.8 |
| Spain (ES) | 74.2 | 78.9 | 79.3 | 54.2 | 82.5 | 76.9 |
| Hungary (HU) | 64.7 | 73.0 | 72.8 | 41.8 | 77.5 | 75.1 |
| Ireland (IE) | 69.7 | 68.2 | 75.2 | 57.3 | 64.6 | 77.5 |
| Italy (IT) | 63.4 | 65.2 | 75.2 | 45.4 | 69.0 | 70.9 |
| Sweden (SE) | 81.3 | 82.3 | 86.3 | 77.7 | 78.9 | 95.1 |
Comparison of microsimulation model (MSM) outcomes with the projections of the cohort simulation model (CSM) of the 2015 Ageing Report (European Commission, 2015). Employment and unemployment (male and female population).
| Outcome | Employment rate (%) | Employment rate (%) | Unemployment rate (%) | ||||||
|---|---|---|---|---|---|---|---|---|---|
| Model | Eurostat | CSM | MSM | Eurostat | CSM | MSM | Eurostat | CSM | MSM |
| Age group | 15–64 | 15–64 | 18–64 | 55–64 | 55–64 | 55–64 | 15–64 | 15–64 | 18–64 |
| Time | 2013 | 2060 | 2050 | 2013 | 2060 | 2050 | 2013 | 2060 | 2050 |
| Greece (EL) | 48.7 | 69.8 | 69.6 | 35.5 | 74.6 | 73.8 | 28.0 | 7.5 | 9.9 |
| Spain (ES) | 54.5 | 73.0 | 72.3 | 43.4 | 77.9 | 72.9 | 26.5 | 7.5 | 8.8 |
| Hungary (HU) | 58.0 | 67.5 | 67.2 | 38.6 | 73.6 | 71.5 | 10.3 | 7.5 | 7.6 |
| Ireland (IE) | 60.4 | 63.5 | 71.6 | 51.2 | 61.3 | 76.5 | 13.3 | 6.8 | 4.9 |
| Italy (IT) | 55.5 | 60.3 | 69.7 | 42.8 | 66.7 | 69.5 | 12.4 | 7.5 | 7.3 |
| Sweden (SE) | 74.6 | 77.4 | 80.0 | 73.7 | 76.0 | 92.1 | 8.2 | 5.9 | 7.4 |
Participation rates and participation gaps with respect to Sweden, female population aged 20–64 years, baseline scenario.
| Females (20–64 years old) | |||||
|---|---|---|---|---|---|
| Year | 2013 | 2020 | 2030 | 2040 | 2050 |
| Participation rates (%) | |||||
| Sweden | 86.4 | 88.3 | 89.6 | 89.4 | 89.7 |
| Spain | 70.9 | 72.3 | 71.8 | 73.3 | 75.5 |
| Hungary | 65.1 | 66.8 | 70.2 | 71.3 | 71.3 |
| Ireland | 62.8 | 69.5 | 69.6 | 69.6 | 72 |
| Greece | 62.4 | 64.1 | 67.1 | 70 | 73 |
| Italy | 59.0 | 63.3 | 64.7 | 67 | 68.8 |
| Participation gap w.r.t. Sweden (%) | |||||
| Spain | 15.5 | 16.0 | 17.8 | 16.1 | 14.2 |
| Hungary | 21.3 | 21.5 | 19.4 | 18.1 | 18.4 |
| Ireland | 23.6 | 18.8 | 20.0 | 19.8 | 17.7 |
| Greece | 24.0 | 24.2 | 22.5 | 19.4 | 16.7 |
| Italy | 27.4 | 25.0 | 24.9 | 22.4 | 20.9 |
Probit Estimates of the probability of remaining in education, Education module.
| Enrolment | EL | ES | HU | ||||||
|---|---|---|---|---|---|---|---|---|---|
| (probit) | Coefficient | Robust SE | Coefficient | Robust SE | Coefficient | Robust SE | |||
| gender = Female | −0.092 | 0.060 | 0.064 | 0.038 | 0.045 | 0.042 | |||
| age > 22 & age <= 25 | −0.406 | ** | 0.071 | −0.462 | ** | 0.045 | −0.519 | ** | 0.050 |
| age >25 & age <=30 | −0.989 | ** | 0.099 | −0.923 | ** | 0.057 | −1.355 | ** | 0.082 |
| regional dummies | yes | yes | yes | yes | yes | yes | yes | yes | yes |
| _cons | 1.200 | ** | 0.065 | 1.012 | ** | 0.057 | 1.239 | ** | 0.054 |
| Pseudo R2 | 0.049 | 0.055 | 0.069 | ||||||
| Number of observations | 2,556 | 5,916 | 5,107 | ||||||
| Enrolment | IE | IT | SE | ||||||
| (probit) | Coefficient | Robust SE | Coefficient | Robust SE | Coefficient | Robust SE | |||
| gender = Female | 0.020 | 0.088 | 0.064 | 0.033 | −0.030 | 0.048 | |||
| age > 22 & age <= 25 | −0.993 | ** | 0.174 | −0.159 | ** | 0.040 | −0.049 | 0.074 | |
| age >25 & age <=30 | −0.274 | 0.279 | −0.666 | ** | 0.045 | −0.398 | ** | 0.080 | |
| regional dummies | yes | yes | yes | yes | yes | yes | yes | yes | |
| _cons | 0.654 | ** | 0.065 | 0.952 | ** | 0.045 | 0.567 | ** | 0.049 |
| Pseudo R2 | 0.0331 | 0.0298 | 0.0075 | ||||||
| Number of observations | 922 | 7,816 | 2,660 | ||||||
-
Notes: Population at risk: students aged 18–29 years.
Multinomial probit estimates of the probability of having attained a specific educational level, Education module (base outcome is education = Medium).
| Education | EL | ES | HU | ||||||
|---|---|---|---|---|---|---|---|---|---|
| (multinomial probit) | Coefficient | Robust SE | Coefficient | Robust SE | Coefficient | Robust SE | |||
| education = High | |||||||||
| gender = Female | 0.757 | ** | 0.241 | 0.162 | 0.123 | 0.719 | ** | 0.160 | |
| Age | 3.827 | ** | 0.635 | 2.298 | ** | 0.357 | 5.329 | ** | 0.721 |
| age squared | −0.071 | ** | 0.013 | −0.042 | ** | 0.007 | −0.099 | ** | 0.015 |
| regional dummies | yes | yes | yes | ||||||
| constant | −51.059 | ** | 7.868 | −30.380 | ** | 4.317 | −71.249 | ** | 8.805 |
| education = Low | |||||||||
| gender = Female | −0.534 | 0.307 | −0.473 | ** | 0.128 | −0.253 | 0.195 | ||
| age | −1.813 | ** | 0.638 | −2.006 | ** | 0.280 | −4.744 | ** | 0.461 |
| age squared | 0.038 | ** | 0.014 | 0.039 | ** | 0.006 | 0.094 | ** | 0.010 |
| regional dummies | Yes | yes | yes | ||||||
| constant | 19.835 | ** | 7.253 | 25.045 | ** | 3.217 | 56.681 | ** | 5.409 |
| Number of observations | 431 | 1,234 | 928 | ||||||
| Education | IE | IT | SE | ||||||
| (multinomial probit) | Coefficient | Robust SE | Coefficient | Robust SE | Coefficient | Robust SE | |||
| education = High | |||||||||
| gender = Female | 0.140 | 0.366 | 0.371 | ** | 0.124 | 0.314 | * | 0.209 | |
| age | −1.315 | 2.872 | 2.998 | ** | 0.534 | 0.540 | ** | 0.535 | |
| age squared | 0.053 | 0.068 | −0.053 | ** | 0.010 | 4.084 | ** | 0.0110732 | |
| regional dummies | yes | yes | yes | ||||||
| constant | 3.025 | 30.189 | −41.766 | ** | 6.803 | −55.727 | 6.396 | ||
| education = Low | |||||||||
| gender = Female | −0.148 | 0.376 | −0.172 | 0.121 | −0.145 | 0.163 | |||
| age | −7.570 | ** | 1.951 | −1.227 | ** | 0.254 | −1.103 | * | 0.477 |
| age squared | 0.175 | ** | 0.048 | 0.025 | ** | 0.005 | 0.026 | * | 0.010 |
| regional dummies | yes | yes | yes | ||||||
| constant | 79.188 | ** | 19.796 | 13.336 | ** | 2.941 | 10.251 | 5.474 | |
| Number of observations | 219 | 1,511 | 848 | ||||||
-
Notes: Population at risk: former students aged 18–30 who have just left education.
Probit estimates of the probability of living in consensual union, Household composition module.
| Living in union | EL | ES | HU | ||||||
|---|---|---|---|---|---|---|---|---|---|
| (probit) | Coefficient | Robust SE | Coefficient | Robust SE | Coefficient | Robust SE | |||
| active (t-1) | −0.146 | * | 0.059 | −0.098 | * | 0.040 | −0.040 | 0.050 | |
| student (t-1) | −0.575 | * | 0.242 | −0.726 | ** | 0.158 | −0.253 | 0.192 | |
| living in union (t-1) | 4.085 | ** | 0.060 | 3.907 | ** | 0.037 | 4.028 | ** | 0.040 |
| children aged 3 or under (t-1) | −0.036 | 0.152 | 0.089 | 0.075 | 0.247 | * | 0.113 | ||
| retired (t-1) | 0.058 | 0.072 | 0.004 | 0.058 | −0.010 | 0.062 | |||
| age | 0.040 | ** | 0.011 | 0.026 | ** | 0.007 | 0.021 | * | 0.010 |
| age squared | −0.001 | ** | 0.000 | −0.000 | ** | 0.000 | 0.000 | ** | 0.000 |
| education = Medium | 0.007 | 0.053 | −0.059 | 0.041 | 0.134 | ** | 0.043 | ||
| education = High | 0.151 | * | 0.067 | 0.015 | 0.040 | 0.059 | 0.053 | ||
| regional dummies | yes | yes | yes | ||||||
| constant | −2.374 | ** | 0.256 | −2.027 | ** | 0.171 | −2.336 | ** | 0.236 |
| Pseudo R2 | 0.846 | 0.831 | 0.842 | ||||||
| Number of observations | 16,725 | 33,353 | 24,977 | ||||||
| Living in union | IE | IT | SE | ||||||
| (probit) | Coefficient | Robust SE | Coefficient | Robust SE | Coefficient | Robust SE | |||
| active (t-1) | −0.071 | 0.071 | −0.059 | 0.039 | −0.213 | ** | 0.073 | ||
| student (t-1) | −0.675 | 0.471 | −0.280 | * | 0.110 | −0.548 | ** | 0.141 | |
| living in union (t-1) | 3.964 | ** | 0.095 | 4.304 | ** | 0.035 | 3.092 | ** | 0.050 |
| children aged 3 or under (t-1) | 0.552 | ** | 0.140 | 0.137 | 0.092 | 0.704 | ** | 0.085 | |
| retired (t-1) | −0.573 | ** | 0.135 | 0.043 | 0.044 | 0.001 | 0.089 | ||
| age | 0.152 | ** | 0.019 | 0.029 | ** | 0.007 | 0.089 | ** | 0.011 |
| age squared | −0.001 | ** | 0.000 | −0.000 | ** | 0.000 | −0.001 | ** | 0.000 |
| education = Medium | 0.392 | ** | 0.079 | −0.055 | 0.035 | −0.016 | 0.054 | ||
| education = High | 0.300 | ** | 0.087 | −0.007 | 0.050 | 0.031 | 0.057 | ||
| regional dummies | yes | Yes | yes | ||||||
| constant | −6.280 | ** | 0.529 | −2.112 | ** | 0.156 | −3.515 | ** | 0.271 |
| Pseudo R2 | 0.796 | 0.874 | 0.641 | ||||||
| Number of observations | 6,817 | 48,036 | 13,596 | ||||||
-
Notes: Population at risk: females aged 18–75 who are not students.
Pooled probit estimates of the probability of having a child, Household composition module.
| Maternity | EL | ES | HU | ||||||
|---|---|---|---|---|---|---|---|---|---|
| (pooled probit with country interactions) | Coefficient | Robust SE | Coefficient | Robust SE | Coefficient | Robust SE | |||
| public childcare exp. / child (000 $PPP) | 0.148 | ** | 0.015 | 0.148 | ** | 0.015 | 0.148 | ** | 0.015 |
| on leave benefits (weeks) | −0.004 | 0.010 | −0.00 | 0.010 | −0.004 | 0.0102 | |||
| availability of part-time work (%) | 1.298 | 0.955 | 1.298 | 0.955 | 1.298 | 0.9554 | |||
| active (t-1) | 0.059 | 0.044 | 0.059 | 0.044 | 0.059 | 0.0438 | |||
| student (t-1) | −0.126 | 0.099 | −0.126 | 0.099 | −0.126 | 0.0994 | |||
| living in union (t-1) | 0.768 | ** | 0.050 | 0.768 | ** | 0.050 | 0.768 | ** | 0.0498 |
| children aged 3 or under (t-1) | 0.310 | * | 0.134 | −0.650 | ** | 0.099 | −0.405 | * | 0.1639 |
| children aged 4–12 (t-1) | −0.553 | ** | 0.182 | −0.393 | ** | 0.079 | −0.678 | ** | 0.1721 |
| age | 0.262 | ** | 0.030 | 0.262 | ** | 0.030 | 0.262 | ** | 0.0303 |
| age squared | −0.005 | ** | 0.001 | −0.005 | ** | 0.001 | −0.005 | ** | 0.0005 |
| education = Medium | 0.039 | 0.043 | 0.039 | 0.043 | 0.039 | 0.043 | |||
| education = High | 0.163 | ** | 0.045 | 0.163 | ** | 0.045 | 0.163 | ** | 0.045 |
| regional dummies | Yes | yes | yes | ||||||
| fertility rate | 27.476 | ** | 2.875 | 27.476 | ** | 2.875 | 27.476 | ** | 2.875 |
| constant | −6.513 | ** | 0.589 | −6.513 | ** | 0.589 | −6.513 | ** | 0.589 |
| Maternity | IE | IT | SE | ||||||
| (pooled probit with country interactions) | Coefficient | Robust SE | Coefficient | Robust SE | Coefficient | Robust SE | |||
| public childcare exp. / child (000 $PPP) | 0.148 | ** | 0.015 | 0.148 | ** | 0.015 | 0.148 | ** | 0.015 |
| on leave benefits (weeks) | −0.004 | 0.010 | −0.004 | 0.010 | −0.004 | 0.010 | |||
| availability of part-time work (%) | 1.298 | 0.955 | 1.298 | 0.955 | 1.298 | 0.955 | |||
| active (t-1) | 0.059 | 0.044 | 0.059 | 0.044 | 0.059 | 0.044 | |||
| student (t-1) | −0.126 | 0.099 | −0.126 | 0.099 | −0.126 | 0.099 | |||
| living in union (t-1) | 0.768 | ** | 0.050 | 0.768 | ** | 0.050 | 0.768 | ** | 0.050 |
| children aged 3 or under (t-1) | −0.317 | 0.266 | −0.871 | ** | 0.090 | −0.977 | ** | 0.178 | |
| children aged 4–12 (t-1) | −0.368 | 0.246 | −0.467 | ** | 0.057 | −0.716 | ** | 0.140 | |
| age | 0.262 | ** | 0.030 | 0.262 | ** | 0.030 | 0.262 | ** | 0.030 |
| age squared | −0.005 | ** | 0.001 | −0.005 | ** | 0.001 | −0.005 | ** | 0.001 |
| education = Medium | 0.039 | 0.043 | 0.039 | 0.043 | 0.039 | 0.043 | |||
| education = High | 0.163 | ** | 0.045 | 0.163 | ** | 0.045 | 0.163 | ** | 0.045 |
| regional dummies | yes | Yes | yes | ||||||
| fertility | 27.476 | ** | 2.875 | 27.476 | ** | 2.875 | 27.476 | ** | 2.875 |
| constant | −6.513 | ** | 0.589 | −6.513 | ** | 0.589 | −6.513 | ** | 0.589 |
| Pseudo R2 = 0.179 | |||||||||
| Number of observations = 60,019 | |||||||||
-
Notes: Population at risk: females aged 18–45 who are not students.
Distribution of retirement age.
| Observed | EL | ES | HU | IE | IT | SE | ||||||
|---|---|---|---|---|---|---|---|---|---|---|---|---|
| retirement age | Mean | SD | Mean | SD | Mean | SD | Mean | SD | Mean | SD | Mean | SD |
| gender = Male | ||||||||||||
| 2007 | 63.3 | 6.0 | 63.6 | 5.4 | 61.8 | 2.5 | 64.5 | 1.1 | 62.3 | 7.0 | 65.8 | 4.7 |
| 2008 | 62.2 | 5.6 | 63.4 | 4.3 | 59.7 | 5.7 | 63.8 | 4.9 | 63.6 | 6.7 | 65.0 | 2.8 |
| 2009 | 62.5 | 5.2 | 63.2 | 4.1 | 60.9 | 5.8 | 65.1 | 4.4 | 62.9 | 6.4 | 65.3 | 3.8 |
| 2010 | 61.1 | 6.0 | 63.5 | 3.7 | 59.4 | 5.3 | 64.2 | 6.2 | 65.3 | 2.6 | ||
| 2011 | 62.0 | 6.0 | 62.5 | 6.0 | 60.1 | 6.0 | 63.3 | 6.1 | 66.2 | 3.1 | ||
| gender = Female | ||||||||||||
| 2007 | 60.6 | 5.5 | 63.5 | 5.0 | 59.3 | 3.3 | 66.2 | 0.8 | 63.5 | 6.5 | 64.4 | 3.4 |
| 2008 | 59.8 | 5.1 | 63.9 | 4.3 | 60.3 | 4.1 | 62.1 | 5.2 | 64.0 | 6.9 | 63.5 | 5.4 |
| 2009 | 59.0 | 8.0 | 63.6 | 3.5 | 60.0 | 3.8 | 61.9 | 7.4 | 63.5 | 6.9 | 63.6 | 5.1 |
| 2010 | 60.7 | 6.6 | 64.4 | 3.6 | 59.9 | 4.7 | 64.2 | 6.5 | 65.6 | 2.3 | ||
| 2011 | 58.9 | 6.0 | 63.1 | 5.9 | 60.8 | 4.6 | 65.5 | 6.6 | 65.3 | 2.6 | ||
Pooled probit estimates of the probability of being active, Labour market module.
| Labour market participation Females with children aged 0–3 only | EL | ES | HU | ||||||
|---|---|---|---|---|---|---|---|---|---|
| (pooled probit with country interactions) | Coefficient | Robust SE | Coefficient | Robust SE | Coefficient | Robust SE | |||
| public childcare exp. / child (000 $PPP) | 0.077 | ** | 0.020 | 0.077 | ** | 0.020 | 0.077 | ** | 0.020 |
| on leave benefits (weeks) | 0.045 | ** | 0.015 | 0.045 | ** | 0.015 | 0.045 | ** | 0.015 |
| availability of part-time work (%) | 2.489 | 1.713 | 2.489 | 1.713 | 2.489 | 1.713 | |||
| active (t-1) | 2.442 | ** | 0.290 | 1.448 | ** | 0.127 | 0.296 | * | 0.153 |
| student (t-1) | 0.311 | 0.219 | 0.311 | 0.219 | 0.311 | 0.219 | |||
| living in union (t-1) | −0.178 | * | 0.086 | −0.178 | * | 0.086 | −0.178 | * | 0.086 |
| age | 0.122 | ** | 0.047 | 0.122 | ** | 0.047 | 0.122 | ** | 0.047 |
| age squared | −0.002 | * | 0.001 | −0.002 | * | 0.001 | −0.002 | * | 0.001 |
| education = Medium | 0.233 | ** | 0.069 | 0.233 | ** | 0.069 | 0.233 | ** | 0.069 |
| education = High | 0.608 | ** | 0.081 | 0.608 | ** | 0.081 | 0.608 | ** | 0.081 |
| regional dummies | yes | yes | yes | ||||||
| crisis (year>2008) | −0.113 | 0.070 | −0.113 | 0.070 | −0.113 | 0.070 | |||
| constant | −4.313 | ** | 0.903 | −4.313 | ** | 0.903 | −4.313 | ** | 0.903 |
| Labour market participation Females with children aged 0–3 only | IE | IT | SE | ||||||
| (pooled probit with country interactions) | Coefficient | Robust SE | Coefficient | Robust SE | Coefficient | Robust SE | |||
| public childcare exp. / child (000 $PPP) | 0.077 | ** | 0.020 | 0.077 | ** | 0.020 | 0.077 | ** | 0.020 |
| on leave benefits (weeks) | 0.045 | ** | 0.015 | 0.045 | ** | 0.015 | 0.045 | ** | 0.015 |
| availability of part-time work (%) | 2.489 | 1.713 | 2.489 | 1.713 | 2.489 | 1.713 | |||
| active (t-1) | 2.598 | ** | 0.527 | 1.578 | ** | 0.092 | 0.892 | ** | 0.290 |
| student (t-1) | 0.311 | 0.219 | 0.311 | 0.219 | 0.311 | 0.219 | |||
| living in union (t-1) | −0.178 | * | 0.086 | −0.178 | * | 0.086 | −0.178 | * | 0.086 |
| age | 0.122 | ** | 0.047 | 0.122 | ** | 0.047 | 0.122 | ** | 0.047 |
| age squared | −0.002 | * | 0.001 | −0.002 | * | 0.001 | −0.002 | * | 0.001 |
| education = Medium | 0.233 | ** | 0.069 | 0.233 | ** | 0.069 | 0.233 | ** | 0.069 |
| education = High | 0.608 | ** | 0.081 | 0.608 | ** | 0.081 | 0.608 | ** | 0.081 |
| regional dummies | yes | yes | yes | ||||||
| crisis (year>2008) | −0.113 | 0.070 | −0.113 | 0.070 | −0.113 | 0.070 | |||
| constant | −4.313 | ** | 0.903 | −4.313 | ** | 0.903 | −4.313 | ** | 0.903 |
| Pseudo R2 = 0.400 | |||||||||
| Number of observations = 3,531 | |||||||||
-
Notes: Population at risk: females aged 18–74 years who are not students nor retired with children aged 0–3 years.
Pooled probit estimates of the probability of being active, Labour market module.
| Labour market participation Females with children aged 4–12 only | EL | ES | HU | ||||||
|---|---|---|---|---|---|---|---|---|---|
| (pooled probit with country interactions) | Coefficient | Robust SE | Coefficient | Robust SE | Coefficient | Robust SE | |||
| availability of part-time work (%) | 2.029 | * | 0.881 | 2.029 | * | 0.881 | 2.029 | * | 0.881 |
| active (t-1) | 3.159 | ** | 0.210 | 1.993 | ** | 0.065 | 1.787 | ** | 0.080 |
| student (t-1) | 1.307 | ** | 0.273 | 1.307 | ** | 0.273 | 1.307 | ** | 0.273 |
| living in union (t-1) | −0.195 | ** | 0.051 | −0.195 | ** | 0.051 | −0.195 | ** | 0.051 |
| age | 0.046 | 0.026 | 0.046 | 0.026 | 0.046 | 0.026 | |||
| age squared | −0.001 | * | 0.000 | −0.001 | * | 0.000 | −0.001 | * | 0.000 |
| education = Medium | 0.234 | ** | 0.036 | 0.234 | ** | 0.036 | 0.234 | ** | 0.036 |
| education = High | 0.283 | 0.184 | 0.416 | ** | 0.066 | 0.703 | ** | 0.131 | |
| regional dummies | yes | yes | yes | ||||||
| crisis (year>2008) | −0.017 | 0.037 | −0.017 | 0.037 | −0.017 | 0.037 | |||
| constant | −1.530 | ** | 0.512 | −1.530 | ** | 0.512 | −1.530 | ** | 0.512 |
| Labour market participation Females with children aged 4–12 only | IE | IT | SE | ||||||
| (pooled probit with country interactions) | Coefficient | Robust SE | Coefficient | Robust SE | Coefficient | Robust SE | |||
| availability of part-time work (%) | 2.029 | * | 0.881 | 2.029 | * | 0.881 | 2.029 | * | 0.881 |
| active (t-1) | 2.328 | ** | 0.174 | 2.269 | ** | 0.058 | 1.666 | ** | 0.238 |
| student (t-1) | 1.307 | ** | 0.273 | 1.307 | ** | 0.273 | 1.307 | ** | 0.273 |
| living in union (t-1) | −0.195 | ** | 0.051 | −0.195 | ** | 0.051 | −0.195 | ** | 0.051 |
| age | 0.046 | 0.026 | 0.046 | 0.026 | 0.046 | 0.026 | |||
| age squared | −0.001 | * | 0.000 | −0.001 | * | 0.000 | −0.001 | * | 0.000 |
| education = Medium | 0.234 | ** | 0.036 | 0.234 | ** | 0.036 | 0.234 | ** | 0.036 |
| education = High | 0.196 | 0.181 | 0.587 | ** | 0.083 | 0.964 | ** | 0.284 | |
| regional dummies | yes | yes | yes | ||||||
| crisis (year>2008) | −0.017 | 0.037 | −0.017 | 0.037 | −0.017 | 0.037 | |||
| constant | −1.530 | ** | 0.512 | −1.530 | ** | 0.512 | −1.530 | ** | 0.512 |
| Pseudo R2 = 0.475 | |||||||||
| Number of observations 12,733 | |||||||||
-
Notes: Population at risk: females aged 18–74 who are not students nor retired with children aged 4–12.
Estimates of the probability of being active, Labour market module.
| Labour market participation Females without children aged 0–12 | EL | ES | HU | ||||||
|---|---|---|---|---|---|---|---|---|---|
| (pooled probit with country interactions) | Coefficient | Robust SE | Coefficient | Robust SE | Coefficient | Robust SE | |||
| active (t-1) | 2.784 | ** | 0.041 | 2.432 | ** | 0.031 | 2.613 | ** | 0.041 |
| student (t-1) | 1.425 | ** | 0.041 | 1.425 | ** | 0.041 | 1.425 | ** | 0.041 |
| living in union (t-1) | −0.334 | ** | 0.044 | −0.292 | ** | 0.027 | −0.011 | 0.036 | |
| age | 0.060 | ** | 0.004 | 0.060 | ** | 0.004 | 0.060 | ** | 0.004 |
| age squared | −0.001 | ** | 0.000 | −0.001 | ** | 0.000 | −0.001 | ** | 0.000 |
| education = Medium | 0.038 | 0.040 | 0.208 | ** | 0.031 | 0.301 | ** | 0.040 | |
| education = High | 0.446 | ** | 0.057 | 0.601 | ** | 0.036 | 0.757 | ** | 0.061 |
| regional dummies | yes | yes | yes | ||||||
| crisis (year>2008) | 0.001 | 0.015 | 0.001 | 0.015 | 0.001 | 0.015 | |||
| constant | −1.669 | ** | 0.094 | −1.669 | ** | 0.094 | −1.669 | ** | 0.094 |
| Labour market participation Females without children aged 0–12 | IE | IT | SE | ||||||
| (pooled probit with country interactions) | Coefficient | Robust SE | Coefficient | Robust SE | Coefficient | Robust SE | |||
| active (t-1) | 2.866 | ** | 0.067 | 2.348 | ** | 0.026 | 2.639 | ** | 0.075 |
| student (t-1) | 1.425 | ** | 0.041 | 1.425 | ** | 0.041 | 1.425 | ** | 0.041 |
| living in union (t-1) | −0.122 | 0.064 | −0.263 | ** | 0.023 | −0.041 | 0.074 | ||
| age | 0.060 | ** | 0.004 | 0.060 | ** | 0.004 | 0.060 | ** | 0.004 |
| age squared | −0.001 | ** | 0.000 | −0.001 | ** | 0.000 | −0.001 | ** | 0.000 |
| education = Medium | 0.350 | ** | 0.069 | 0.244 | ** | 0.023 | 0.244 | ** | 0.083 |
| education = High | 0.705 | ** | 0.086 | 0.585 | ** | 0.040 | 0.492 | ** | 0.100 |
| regional dummies | yes | yes | yes | ||||||
| crisis (year>2008) | 0.001 | 0.015 | 0.001 | 0.015 | 0.001 | 0.015 | |||
| constant | −1.669 | ** | 0.094 | −1.669 | ** | 0.094 | −1.669 | ** | 0.094 |
| Pseudo R2 = 0.652 | |||||||||
| Number of observations 88,988 | |||||||||
-
Notes: Population at risk: females aged 18–74 years who are not students nor retired, without children aged 0–12 years.
Estimates of the probability of being active, Labour market module.
| EL | ES | HU | |||||||
|---|---|---|---|---|---|---|---|---|---|
| (probit) | Coefficient | Robust SE | Coefficient | Robust SE | Coefficient | Robust SE | |||
| active (t-1) | 3.104 | *** | 0.094 | 2.730 | *** | 0.049 | 2.602 | *** | 0.046 |
| student (t-1) | 1.533 | *** | 0.152 | 1.407 | *** | 0.091 | 0.988 | *** | 0.099 |
| age | −0.014 | *** | 0.016 | 0.026 | *** | 0.010 | −0.011 | 0.012 | |
| age squared | 0.000 | 0.000 | 0.000 | *** | 0.000 | 0.000 | 0.000 | ||
| education = Medium | 0.120 | * | 0.068 | 0.226 | *** | 0.047 | 0.392 | *** | 0.041 |
| education = High | 0.408 | *** | 0.104 | 0.393 | *** | 0.048 | 0.845 | *** | 0.076 |
| regional dummies | yes | yes | yes | ||||||
| crisis (year>2008) | 0.090 | 0.077 | −0.010 | 0.040 | 0.066 | * | 0.039 | ||
| constant | −0.431 | 0.355 | −0.897 | 0.209 | −0.117 | 0.255 | |||
| Pseudo R2 | 0.585 | 0.523 | 0.592 | ||||||
| Number of observations | 11,884 | 26,461 | 16,700 | ||||||
| Labour market participation Males | IE | IT | SE | ||||||
| (probit) | Coefficient | Robust SE | Coefficient | Robust SE | Coefficient | Robust SE | |||
| active (t-1) | 2.785 | *** | 0.081 | 1.937 | *** | 0.034 | 2.773 | *** | 0.102 |
| student (t-1) | 1.484 | *** | 0.177 | 1.105 | *** | 0.074 | 1.913 | *** | 0.180 |
| age | −0.029 | * | 0.017 | 0.051 | *** | 0.006 | 0.000 | 0.021 | |
| age squared | 0.000 | 0.000 | −0.001 | *** | 0.000 | 0.000 | 0.000 | ||
| education = Medium | 0.414 | *** | 0.086 | 0.185 | *** | 0.027 | 0.241 | *** | 0.087 |
| education = High | 0.647 | *** | 0.110 | 0.254 | *** | 0.043 | 0.455 | *** | 0.117 |
| regional dummies | yes | yes | yes | ||||||
| crisis (year>2008) | 0.001 | 0.074 | −0.046 | * | 0.027 | −0.082 | 0.077 | ||
| constant | −0.335 | 0.397 | −0.834 | *** | 0.137 | −0.276 | 0.474 | ||
| Pseudo R2 | 0.576 | 0.366 | 0.528 | ||||||
| Number of observations | 1,344 | 35,378 | 10,939 | ||||||
-
Notes: Population at risk: males aged 18–74 years who are not students nor retired.
Estimates of the probability of being employed, Labour market module.
| Employment | EL | ES | HU | ||||||
|---|---|---|---|---|---|---|---|---|---|
| (probit) | Coefficient | Robust SE | Coefficient | Robust SE | Coefficient | Robust SE | |||
| employed (t-1) | 1.848 | *** | 0.034 | 1.631 | *** | 0.020 | 1.397 | *** | 0.028 |
| student (t-1) | 0.681 | *** | 0.078 | 0.775 | *** | 0.046 | 0.314 | *** | 0.061 |
| gender = Female | −0.079 | *** | 0.028 | −0.015 | 0.016 | 0.122 | *** | 0.024 | |
| age | 0.041 | *** | 0.008 | 0.251 | *** | 0.005 | 0.016 | * | 0.008 |
| age squared | 0.000 | *** | 0.000 | 0.440 | ** | 0.000 | 0.000 | 0.000 | |
| education = Medium | 0.022 | 0.034 | 0.251 | *** | 0.021 | 0.527 | *** | 0.028 | |
| education = High | 0.288 | *** | 0.039 | 0.440 | *** | 0.020 | 0.989 | *** | 0.043 |
| regional dummies | yes | yes | yes | ||||||
| unemployment rate | −0.068 | *** | 0.004 | −0.035 | *** | 0.002 | −0.063 | *** | 0.009 |
| _cons | −0.558 | *** | 0.176 | −1.059 | *** | 0.103 | 0.031 | 0.177 | |
| Pseudo R2 | 0.331 | 0.283 | 0.265 | ||||||
| Number of observations | 20,224 | 45,505 | 27,057 | ||||||
| Employment | IE | IT | SE | ||||||
| (probit) | Coefficient | Robust SE | Coefficient | Robust SE | Coefficient | Robust SE | |||
| employed (t-1) | 1.811 | *** | 0.059 | 1.828 | *** | 0.021 | 1.660 | *** | 0.047 |
| student (t-1) | 1.202 | *** | 0.130 | 0.308 | *** | 0.040 | 0.491 | *** | 0.065 |
| gender = Female | 0.499 | *** | 0.055 | −0.095 | *** | 0.018 | 0.061 | * | 0.035 |
| age | 0.027 | * | 0.011 | 0.033 | *** | 0.005 | 0.048 | *** | 0.009 |
| age squared | 0.000 | 0.000 | 0.000 | ** | 0.000 | 0.000 | *** | 0.000 | |
| education = Medium | 0.403 | *** | 0.061 | 0.209 | *** | 0.019 | 0.315 | *** | 0.047 |
| education = High | 0.595 | *** | 0.064 | 0.393 | *** | 0.028 | 0.608 | *** | 0.057 |
| regional dummies | yes | yes | yes | ||||||
| unemployment rate | −0.077 | *** | 0.008 | −0.183 | *** | 0.011 | −0.094 | *** | 0.018 |
| _cons | −0.959 | *** | 0.254 | 0.335 | ** | 0.130 | −0.514 | ** | 0.223 |
| Pseudo R2 | 0.327 | 0.391 | 0.284 | ||||||
| Number of observations | 7,697 | 68,840 | 20,923 | ||||||
-
Notes: Population at risk: active people aged 18–74 years. Variables in blue are alignment variables.
Distribution of states for individuals aged 17.
| EL | ES | HU | IE | IT | SE | |
|---|---|---|---|---|---|---|
| Status | ||||||
| Pr(student) | 95.97 | 85.78 | 97.38 | 85.66 | 90.74 | 97.6 |
| Pr(active | not student) | 67.57 | 59.62 | 20.00 | 72.86 | 73.18 | 86.67 |
| Pr(employed | active) | 36.00 | 59.35 | 12.50 | 86.27 | 44.72 | 53.85 |
| Education level | ||||||
| Pr(education == Low) | 99.54 | 98.36 | 63.58 | 100.00 | 96.65 | 96.65 |
| Pr(education == Medium) | 0.46 | 1.64 | 36.42 | 0.00 | 3.35 | 3.35 |
| Pr(education == High) | 0.00 | 0.00 | 0.00 | 0.00 | 0.00 | 0.00 |
Evolution of the female population, 20–64 years age range, Sweden.
| Females aged 20–64 years (%) | ||||||
|---|---|---|---|---|---|---|
| High education | Low education | In union | Student | Active | Retired | |
| 2013 | 39.3 | 7.3 | 69.9 | 7.4 | 86.4 | 1.5 |
| 2020 | 38.8 | 7.3 | 69.6 | 7.6 | 88.3 | 1.5 |
| 2030 | 39.6 | 7.6 | 70.4 | 6.9 | 89.6 | 1.0 |
| 2040 | 41.1 | 7.8 | 71.7 | 7.5 | 89.4 | 0.5 |
| 2050 | 43.6 | 6.5 | 70.4 | 7.4 | 89.7 | 0.3 |
Evolution of the female population, 20–44 years age range, Sweden.
| Females aged 20–44 years (%) | ||||||
|---|---|---|---|---|---|---|
| In union | Children aged 0–3 | Children aged 0–12 | Student | Active | Retired | |
| 2013 | 68.7 | 22.2 | 50.4 | 13.3 | 84.2 | 0.0 |
| 2020 | 67.8 | 22.2 | 50.4 | 13.7 | 84.6 | 0.0 |
| 2030 | 68.6 | 21.8 | 49.1 | 12.1 | 86.1 | 0.0 |
| 2040 | 69.0 | 21.7 | 47.5 | 13.3 | 85.1 | 0.0 |
| 2050 | 68.3 | 22.0 | 48.8 | 12.9 | 85.6 | 0.0 |
Female participation rates, 20–44 years age range, Sweden.
| Females aged 20–44 years (students excluded): Participation rates (%) | ||||||||
|---|---|---|---|---|---|---|---|---|
| Without children aged 0–12 years | With children aged 0–12 years | |||||||
| Highest part. region | Lowest part. region | All | High education | Low education | All | High education | Low education | |
| (SE1) | (SE2) | |||||||
| 2013 | 97.7 | 96.5 | 97.1 | 98.3 | 95.0 | 97.0 | 99.0 | 93.5 |
| 2020 | 98.6 | 97.5 | 97.3 | 98.6 | 93.9 | 98.4 | 99.8 | 95.0 |
| 2030 | 98.6 | 97.5 | 97.8 | 97.8 | 96.6 | 97.9 | 99.5 | 94.4 |
| 2040 | 98.5 | 97.7 | 97.9 | 98.1 | 96.7 | 98.2 | 99.6 | 94.6 |
| 2050 | 98.7 | 98.1 | 98.0 | 98.3 | 96.3 | 98.4 | 99.5 | 95.0 |
Female participation rates, 55–64 years age range, Sweden.
| Females aged 55–64 years: Participation rates (%) | ||||
|---|---|---|---|---|
| Highest part. region (SE2) | Lowest part. region (SE1) | High education | Low education | |
| 2013 | 84.4 | 82.2 | 90.2 | 73.9 |
| 2020 | 88.2 | 88.0 | 90.9 | 78.3 |
| 2030 | 90.0 | 91.7 | 93.5 | 78.2 |
| 2040 | 91.5 | 94.1 | 94.5 | 85.4 |
| 2050 | 91.9 | 94.3 | 95.2 | 86.3 |
Evolution of the female population, 20–64 years age range, Italy.
| Females aged 20–64 years (%) | ||||||
|---|---|---|---|---|---|---|
| High education | Low education | In union | Student | Active | Retired | |
| 2013 | 16.8 | 36.0 | 61.8 | 6.6 | 59.0 | 4.7 |
| 2020 | 19.7 | 29.6 | 55.6 | 6.8 | 63.3 | 3.9 |
| 2030 | 23.0 | 25.6 | 48.8 | 7.2 | 64.7 | 3.8 |
| 2040 | 25.2 | 24.4 | 42.9 | 7.5 | 67.0 | 2.5 |
| 2050 | 25.5 | 24.7 | 40.4 | 7.3 | 68.8 | 1.6 |
Evolution of the female population, 20–44 years age range, Italy.
| Females aged 20–44 years (%) | ||||||
|---|---|---|---|---|---|---|
| In union | Children aged 0–3 | Children aged 0–12 | Student | Active | Retired | |
| 2013 | 52.2 | 15.8 | 42.7 | 12.5 | 64.7 | 0.0 |
| 2020 | 38.5 | 17.1 | 40.8 | 13.7 | 70.8 | 0.0 |
| 2030 | 27.7 | 17.6 | 40.9 | 14.5 | 71.2 | 0.0 |
| 2040 | 27.3 | 18.5 | 43.0 | 14.1 | 71.1 | 0.0 |
| 2050 | 27.8 | 18.8 | 44.7 | 13.6 | 72.1 | 0.0 |
Female participation rates, 20–44 years age range, Italy.
| Females aged 20–44 years (students excluded): Participation rates (%) | ||||||||
|---|---|---|---|---|---|---|---|---|
| Without children aged 0–12 years | With children aged 0–12 years | |||||||
| Highest part. region (ITH) | Lowest part. region (ITG) | All | High education | Low education | All | High education | Low education | |
| 2013 | 85.5 | 54.0 | 81.5 | 93.4 | 66.1 | 66.1 | 88.8 | 47.7 |
| 2020 | 91.3 | 65.5 | 83.8 | 94.8 | 67.6 | 80.0 | 93.2 | 64.0 |
| 2030 | 91.3 | 66.8 | 84.5 | 93.3 | 73.0 | 81.9 | 93.2 | 68.9 |
| 2040 | 90.1 | 67.1 | 83.8 | 94.5 | 73.2 | 81.8 | 94.3 | 71.3 |
| 2050 | 91.2 | 68.2 | 84.7 | 94.2 | 74.5 | 82.1 | 93.4 | 70.3 |
Female participation rates, 55–64 years age range, Italy.
| Females aged 55–64 years: Participation rates (%) | ||||
|---|---|---|---|---|
| Highest part. region (ITI) | Lowest part. region (ITG) | High education | Low education | |
| 2013 | 41.1 | 24.5 | 68.8 | 23.3 |
| 2020 | 43.5 | 25.4 | 65.2 | 27.6 |
| 2030 | 47.6 | 28.5 | 69.0 | 29.1 |
| 2040 | 55.8 | 30.3 | 71.4 | 28.1 |
| 2050 | 59.8 | 35.3 | 72.8 | 31.4 |
Evolution of the female population, 20–64 years age range, Spain.
| Females aged 20–64 years (%) | ||||||
|---|---|---|---|---|---|---|
| High education | Low education | In union | Student | Active | Retired | |
| 2013 | 32.3 | 38.1 | 63.9 | 6.1 | 70.9 | 2.3 |
| 2020 | 35.0 | 33.6 | 59.2 | 5.3 | 72.3 | 3.5 |
| 2030 | 35.8 | 29.6 | 52.1 | 6.6 | 71.8 | 2.6 |
| 2040 | 33.5 | 28.9 | 46.4 | 7.2 | 73.3 | 1.6 |
| 2050 | 34.3 | 29.2 | 43.2 | 6.9 | 75.5 | 0.5 |
Evolution of the female population, 20–44 years age range, Spain.
| Females aged 20–44 years (%) | ||||||
|---|---|---|---|---|---|---|
| In union | Children aged 0–3 | Children aged 0–12 | Student | Active | Retired | |
| 2013 | 55.5 | 15.4 | 41.4 | 10.7 | 76.8 | 0.0 |
| 2020 | 44.6 | 16.7 | 41.4 | 10.6 | 77.5 | 0.0 |
| 2030 | 29.5 | 15.6 | 36.6 | 14.6 | 73.8 | 0.0 |
| 2040 | 28.7 | 17.5 | 38.6 | 14.1 | 74.5 | 0.0 |
| 2050 | 30.8 | 18.3 | 42.2 | 12.1 | 76.5 | 0.0 |
Female participation rates, 20–44 years age range, Spain.
| Females aged 20–44 years (students excluded): Participation rates (%) | ||||||||
|---|---|---|---|---|---|---|---|---|
| Without children aged 0–12 years | With children aged 0–12 years | |||||||
| Highest part. region (ES3) | Lowest part. region (ES4) | All | High education | Low education | All | High education | Low education | |
| 2013 | 88.7 | 82.4 | 90.2 | 96.0 | 81.9 | 81.2 | 89.2 | 71.1 |
| 2020 | 89.6 | 81.9 | 90.4 | 97.5 | 82.8 | 82.2 | 90.9 | 69.5 |
| 2030 | 87.4 | 82.9 | 89.7 | 97.1 | 83.1 | 82.1 | 92.0 | 71.2 |
| 2040 | 87.4 | 84.1 | 90.3 | 97.2 | 83.4 | 82.3 | 92.0 | 73.4 |
| 2050 | 87.3 | 85.4 | 90.8 | 97.3 | 82.9 | 83.0 | 91.3 | 72.7 |
Female participation rates, 55–64 years age range, Spain.
| Females aged 55–64 years: Participation rates (%) | ||||
|---|---|---|---|---|
| Highest part. region (ES7) | Lowest part. region (ES1) | High education | Low education | |
| 2013 | 50.8 | 41.8 | 71.9 | 37.7 |
| 2020 | 52.5 | 44.3 | 72.8 | 38.5 |
| 2030 | 55.6 | 58.8 | 77.6 | 39.5 |
| 2040 | 66.3 | 57.1 | 78.2 | 43.7 |
| 2050 | 51.5 | 57.6 | 82.2 | 41.9 |
Evolution of the female population, 20–64 years age range, Greece.
| Females aged 20–64 years (%) | ||||||
|---|---|---|---|---|---|---|
| High education | Low education | In union | Student | Active | Retired | |
| 2013 | 28.0 | 24.7 | 67.7 | 6.3 | 62.4 | 9.1 |
| 2020 | 32.0 | 19.1 | 61.6 | 5.4 | 64.1 | 9.8 |
| 2030 | 35.1 | 13.5 | 53.9 | 5.9 | 67.1 | 7.1 |
| 2040 | 36.9 | 11.8 | 47.3 | 6.3 | 70.0 | 4.0 |
| 2050 | 37.4 | 12.0 | 43.9 | 6.4 | 73.0 | 1.6 |
Evolution of the female population, 20–44 years age range, Greece.
| Females aged 20–44 years (%) | ||||||
|---|---|---|---|---|---|---|
| In union | Children aged 0–3 | Children aged 0–12 | Student | Active | Retired | |
| 2013 | 56.0 | 14.6 | 41.1 | 11.3 | 71.7 | 0.2 |
| 2020 | 42.2 | 14.8 | 35.6 | 10.6 | 73.7 | 0.0 |
| 2030 | 29.4 | 14.9 | 32.4 | 12.4 | 74.3 | 0.0 |
| 2040 | 27.6 | 16.4 | 34.6 | 12.5 | 74.1 | 0.0 |
| 2050 | 29.0 | 16.3 | 36.2 | 11.8 | 74.6 | 0.0 |
Female participation rates, 20–44 years age range, Greece.
| Females aged 20–44 years (students excluded): Participation rates (%) | ||||||||
|---|---|---|---|---|---|---|---|---|
| Without children aged 0–12 years | With children aged 0–12 years | |||||||
| Highest part. region (EL4) | Lowest part. region (EL1) | All | High education | Low education | All | High education | Low education | |
| 2013 | 70.9 | 68.9 | 89.9 | 96.5 | 76.6 | 70.3 | 83.9 | 53.8 |
| 2020 | 76.6 | 71.4 | 88.1 | 94.5 | 78.7 | 73.7 | 84.7 | 51.5 |
| 2030 | 78.2 | 71.6 | 88.8 | 94.8 | 82.3 | 78.4 | 86.8 | 59.1 |
| 2040 | 80.8 | 70.4 | 89.0 | 95.2 | 84.4 | 78.1 | 86.2 | 60.3 |
| 2050 | 81.5 | 70.1 | 89.0 | 94.9 | 84.7 | 78.3 | 87.2 | 63.8 |
Female participation rates, 55–64 years age range, Greece.
| Females aged 55–64 years: Participation rates (%) | ||||
|---|---|---|---|---|
| Highest part. region (EL4) | Lowest part. region (EL2) | High education | Low education | |
| 2013 | 32.2 | 26.6 | 41.1 | 29.7 |
| 2020 | 36.0 | 34.8 | 53.7 | 26.5 |
| 2030 | 46.5 | 42.2 | 57.1 | 36.3 |
| 2040 | 51.4 | 50.0 | 70.6 | 37.9 |
| 2050 | 64.4 | 58.8 | 73.2 | 44.6 |
Evolution of the female population, 20–64 years age range, Hungary.
| Females aged 20–64 years (%) | ||||||
|---|---|---|---|---|---|---|
| High education | Low education | In union | Student | Active | Retired | |
| 2013 | 24.3 | 17.9 | 61.4 | 6.7 | 65.1 | 8.9 |
| 2020 | 26.8 | 16.1 | 51.6 | 7.4 | 66.8 | 5.9 |
| 2030 | 29.8 | 13.6 | 42.2 | 6.8 | 70.2 | 2.7 |
| 2040 | 31.9 | 11.4 | 35.9 | 6.8 | 71.3 | 1.6 |
| 2050 | 31.7 | 11.0 | 32.4 | 7.3 | 71.3 | 0.4 |
Evolution of the female population, 20–44 years age range, Hungary.
| Females aged 20–44 years (%) | ||||||
|---|---|---|---|---|---|---|
| In union | Children aged 0–3 | Children aged 0–12 | Student | Active | Retired | |
| 2013 | 56.3 | 13.6 | 44.2 | 12.2 | 66.2 | 0.0 |
| 2020 | 39.7 | 16.6 | 41.3 | 13.5 | 64.1 | 0.0 |
| 2030 | 24.5 | 18.4 | 43.2 | 13.5 | 63.3 | 0.0 |
| 2040 | 22.6 | 19.2 | 45.4 | 13.7 | 62.7 | 0.0 |
| 2050 | 23.1 | 19.5 | 46.5 | 14.0 | 62.1 | 0.0 |
Female participation rates, 20–44 years age range, Hungary.
| Females aged 20–44 years (students excluded): Participation rates (%) | ||||||||
|---|---|---|---|---|---|---|---|---|
| Without children aged 0–12 years | With children aged 0–12 years | |||||||
| Highest part. region (HU2) | Lowest part. region (HU3) | All | High education | Low education | All | High education | Low education | |
| 2013 | 78.9 | 73.6 | 92.4 | 97.8 | 74.6 | 58.7 | 64.1 | 44.5 |
| 2020 | 78.4 | 71.2 | 90.4 | 97.6 | 77.1 | 56.3 | 63.0 | 50.2 |
| 2030 | 76.4 | 71.3 | 90.5 | 97.1 | 78.9 | 55.7 | 64.0 | 47.7 |
| 2040 | 76.1 | 70.7 | 90.1 | 97.0 | 79.8 | 56.8 | 64.7 | 52.3 |
| 2050 | 76.8 | 70.1 | 90.5 | 96.8 | 75.6 | 56.6 | 63.7 | 46.7 |
Female participation rates, 55–64 years age range, Hungary.
| Females aged 55–64 years: Participation rates (%) | ||||
|---|---|---|---|---|
| Highest part. region (HU1) | Lowest part. region (HU2) | High education | Low education | |
| 2013 | 48.8 | 44.2 | 59.2 | 31.0 |
| 2020 | 60.6 | 54.7 | 71.3 | 35.2 |
| 2030 | 74.8 | 66.4 | 83.6 | 44.1 |
| 2040 | 78.3 | 70.9 | 86.8 | 48.8 |
| 2050 | 83.9 | 75.9 | 90.6 | 51.4 |
Evolution of the female population, 20–64 years age range, Ireland.
| Females aged 20–64 years (%) | ||||||
|---|---|---|---|---|---|---|
| High education | Low education | In union | Student | Active | Retired | |
| 2013 | 35.9 | 23.8 | 59.2 | 5.4 | 62.8 | 2.3 |
| 2020 | 37.5 | 21.0 | 60.5 | 5.2 | 69.5 | 3.6 |
| 2030 | 37.3 | 20.8 | 66.0 | 6.8 | 69.6 | 2.5 |
| 2040 | 35.3 | 21.8 | 64.1 | 7.8 | 69.6 | 1.4 |
| 2050 | 37.0 | 21.7 | 63.4 | 6.8 | 72.0 | 0.5 |
Evolution of the female population, 20–44 years age range, Ireland.
| Females aged 20–44 years (%) | ||||||
|---|---|---|---|---|---|---|
| In union | Children aged 0–3 | Children aged 0–12 | Student | Active | Retired | |
| 2013 | 52.4 | 20.9 | 52.0 | 8.8 | 68.1 | 0.0 |
| 2020 | 53.8 | 22.8 | 45.2 | 9.3 | 74.4 | 0.0 |
| 2030 | 55.8 | 19.9 | 36.4 | 13.5 | 69.3 | 0.0 |
| 2040 | 53.2 | 21.7 | 37.8 | 13.5 | 68.9 | 0.0 |
| 2050 | 53.2 | 22.9 | 41.8 | 10.7 | 73.6 | 0.0 |
Female participation rates, 20–44 years age range, Ireland.
| Females aged 20–44 years (students excluded): Participation rates (%) | ||||||||
|---|---|---|---|---|---|---|---|---|
| Without children aged 0–12 years | With children aged 0–12 years | |||||||
| All | All | High education | Low education | All | High education | Low education | ||
| 2013 | 74.7 | 89.3 | 95.3 | 73.3 | 63.7 | 78.6 | 42.1 | |
| 2020 | 82.0 | 85.4 | 94.4 | 66.9 | 78.6 | 85.5 | 60.1 | |
| 2030 | 80.1 | 82.4 | 93.6 | 68.8 | 77.0 | 85.4 | 60.9 | |
| 2040 | 79.6 | 82.1 | 93.7 | 70.1 | 76.4 | 87.0 | 61.6 | |
| 2050 | 82.4 | 86.2 | 93.7 | 71.4 | 78.2 | 86.4 | 62.2 | |
Female participation rates, 55–64 years age range, Ireland.
| Females aged 55–64 years: Participation rates (%) | |||
|---|---|---|---|
| All* | High education | Low education | |
| 2013 | 41.1 | 72.7 | 23.1 |
| 2020 | 49.9 | 69.8 | 29.6 |
| 2030 | 60.9 | 78.3 | 35.4 |
| 2040 | 67.0 | 78.9 | 37.8 |
| 2050 | 64.8 | 79.6 | 37.8 |
-
Notes:
-
*
Ireland has a single NUTS 1 region.