
This article contains 9 figures.
Figures
Software reviews · Aug 31, 2018
Partnership for Economic Policy (PEP), Université Laval, Canada; CEDLAS-UNLP and Partnership for Economic Policy (PEP), Argentina; Partnership for Economic Policy (PEP), Kenya
Cite as: L. Tiberti, M. Cicowiez, J. Cockburn; 2018; A top-down with behaviour (TDB) microsimulation toolkit for distributive analysis; International Journal of Microsimulation; 11(2); 191–213. doi: 10.34196/ijm.00185
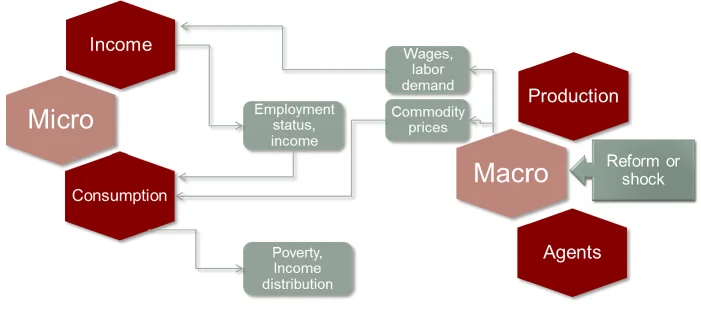
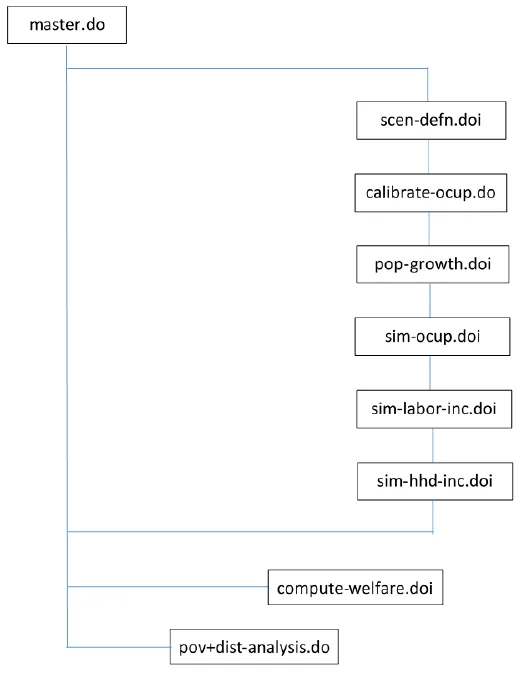
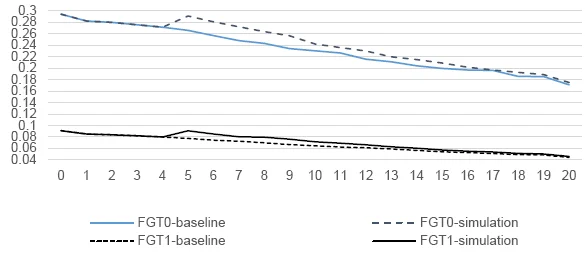
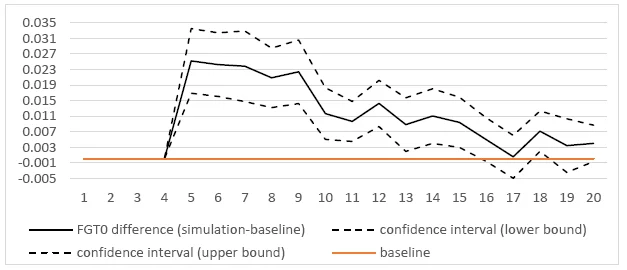
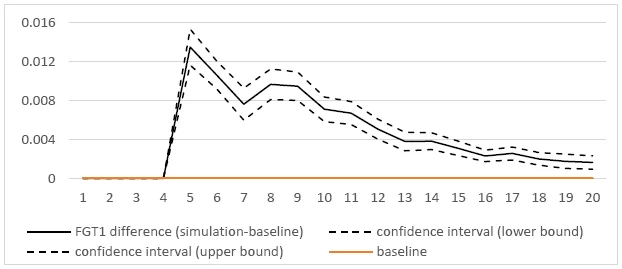
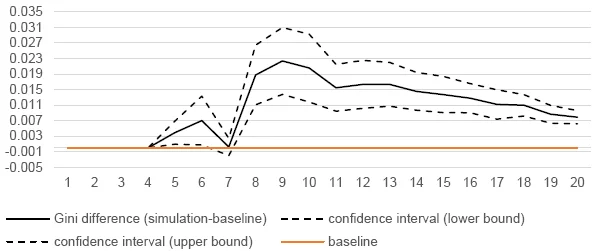
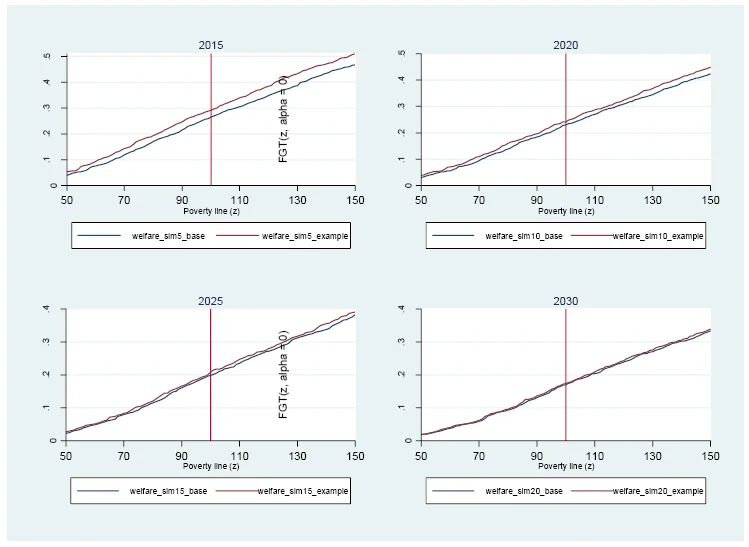
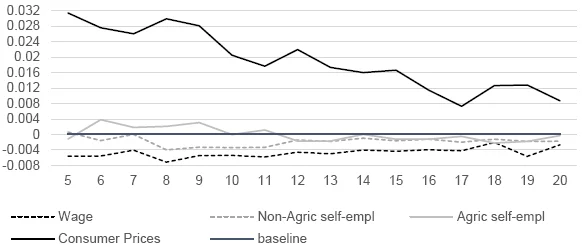
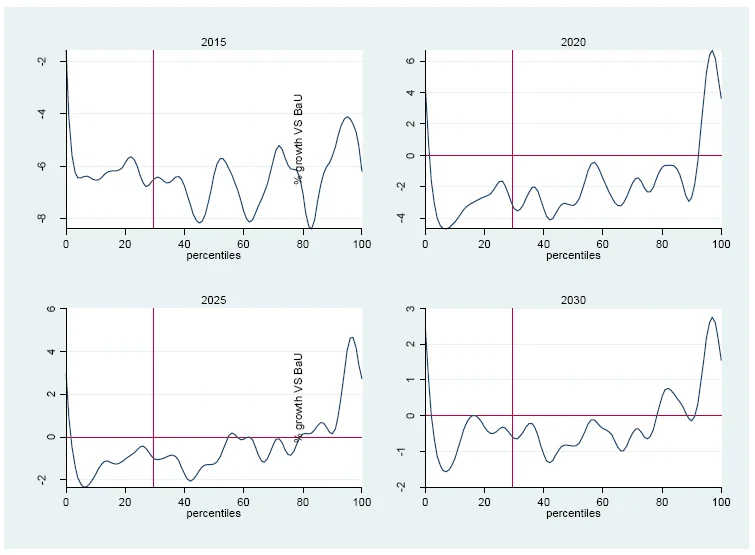
Computable General Equilibrium (CGE) models are often combined with microsimulation (MS) models to perform distributive impact analysis for fiscal or structural policies, or external shocks. This paper describes a user-friendly Stata-based toolkit to perform MSs combined with CGE models in a top-down fashion. The toolkit is organized in various modules, which can be easily adapted to the users’ needs. It first estimates income generation by type of work and skill of workers. Then it estimates households’ specific price deflators based on individual utility. The changes estimated by a CGE model (or from other sources) in the employment (by skill and sector), in the wage payroll (by skill), in the revenues from self-employment activities (by skill) as well as in the commodities prices are fed into the MS model in a consistent way. Once the new vector of real consumption or revenue is estimated, it performs a series of distributive analysis, such as the computation of standard poverty and inequality indices, their decomposition by income factor, robustness analysis and growth incidence curves, and compare the baseline with the simulation results. This makes it possible to run standard poverty and distributive analyses, and to see whether a given shock or policy has had some impact on household welfare and who are the most affected households. Based on such information, social protection policies can be accurately designed in order to minimise the, for example, negative effects of a given shock in a cost-effective manner. An illustrative analysis is run on data from Uganda.
This article contains 9 figures.