Developing a microsimulation model for farm forestry planting decisions
- Teagasc, Rural Economy & Development Programme, Ireland
- National University of Ireland, Ireland
Figures

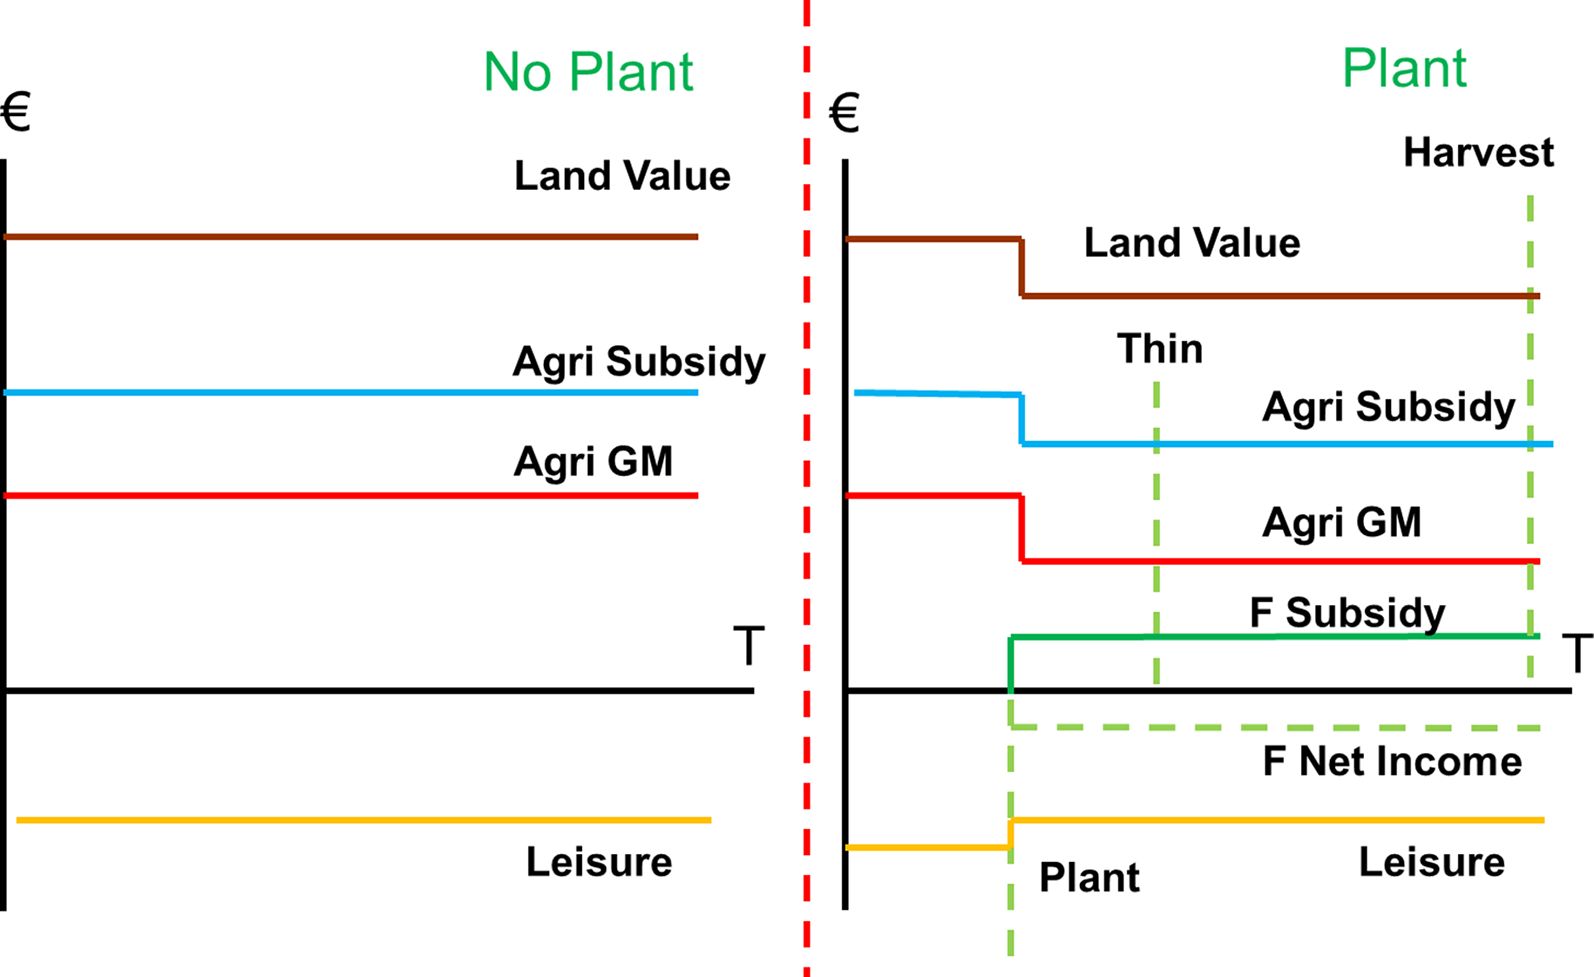
Timelines of financial, policy and leisure components of the utility associated with the land use change from agriculture to forestry
Source: Ryan et al. (2015).
Note: Agri GM = Agricultural Gross Margin = Agri Market Income – Agri Costs.

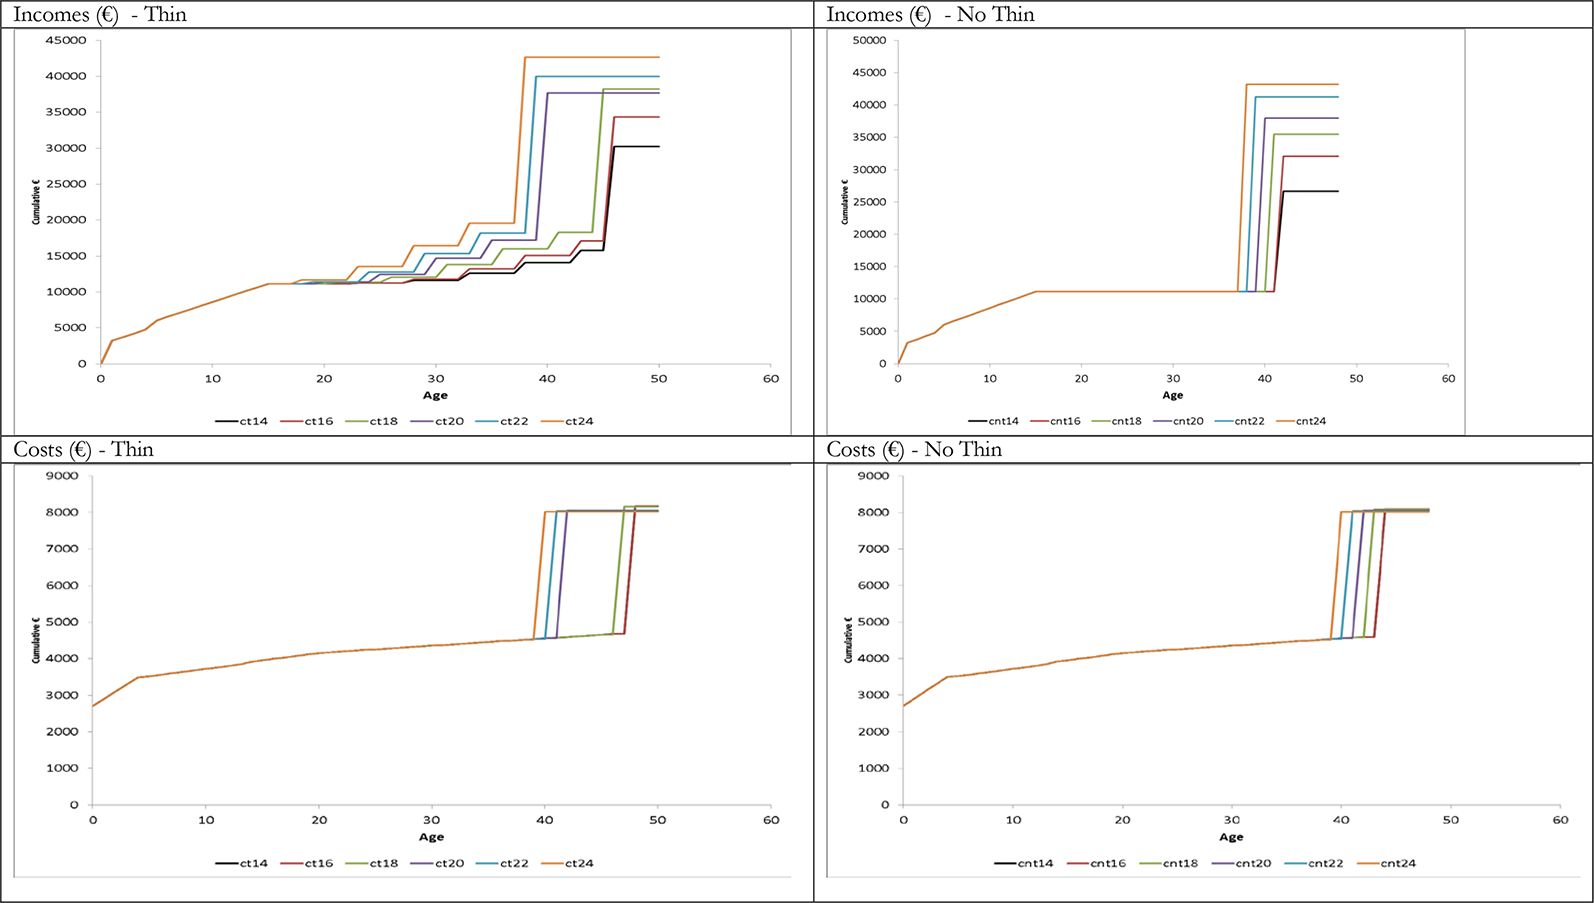
Life-Cycle Pattern of Incomes and Costs by yield class over 1 rotation (2015) for conifer thin (ct) and conifer no thin (cnt) options
Tables
Impact of planting on income, land and labour
| Proportional change in | |||||
|---|---|---|---|---|---|
| Market income | Gross margin | Net margin | Land value | Hours worked | |
| No Forest | −0.1953 | −0.1397 | −0.25 | −0.051 | −0.034 |
| Has Forest | −0.1948 | −0.11396 | −0.246 | −0.034 | −0.033 |
Proportion of Farms where the Forestry AE is greater than Agriculture AE
| Classification | Market income | Gross margin | Net margin |
|---|---|---|---|
| Has Forestry | |||
| 0 | 0.527 | 0.298 | 0.596 |
| 1 | 0.629 | 0.454 | 0.703 |
| Never Plant | |||
| 0 | 0.633 | 0.387 | 0.658 |
| 1 | 0.538 | 0.303 | 0.616 |
-
Source: Teagasc National Farm Survey 2012–2015 and Teagasc ForBES/ForSubs Models.
Components of Income 2012–2015 by relative AE
| Forest mkt income per Ha | Forest subs income per Ha | Farm income per Ha | Farm subsidy per Ha | Overhead cost per Ha | Difference MI | Difference GM | Difference NM | |||
|---|---|---|---|---|---|---|---|---|---|---|
| For > Ag* | Has forest | |||||||||
| A | 0 | 0 | 490 | 329 | 1,827 | 415 | 876 | −1008 | −1423 | −547 |
| 0 | 1 | 494 | 329 | 1,651 | 400 | 803 | −828 | −1228 | −426 | |
| B | 1 | 0 | 475 | 329 | 369 | 390 | 419 | 435 | 44 | 463 |
| 1 | 1 | 470 | 328 | 270 | 389 | 386 | 528 | 139 | 525 |
-
*
Farms where potential forestry income is greater than or equal to potential agricultural income
Deciles of gap between forest and agriculture (Market Income)
| Has forest | Never plant | |
|---|---|---|
| 1 | 0.073 | 0.924 |
| 2 | 0.153 | 0.854 |
| 3 | 0.168 | 0.877 |
| 4 | 0.163 | 0.883 |
| 5 | 0.136 | 0.820 |
| 6 | 0.118 | 0.824 |
| 7 | 0.189 | 0.853 |
| 8 | 0.172 | 0.849 |
| 9 | 0.238 | 0.799 |
| 10 | 0.319 | 0.798 |
Deciles of forest–agriculture gap (Has Forest) by income definition
| Decile | Market income | Gross margin | Net margin |
|---|---|---|---|
| 1 | 0.073 | 0.065 | 0.091 |
| 2 | 0.153 | 0.180 | 0.135 |
| 3 | 0.168 | 0.157 | 0.161 |
| 4 | 0.163 | 0.138 | 0.154 |
| 5 | 0.136 | 0.132 | 0.117 |
| 6 | 0.118 | 0.176 | 0.179 |
| 7 | 0.189 | 0.150 | 0.206 |
| 8 | 0.172 | 0.247 | 0.227 |
| 9 | 0.238 | 0.208 | 0.242 |
| 10 | 0.319 | 0.276 | 0.211 |
| Total | 0.172 | 0.172 | 0.172 |
Income characteristics by decile of forest-agriculture gap (Market Income)
| No forestry | Forestry income per Ha | Farm income per Ha | Farm subsidy per Ha | Overhead cost per Ha | Difference MI | Difference GM | Difference NM |
|---|---|---|---|---|---|---|---|
| 1 | 825 | 2,974 | 407 | 1,176 | −2149 | −2555 | −1379 |
| 2 | 820 | 2030 | 386 | 970 | −1210 | −1595 | −625 |
| 3 | 819 | 1,550 | 409 | 808 | −731 | −1140 | −332 |
| 4 | 816 | 1,142 | 439 | 662 | −326 | −765 | −103 |
| 5 | 813 | 820 | 451 | 582 | −7 | −459 | 124 |
| 6 | 816 | 604 | 419 | 505 | 212 | −207 | 298 |
| 7 | 806 | 457 | 408 | 438 | 349 | −59 | 379 |
| 8 | 803 | 321 | 371 | 403 | 483 | 112 | 515 |
| 9 | 792 | 186 | 349 | 334 | 605 | 256 | 590 |
| 10 | 794 | −13 | 362 | 314 | 807 | 446 | 759 |
| 810.39 | 1007.02 | 400.04 | 619.04 | −197 | −597 | 22 | |
| Has Forestry | |||||||
| 1 | 821 | 2,876 | 403 | 1,120 | −2055 | −2458 | −1339 |
| 2 | 823 | 2083 | 389 | 942 | −1260 | −1648 | −707 |
| 3 | 825 | 1,574 | 371 | 777 | −749 | −1121 | −344 |
| 4 | 820 | 1,163 | 434 | 689 | −342 | −777 | −88 |
| 5 | 822 | 823 | 420 | 574 | −1 | −420 | 154 |
| 6 | 802 | 577 | 435 | 487 | 225 | −210 | 277 |
| 7 | 808 | 468 | 378 | 400 | 340 | −39 | 362 |
| 8 | 805 | 333 | 389 | 448 | 473 | 84 | 532 |
| 9 | 799 | 190 | 382 | 345 | 609 | 228 | 573 |
| 10 | 781 | −19 | 374 | 292 | 800 | 425 | 717 |
| 810.67 | 1006.78 | 397.50 | 607.30 | −196.10 | −593.61 | 13.69 | |
Farm/farmer characteristics by decile of forest-agriculture gap (Market Income)
| Decile | Family farm income per Ha | Dairy cows per Ha | Labour units | Age | Farm size | Teagasc | Has reps | Has off farm income | Best soil type |
|---|---|---|---|---|---|---|---|---|---|
| No Forestry | |||||||||
| 1 | 1,652 | 2.36 | 1.39 | 50 | 57 | 0.75 | 0.25 | 0.51 | 0.72 |
| 2 | 1,085 | 1.88 | 1.42 | 53 | 71 | 0.72 | 0.15 | 0.45 | 0.65 |
| 3 | 880 | 1.48 | 1.36 | 54 | 67 | 0.68 | 0.27 | 0.52 | 0.65 |
| 4 | 717 | 0.73 | 1.28 | 57 | 66 | 0.63 | 0.22 | 0.57 | 0.61 |
| 5 | 548 | 0.24 | 1.18 | 56 | 56 | 0.57 | 0.24 | 0.68 | 0.57 |
| 6 | 419 | 0.15 | 1.14 | 58 | 54 | 0.56 | 0.15 | 0.64 | 0.62 |
| 7 | 357 | 0.05 | 1.08 | 58 | 53 | 0.54 | 0.14 | 0.65 | 0.52 |
| 8 | 239 | 0.04 | 1.06 | 58 | 46 | 0.45 | 0.18 | 0.62 | 0.48 |
| 9 | 174 | 0.01 | 1.01 | 58 | 48 | 0.45 | 0.20 | 0.67 | 0.38 |
| 10 | 51 | 0.03 | 1.11 | 60 | 87 | 0.36 | 0.09 | 0.67 | 0.41 |
| 612.13 | 0.70 | 1.20 | 56.22 | 60.49 | 0.57 | 0.19 | 0.60 | 0.56 | |
| Has Forestry | |||||||||
| 1 | 51 | 0.03 | 1.11 | 60 | 87 | 0.36 | 0.09 | 0.67 | 0.41 |
| 2 | 1,629 | 2.39 | 1.37 | 51 | 61 | 0.82 | 0.11 | 0.66 | 0.64 |
| 3 | 1,157 | 1.98 | 1.49 | 53 | 78 | 0.70 | 0.14 | 0.52 | 0.67 |
| 4 | 929 | 1.48 | 1.41 | 53 | 84 | 0.72 | 0.18 | 0.56 | 0.71 |
| 5 | 724 | 1.01 | 1.50 | 55 | 89 | 0.57 | 0.40 | 0.55 | 0.65 |
| 6 | 546 | 0.53 | 1.52 | 55 | 74 | 0.78 | 0.30 | 0.45 | 0.68 |
| 7 | 462 | 0.14 | 1.23 | 55 | 70 | 0.62 | 0.28 | 0.56 | 0.44 |
| 8 | 403 | 0.04 | 1.02 | 56 | 52 | 0.69 | 0.16 | 0.77 | 0.49 |
| 9 | 255 | 0.09 | 1.02 | 54 | 68 | 0.71 | 0.15 | 0.67 | 0.49 |
| 10 | 270 | 0.01 | 1.15 | 56 | 67 | 0.69 | 0.24 | 0.75 | 0.44 |
| 642.51 | 0.77 | 1.28 | 54.84 | 72.85 | 0.67 | 0.21 | 0.61 | 0.56 | |
Teagasc ForBES Model : Detailed Cost assumptions
| SS (€/ha) | Ash (€/ha) | |||
|---|---|---|---|---|
| Forest establishment | % of costs covered by Afforestation Grant dependent on year of planting | Allocated to Year 0 | 2,860 | 4,280 |
| Forest maintenance up to end year 4 | Costs covered by Maintenance Grant | Payment allocated equally over years 1,2,3 & 4 | 790 | 1,155 |
| Annual management cost | Incurred annually | 20 | 20 | |
| Insurance | Initial payment in year 5 – runs to year 20 | Recurring annually | 20 | 20 |
| Brash/inspection paths | One-off cost of cutting inspection paths through conifers Not relevant for ash | Incurred in year 14 | 35 | 0 |
| Second fertiliser | Relevant only for unenclosed sites with additional nutrient requirements | Not relevant for SS-GPC3 or for ash | ||
| Cost of Sales | % reduction in revenue | Lower in high value sites | Clearfell –12% | Clearfell – 12% |
| Road costs | Only applicable if thinning | Not necessary in many small farm forests | Assume that road grant covers cost | 0 |
| Harvest losses | Timber losses due to difficult site conditions | Binary – Yes/No | 1st Th: 14%
2nd TH: 12% 3rd /sub TH: 8% C/fell: 5% |
|
| Reforestation | Cost of replanting with same species post clearfell | May be allocated to first or second rotation | 3,500 | 0 |
Model Estimates, On-Farm Hours and Land Value per hectare10
| Logged (On-Farm Hours Worked) | Logged (Land Value per ha) | |||
|---|---|---|---|---|
| Variables | Coefficient | SE | Coefficient | SE |
| New forest planting | −0.0351*** | −1.72 | −0.0529* | 0.0293 |
| Land Value (lagged : t-1)/ha | −0.0299*** | −6.35 | 0.0075*** | 0.0008 |
| Farm Size | 0.0009*** | 6.21 | −0.0071*** | 0.0002 |
| Farm Size Squared | −0.000001*** | −4.24 | *** | 0 |
| Age | −0.0053*** | −24.76 | ||
| Age Squared | −0.000003*** | −19.03 | ||
| Has Off Farm Employment | −0.1731a | −32.25 | ||
| Spouse Has Off Farm Employment | 0.019** | 3.35 | ||
| Share of Tillage Area | −0.0966*** | −4.08 | 0.1257*** | 0.0331 |
| Share of Dairy Forage | 0.2241 | 11.12 | −0.0658** | 0.0286 |
| Share of Sheep Forage | 0.049* | 2.91 | −0.0782a | 0.0242 |
| Sheep Number of Livestock Units per ha | 0.0049** | 1.82 | 0.001 | 0.0041 |
| Cattle Number of Livestock Units per ha | 0.0294** | 6.89 | 0.0313*** | 0.0066 |
| Dairy Number of Livestock Units per ha | 0.001** | 0.16 | 0.0435*** | 0.0089 |
| Teagasc Client | −0.01*** | −2.22 | ||
| Has REPS payment | 0.0133** | 2.46 | ||
| Unpaid labour | 0.4188 | 66.04 | ||
| Good soil | 0.463*** | 0.0246 | 0.0455* | 2.66 |
| Medium soil | 0.2435*** | 0.0243 | 0.0352* | 2.11 |
| Constant | −0.4719*** | 0.0197 | 7.1293 | 3.65 |
| Share of Variance due to Fixed Effect | 0.58 | 0.69 | ||
| R2 | 0.3309 | 0.3021 | ||
| N | 29,567 | 27,219 | ||
-
Note: Regional, Soil and Year dummies ignored.
-
***significant at 1% level;* significant at 10% level
Data and code availability
The data used in this model are partially publicly available, accessible through the Irish Social Science Data Archive (https://www.ucd.ie/issda/data/teagascnationalfarmsurveyteagascnationalfarmsurvey/); partially available for scientific research only upon registration with Teagasc Rural Economy and Development Programme (contact Brian.Moran@teagasc.ie).
The paper is model-based. The code is based upon a number of programmes, coded in Stata. The authors are willing to share the code, but advise that given the complexity, the multi-disciplinary nature of the code and its length (1000+ lines of code), it is likely to be challenging for someone to use it without assistance.