Spatial microsimulation of osteoarthritis prevalence at the small area level in England – Constraint selection for a 2-stage microsimulation process
- Centre for Sports, Exercise and Osteoarthritis, Versus Arthritis, United Kingdom
- Queens Medical Centre, University of Nottingham, United Kingdom
Figures

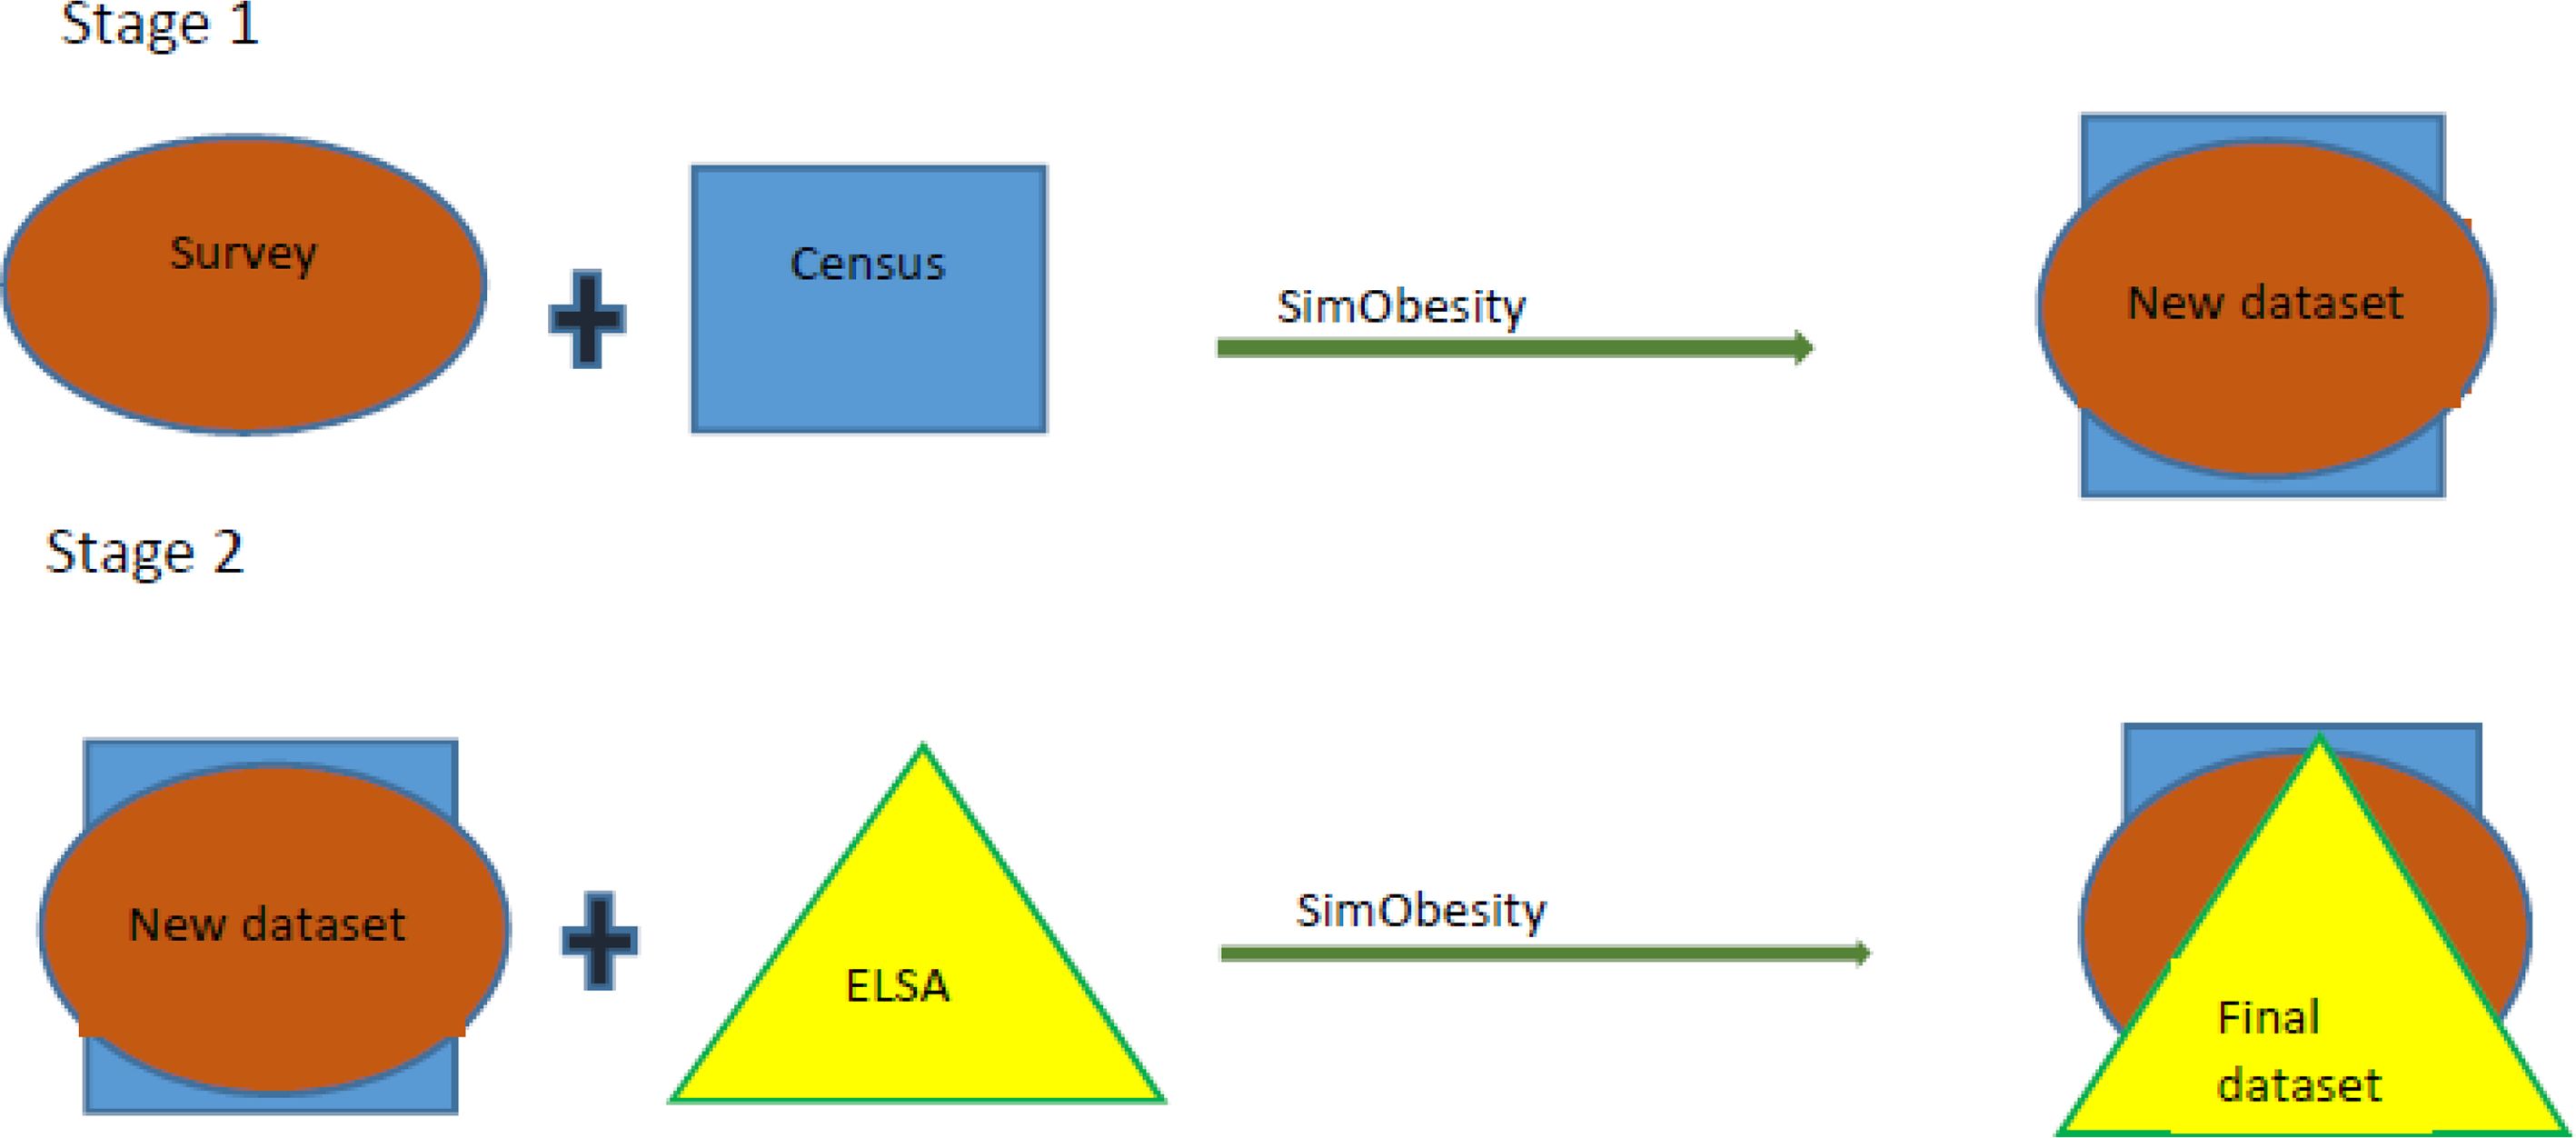
2-stage Spatial Microsimulation

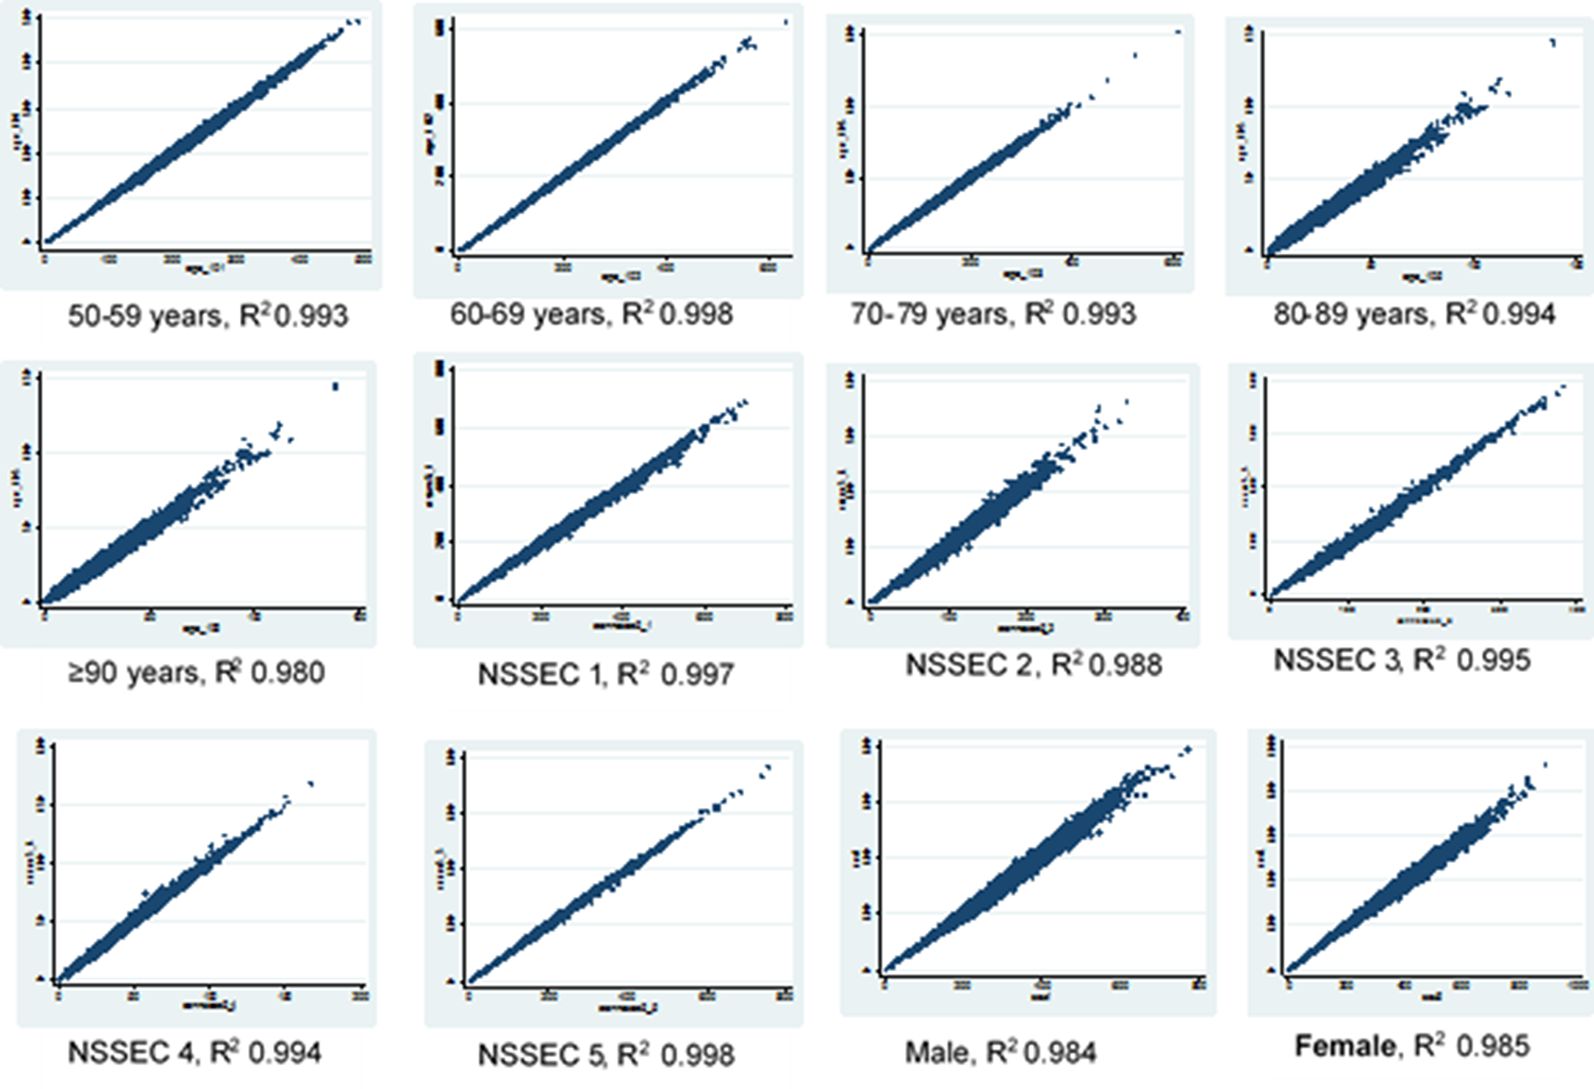
Scatter plots for age, sex and NSSEC categories, simulated counts from the hybrid dataset versus census totals

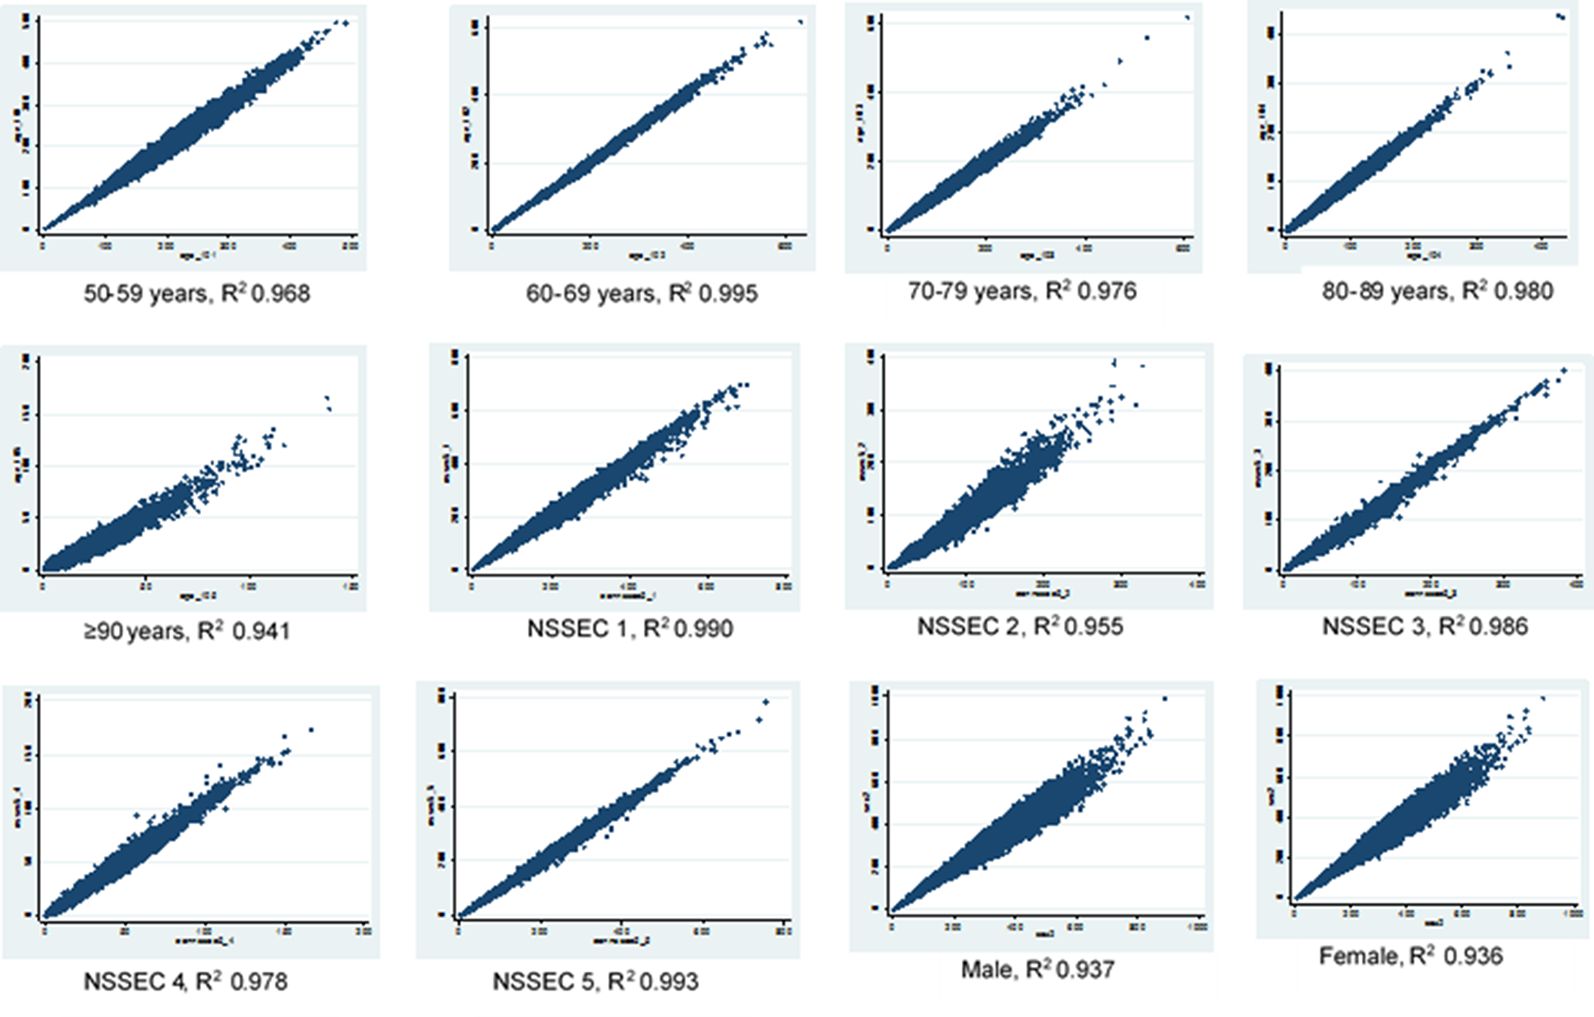
Scatter plots for age, sex and NSSEC categories, simulated counts from the final dataset versus census

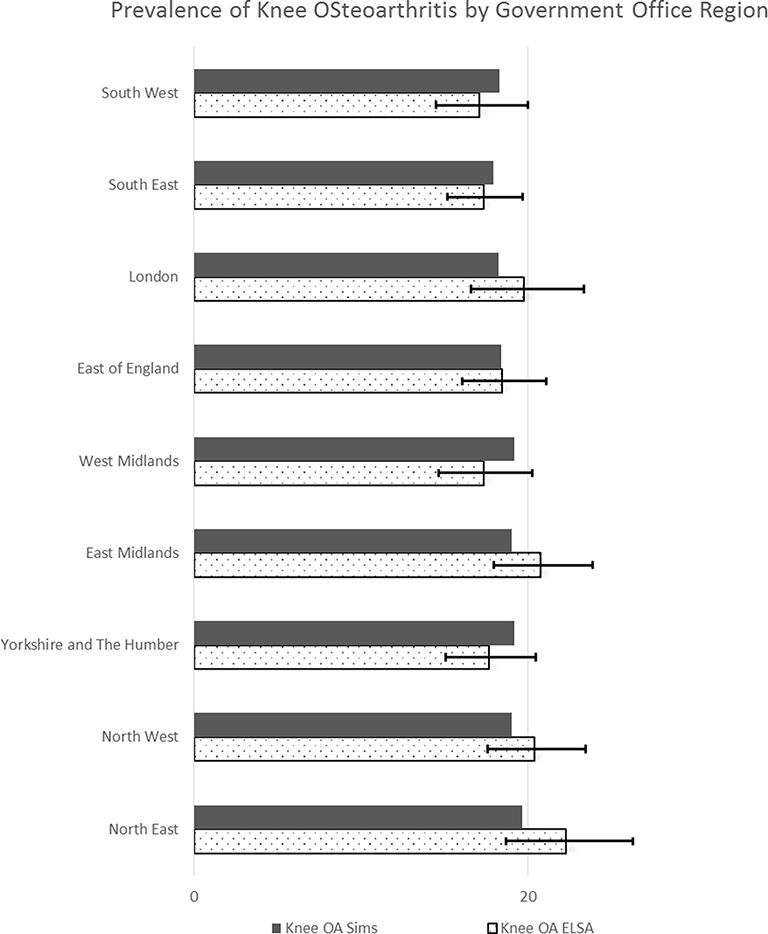
Comparing regional aggregates of our simulated synthetic microdata data with ELSA data (grouped by regions)
Tables
Names and categories of covariates used in our analyses
| Variable | Categories |
|---|---|
| Age | 50–59 years, 60–69 years, 70–79 years, 80–89 years, ≥90 years |
| Sex | Male, Female |
| *Ethnicity | White, Non-White |
| Health | Good, Fair, Poor |
| BMI | Underweight, Overweight & Obese |
| *NSSEC | Higher managerial & professional, Lower-professional, Intermediate Occupations, Lower supervisory & technical, Semi routine, routine & other. |
| Marital Status | Single, Married, Separated, Divorced, Widowed |
| Level of Education | NVQ4&5, Higher Education below Degree, NVQ3, NVQ2, NVQ1 |
| Smoking history | Never smoker, Ex-smoker, Current smoker |
| Alcohol | Never, once or twice a year, Every couple of Months, Once or twice a month, Once or twice a week, Every other day, Everyday |
| Fruit & Vegetable Consumption/week | Less than 5 portions, Greater than 5 portions |
-
*
Categorised to match ELSA.
Frequency distribution of variables in geographical (census) and survey (HSE and ELSA) datasets
| Variables/categories | ELSA, n (%) | HSE, n (%) | Census LSOA, n (%) | |
|---|---|---|---|---|
| Age | 50–59 years | 2,062 (22.49) | 4,901 (32.67) | 6,397,087 (35.09) |
| 60–69 years | 3,451 (37.64) | 4,018 (32.09) | 5,680,431 (31.16) | |
| 70–79 years | 2,444 (26.66) | 2,837(22.66) | 3,713,474 (20.37) | |
| 80–89 years | 1,005 (10.96) | 1,383 (11.05) | 2,032,084 (11.16) | |
| ≥90 years | 207 (2.26) | 192 (1.53) | 403,817 (2.22) | |
| Sex | Female | 5,096 (55.58) | 6,756 (53.96) | 9,658,440 (52.98) |
| Male | 4,073 (44.42) | 5,765 (46.04) | 8,571,453 (47.02) | |
| *Marital | Single, Cohabitees | 603 (6.58) | 1,425 (11.39) | 1,464,682 (8.03) |
| Married, Civil partnerships | 5,872 (64.06) | 7,726 (61.73) | 11,167,413 (61.26) | |
| Separated | 25 (0.27) | 271 (2.17) | 420,140 (2.31) | |
| Divorced | 1,070 (11.67) | 1,268 (10.13) | 2,306,990 (12.65) | |
| Widowed | 1,597 (17.42) | 1,826 (14.59) | 2,870,668 (15.75) | |
| *Ethnicity | White | 8,845 (96.49) | 11,792 (94.54) | 17,027,207 (93.40) |
| Non-white | 322 (3.51) | 681 (5.46) | 1,202,686 (6.60) | |
| *NSSEC | Higher Managerial & Professional | 3,167 (34.74) | 3,982 (32.36) | 5,475,646 (30.04) |
| Lower Managerial | 1,249 (13.70) | 1,922 (15.57) | 2,624,312 (14.40) | |
| Intermediate Occupations | 1,059 (11.62) | 1,298 (10.52) | 2,080,200 (11.41) | |
| Lower supervisory & Technical | 846 (9.28) | 937 (7.59) | 1,457,493(7.99) | |
| Semi routine, routine & others | 2,794 (30.65) | 4,204 (34.06) | 6,592,242(36.16) | |
| *Education | NVQ 4 & 5 | 1,551 (17.06) | 2,191 (17.50) | 6,965,766 (38.21) |
| Higher Education, below Degree | 1,268 (13.94) | 1,459 (11.65) | 1,773,428 (9.73) | |
| NVQ3 | 752 (8.27) | 1,173 (9.37) | 1,930,079 (10.59) | |
| NVQ2 | 1,703 (18.73) | 2,336 (18.66) | 991,560 (5.44) | |
| NVQ1 | 366 (4.03) | 514 (4.11) | 1,254,681 (6.88) | |
| Foreign/Other | 1,043 (11.47) | 353 (2.82) | 4,180,862 (22.93) | |
| No Qualification | 2,410 (26.50) | 4,444 (35.49) | 1,133,517 (6.22) | |
| Health | Excellent, good | 6,330 (72.10) | 8,010 (63.97) | 11,213,005 (61.51) |
| Fair | 1,729 (19.69) | 3,079 (24.59) | 4,856,203 (26.64) | |
| Poor | 720 (8.20) | 1,425 (11.38) | 2,160,685 (11.85) | |
| *Smoke | Never smoker | 3,275 (36.73) | 5,777 (46.14) | – |
| Ex-smoker | 4,790 (52.25) | 4,910 (39.21) | – | |
| Current Smoker | 1,102 (12.02) | 1,802 (14.39) | – | |
| *BMI | Underweight | 69 (0.93) | 85 (0.82) | – |
| Normal | 1,958 (26.52) | 2,761 (26.58) | – | |
| Overweight | 3,029 (41.03) | 4,380 (42.16) | – | |
| Obese | 2,327 (31.52) | 3,163 (30.45) | – | |
| Knee Osteoarthritis | Yes | 1,728 (18.85) | – | – |
| No | 7,441 (81.15) | – | – | |
| TOTAL | 9,169 (100) | 12,521 (100) | 18,229,893 (100) | |
-
*
Variables with missing data in HSE & ELSA.
ELSA Univariate and Multivariate Logistic Regression Analysis – F test and P values
| Variables | Univariate | Final model | ||
|---|---|---|---|---|
| F - test | P value | F -test | P value | |
| *Age | 3.01 | 0.0172 | 0.43 | 0.9038 |
| Sex | 22.74 | <0.0001 | 20.67 | <0.0001 |
| NSSEC | 19.54 | <0.0001 | 6.15 | 0.0001 |
| Health | 174.26 | <0.0001 | 54.06 | <0.0001 |
| BMI | 47.93 | <0.0001 | 24.81 | <0.0001 |
| †Illness | 234 | <0.0001 | 76.7 | <0.0001 |
| Marital | 1.98 | 0.0953 | ||
| Ethnicity | 1.85 | 0.1741 | ||
| Education | 5,847 | <0.001 | ||
| Smoke | 5.85 | 0.0029 | ||
| Alcohol | 14.14 | <0.0001 | ||
| Fruit & Vegetable consumption | 3.94 | 0.0196 | ||
-
*
Not significant but included in the final model.
-
†
Found to be defined differently in the census and was subsequently dropped from analysis.
ELSA Goodness of fit test
| Model parameters | Archer-Lemenshow GOF values |
|---|---|
| Age,Sex, NSSEC, Illness, Health, BMI | 0.3374 |
| Age, Sex, NSSEC, Health, BMI | 0.4861 |
| Age, Sex, Health, BMI | 0.1147 |
| Age, Sex, BMI | 0.6283 |
| Age, Sex, NSSEC | 0.6708 |
| Age, Sex,Health | 0.7564 |
| Age, NSSEC | 0.3453 |
| Age, Sex, NSSEC, BMI | 0.9742 |
| Age,Sex | 0.5680 |
HSE Univariate and Multivariate Multinomial Regression Analysis – F test and P values
| Variables | Univariate | Final model | ||
|---|---|---|---|---|
| F - test | P value | F -test | P value | |
| Age | 2.88 | <0.0001 | 8.87 | <0.0001 |
| Sex | 41.49 | <0.0001 | 35.73 | <0.0001 |
| NSSEC | 7.22 | <0.0001 | 1.98 | 0.0139 |
| Health | 35.24 | <0.0001 | 28.75 | <0.0001 |
| Marital | 13.87 | <0.0001 | 28.89 | <0.0001 |
| Ethnicity | 3046.85 | <0.0001 | 1236.81 | <0.0001 |
| Education | 5.7 | <0.0001 | 2.29 | 0.0016 |
| Smoke | 12.54 | <0.0001 | 14.63 | <0.0001 |
| Fruit & Vegetable consumption | 1.06 | 0.3843 | ||
Frequency distribution of variables in Original and synthetic datasets
| Variables/Categories | Census (%) | Hybrid, n (%) | Final, n (%) | ELSA, n (%) | HSE, n (%) | |
|---|---|---|---|---|---|---|
| Age | 50–59 years | 35.09 | 35.02 | 34.59 | 22.49 | 32.67 |
| 60–69 years | 31.16 | 31.16 | 31.19 | 37.64 | 32.09 | |
| 70–79 years | 20.37 | 20.48 | 20.75 | 26.66 | 22.66 | |
| 80–89 years | 11.16 | 11.15 | 11.24 | 10.96 | 11.05 | |
| ≥90 years | 2.22 | 2.19 | 2.21 | 2.26 | 1.53 | |
| Sex | Female | 52.98 | 52.84 | 54.07 | 55.58 | 53.96 |
| Male | 47.02 | 47.16 | 45.92 | 44.42 | 46.04 | |
| NSSEC | Higher Managerial & Professional | 30.04 | 30.16 | 31.39 | 34.74 | 32.36 |
| Lower Managerial | 14.4 | 14.29 | 13.84 | 13.70 | 15.57 | |
| Intermediate Occupations | 11.41 | 11.49 | 11.39 | 11.62 | 10.52 | |
| Lower supervisory & Technical | 7.99 | 8.08 | 8.17 | 9.28 | 7.59 | |
| Semi routine, routine & others | 36.16 | 35.98 | 35.20 | 30.65 | 34.06 | |
| BMI | <18.5 (Underweight) | – | 0.98 | 0.98 | 0.93 | 0.82 |
| 18.5–<25 (Normal) | – | 26.20 | 26.39 | 26.52 | 26.58 | |
| ≥24–<30 (Overweight) | – | 42.20 | 41.51 | 41.03 | 42.16 | |
| ≥30 (Obese) | – | 30.62 | 31.10 | 31.52 | 30.45 | |
| Knee Osteoarthritis | Yes | – | – | 18.69 | 18.85 | – |
| No | – | – | 81.31 | 81.15 | – | |
Validation parameters (SAE, R2 and SEI) for BMI and OA spatial microsimulations
| Variables/Categories | BMI simulation | OA Simulation | |||||
|---|---|---|---|---|---|---|---|
| SAE | R2 | SEI | SAE | R2 | SEI | ||
| Age | 50–59 years | 0.0186 | 0.9933 | 0.9918 | 0.0433 | 0.9681 | 0.9569 |
| 60–69 years | 0.0132 | 0.9983 | 0.9980 | 0.0200 | 0.9959 | 0.9951 | |
| 70–79 years | 0.0295 | 0.9933 | 0.9931 | 0.0560 | 0.9768 | 0.9753 | |
| 80–89 years | 0.0304 | 0.9949 | 0.9949 | 0.0617 | 0.9807 | 0.9800 | |
| ≥90 years | 0.0916 | 0.9801 | 0.9797 | 0.1741 | 0.9416 | 0.9289 | |
| Sex | Male | 0.0344 | 0.9847 | 0.9792 | 0.0680 | 0.9370 | 0.9327 |
| Female | 0.0304 | 0.9851 | 0.9847 | 0.0777 | 0.9367 | 0.9064 | |
| NSSEC | Higher Managerial & Professional | 0.0199 | 0.9978 | 0.9977 | 0.0583 | 0.9908 | 0.9800 |
| Lower Managerial | 0.0374 | 0.9888 | 0.9872 | 0.0818 | 0.9550 | 0.9450 | |
| Intermediate Occupations | 0.0300 | 0.9956 | 0.9954 | 0.0542 | 0.9867 | 0.9850 | |
| Lower supervisory & Technical | 0.0271 | 0.9940 | 0.9929 | 0.0556 | 0.9788 | 0.9710 | |
| Semi routine, routine & others | 0.0124 | 0.9987 | 0.9984 | 0.0353 | 0.9938 | 0.9881 | |
Data and code availability
2011 census data are publicly available via Nomis, provided by the Office for National Statistics (ONS) and can be assessed at https://www.nomisweb.co.uk/. Health Survey for England 2012 – 2014 were provided by NatCen Social Research, sponsored by the Information Centre for Health and Social care. Data are available courtesy the UK Data Service for scientific research upon registration. The English Longitudinal Study of Ageing was developed by a team of researchers based at the University College London, NatCen Social Research, and the Institute for Fiscal Studies. The data were collected by NatCen Social Research. The funding is currently provided by the National Institute of Aging (R01AG017644), and a consortium of UK government departments coordinated by the National Institute for Health Research. Data are available courtesy the UK Data Service for scientific research upon registration.
SimObesity was developed within the School of Geography, University of Leeds.