Gendered effects of the personal income tax: Evidence from a schedular system with individual filing in Uruguay
- Universidad de la República, Uruguay
Figures

Personal Income Tax burden by income for selected individual types.
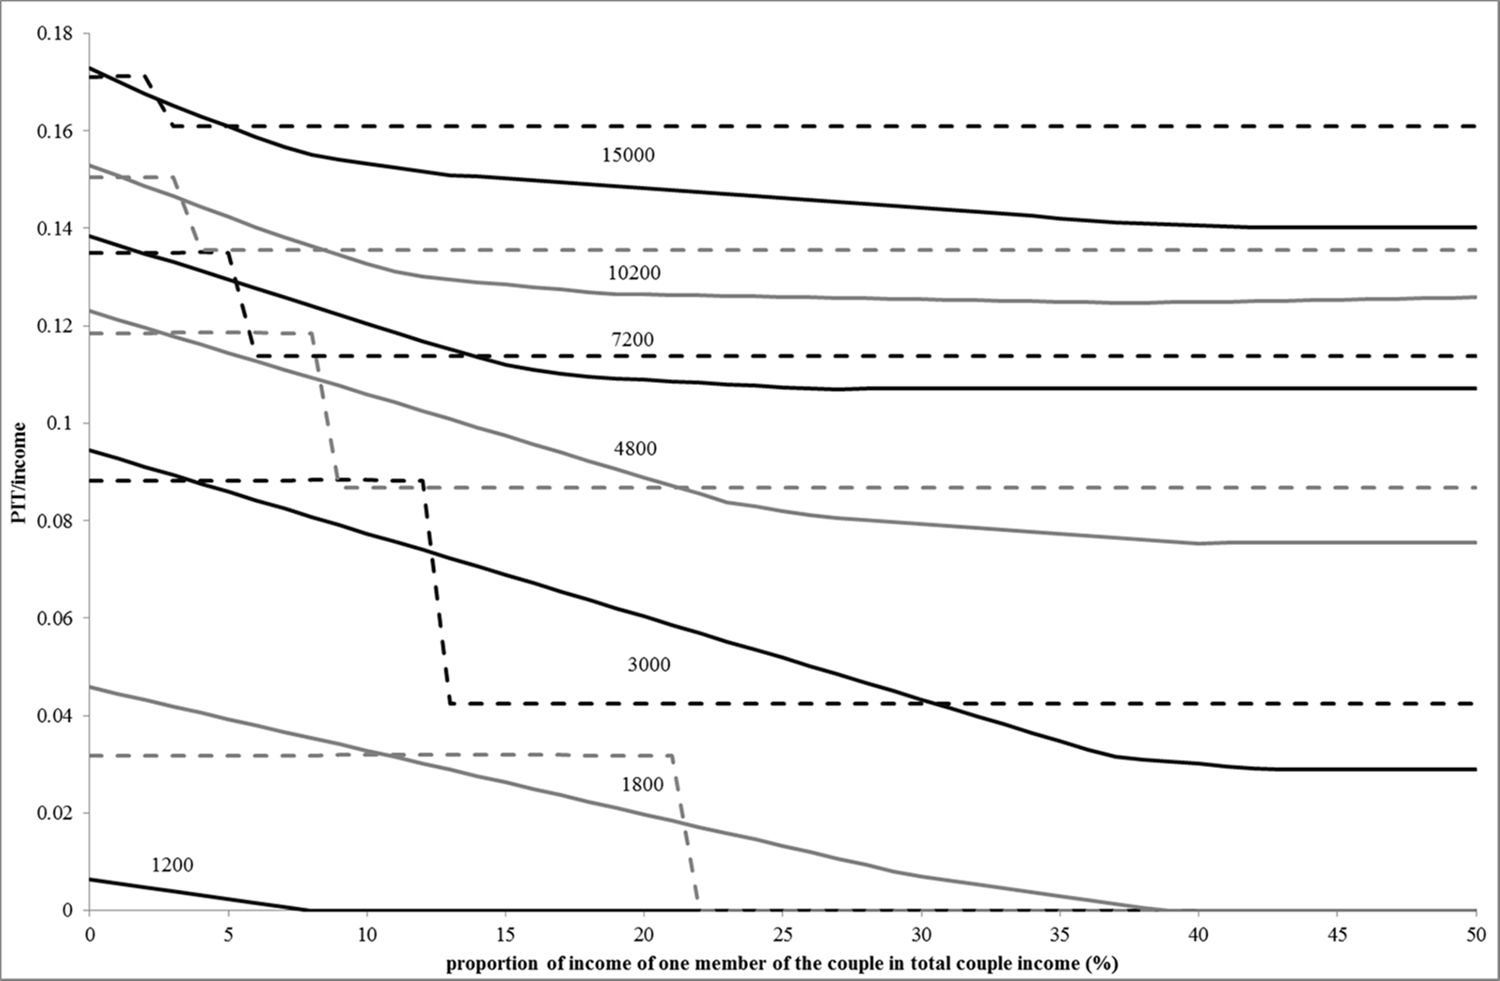
Personal Income Tax-to-income ratio for selected couples by participation of one spouse in generating labour income.

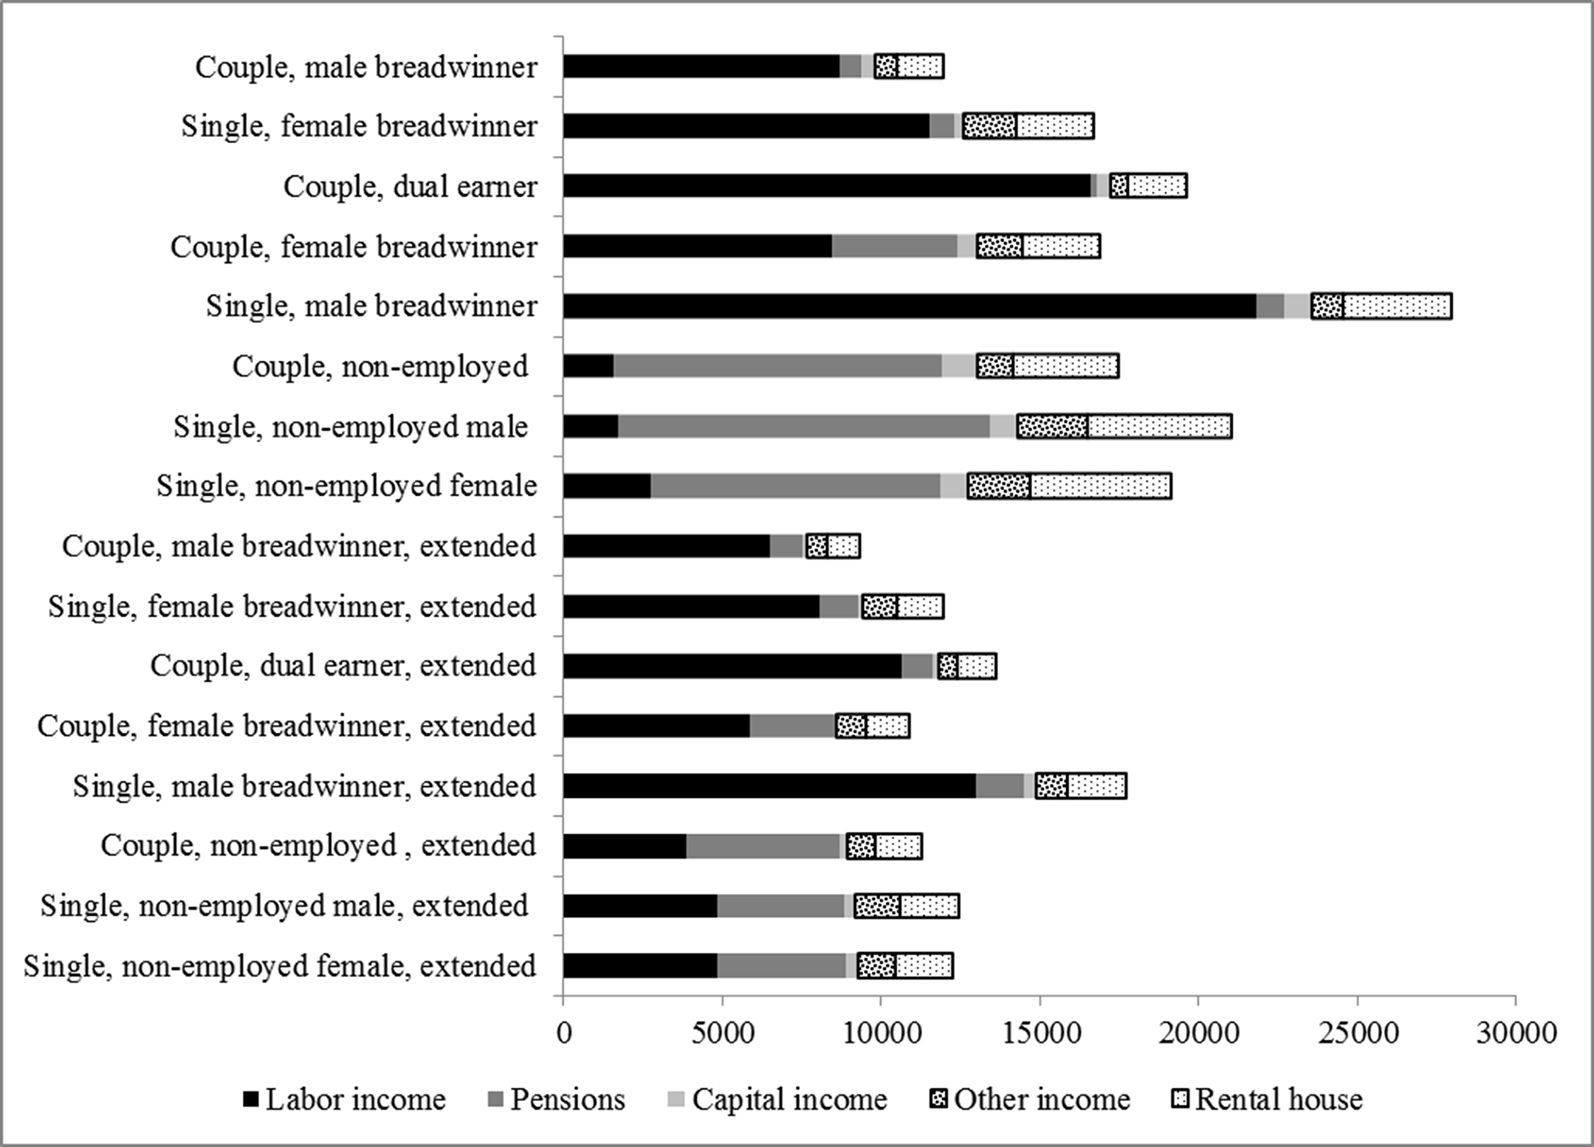
Per capita income of households by source.
Source: Authors’ calculations based on Encuesta Continua de Hogares 2013, Instituto Nacional de Estadística.

Average PIT burden and proportion of non-taxpayers by household type
Source: Authors’ calculations based on Encuesta Continua de Hogares 2013, Instituto Nacional de Estadística.
Note: in each bar, the straight line indicates the 95% confidence interval of the estimation.

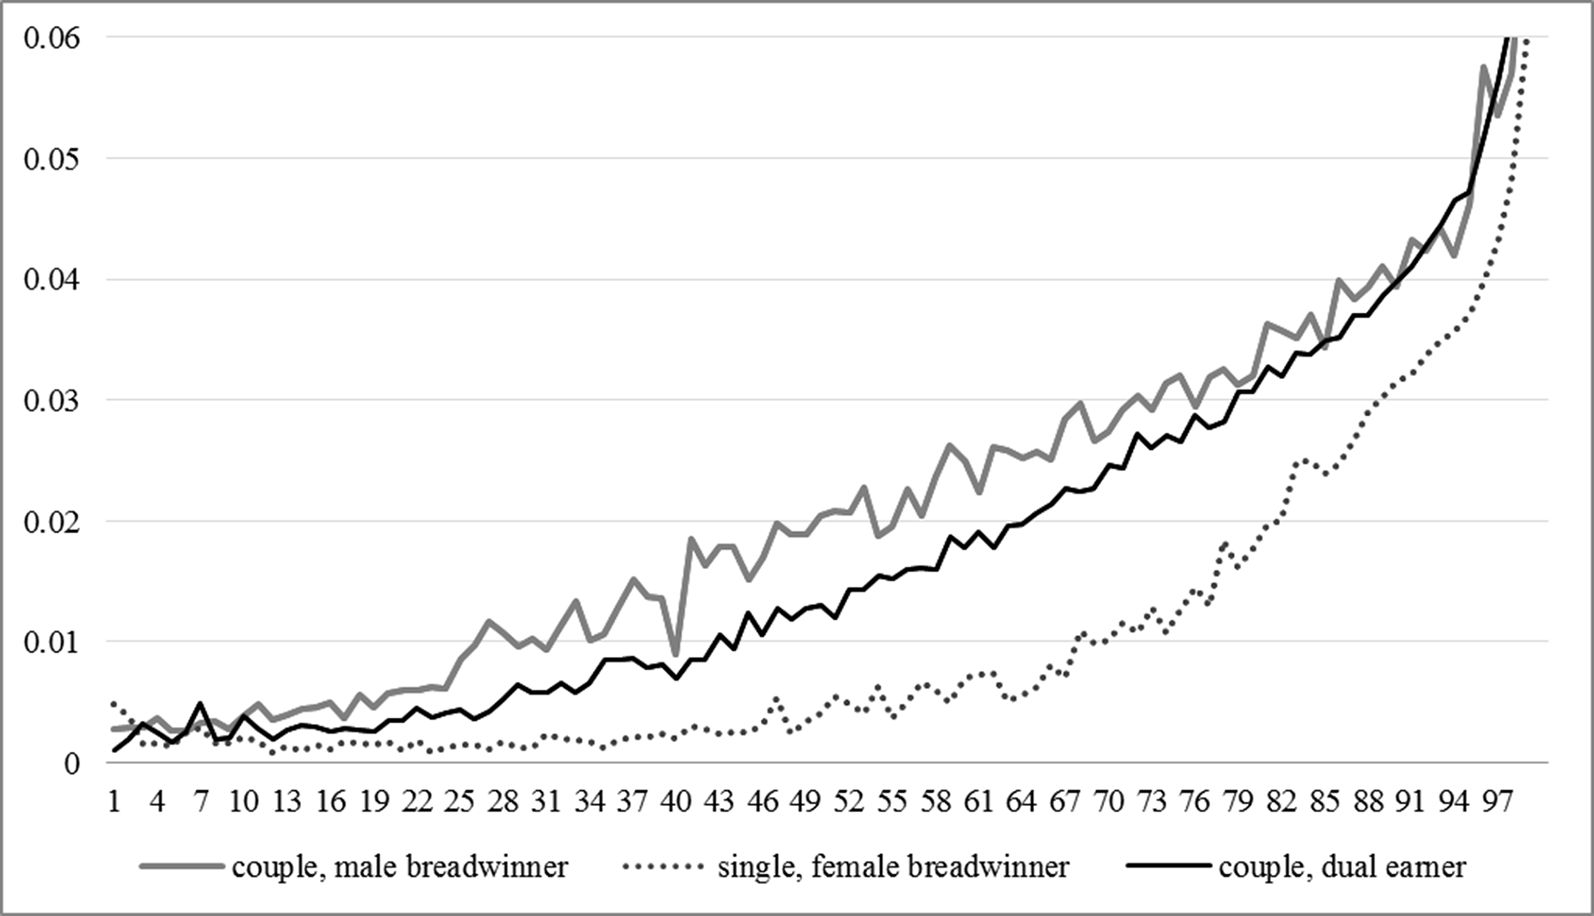
Predicted PIT across percentiles of per capita income distribution for three selected household types.
Source: Authors’ estimations based on Encuesta Continua de Hogares 2013, Instituto Nacional de Estadística.

Predicted PIT across percentiles of per capita income distribution for three selected household types
Source: Authors’ estimations based on Encuesta Continua de Hogares 2013, Instituto Nacional de Estadística.
Tables
Socio-demographic characteristics
| Uruguay | Latin american average | |||||||
|---|---|---|---|---|---|---|---|---|
| All | Women | Men | W/M | All | Women | Men | W/M | |
| Children per woman a/ | 2.04 | 2.14 | ||||||
| Life expectancy a/ | 77.0 | 80.5 | 73.3 | 1.1 | 74.8 | 78.1 | 71.5 | 1.1 |
| Population older than 64 b/ c/ | 14.0 | 16.5 | 11.2 | 1.5 | 6.7 | 7.5 | 5.9 | 1.3 |
| Years of education b/ d/ | 9.8 | 10.2 | 9.5 | 1.1 | 8.7 | 8.7 | 8.8 | 1.0 |
| Participation rate b/ c/ e/ | 76.1 | 66.9 | 85.7 | 0.8 | 68.5 | 54.8 | 82.6 | 0.7 |
| Households structureb/ f/ | ||||||||
| One person households | 21.9 | 11.0 | ||||||
| Couple without children | 17.2 | 9.0 | ||||||
| Couple with children | 33.2 | 39.9 | ||||||
| Lone-parent family | 12.0 | 11.9 | ||||||
| Extended households | 15.7 | 28.2 | ||||||
-
Source: CEPAL (2016) and World Bank (2016).
-
Notes: a/ 2005–2010; b/ 2010; c/ Percentage of population; d/ Population ages 25–59; e/ Population ages 15–64; f/ Percentage of households.
Main characteristics of household categories
| Household category | Frequency (weighted cases) (%) | Households with children (%) | Number of members | Number of earners | Lack of contribution to social security (%) | Age of the household head and spouse | Number of cases in the sample |
|---|---|---|---|---|---|---|---|
| All | 100 | 59.8 | 3.7 | 1.9 | 22.5 | 48.9 | 124,987 |
| Couple, male breadwinner | 18.4 | 72.4 | 4.1 | 1.4 | 27.3 | 42.5 | 22,230 |
| Couple, dual earner | 30.7 | 72.1 | 3.8 | 2.3 | 19.9 | 41.4 | 37,082 |
| Couple, female breadwinner | 3.2 | 42.1 | 3.3 | 1.9 | 27.7 | 52.4 | 4,033 |
| Couple, non-employed | 7.0 | 9.1 | 2.6 | 1.7 | 4.5 | 68.5 | 9,008 |
| Single, male breadwinner | 3.2 | 20.1 | 1.7 | 1.2 | 31.6 | 47.1 | 4,125 |
| Single, female breadwinner | 7.8 | 60.6 | 2.9 | 1.5 | 30.4 | 45.2 | 11,225 |
| Single, non-employed male | 1.3 | 3.6 | 1.4 | 1.1 | 3.9 | 70.2 | 1,886 |
| Single, non-employed female | 6.1 | 22.0 | 2.2 | 1.1 | 9.4 | 65.9 | 8,670 |
| Couple, male breadwinner, extended | 4.0 | 83.1 | 5.8 | 2.3 | 34.2 | 48.5 | 4,721 |
| Couple, dual earner, extended | 4.5 | 80.5 | 5.4 | 3.2 | 28.1 | 45.8 | 5,268 |
| Couple, female breadwinner, extended | 0.8 | 70.1 | 5.2 | 2.8 | 31.2 | 56.5 | 943 |
| Couple, non-employed , extended | 2.2 | 65.2 | 5.0 | 2.7 | 14.1 | 66.5 | 2,615 |
| Single, male breadwinner, extended | 1.7 | 37.7 | 3.5 | 2.2 | 30.8 | 44.4 | 1,976 |
| Single, female breadwinner, extended | 4.1 | 71.8 | 4.4 | 2.2 | 33.7 | 47.9 | 5,113 |
| Single, non-employed male, extended | 0.8 | 50.1 | 3.9 | 2.0 | 19.2 | 65.6 | 974 |
| Single, non-employed female, extended | 4.2 | 62.8 | 4.3 | 2.2 | 20.1 | 65.8 | 5,118 |
-
Source: Authors’ calculations based on Encuesta Continua de Hogares 2013, Instituto Nacional de Estadística.
-
Note: The lack of contribution to social security is calculated at household level as the ratio between non-contributors and workers; the ratio takes value 0 when no one in the household participates in the labour market.
Marginal effects estimated by a zero-inflated beta regression
| Variables | Model 1 | Model 2 | Model 3 |
|---|---|---|---|
| Couple, male breadwinner | −0.0067*** (0.00005) |
0.0048*** (0.00007) |
0.0046*** (0.00007) |
| Single, female breadwinner | −0.0116*** (0.00006) |
−0.0141*** (0.00006) |
−0.0056*** (0.00007) |
| Couple, female breadwinner | −0.0084*** (0.00008) |
−0.0071*** (0.00008) |
0.0035*** (0.00009) |
| Single, male breadwinner | −0.0045*** (0.00010) |
−0.0184*** (0.00006) |
−0.0150*** (0.00010) |
| Per capita income | 0.0205*** (0.00004) |
||
| Presence of children (yes =1) | 0.0082*** (0.00004) |
||
| Household size | 0.0041*** (0.00002) |
||
| Number of earners (labour, capital earnings or pensions) | −0.0044*** (0.00003) |
||
| Lack of contribution to social security | −0.0001*** (0.00000) |
||
| Per capita capital income | 0.0574*** (0.00075) |
||
| Per capita labour income | 0.0286*** (0.00008) |
||
| Per capita pension | 0.0278*** (0.00009) |
||
| Per capita public transfer | −0.0036*** (0.00012) |
||
| Per capita imputed rent of owner-occupied house | −0.0051*** (0.00011) |
||
| Observations | 124,987 | 124,987 | 124,987 |
-
Source: Authors’ estimations based on Encuesta Continua de Hogares 2013, Instituto Nacional de Estadística.
-
Note: For household types, we report the discrete effect related to the “couple, dual earner” type, valuing the rest of the variables at their means. For the rest of the dependent variables, we report the ‘marginal effect’ by household type compared to the “couple, dual earner” type.
-
***p<0.01, **p<0.05, *p<0.1
Marginal effects estimated by a zero-inflated beta regression
| Variables | Model 1 | Model 2 | Model 3 |
|---|---|---|---|
| Couple, male breadwinner | −0.0086*** (0.00004) |
0.0022*** (0.00006) |
0.0025*** (0.00007) |
| Single, female breadwinner | −0.0107*** (0.00006) |
−0.0123*** (0.00006) |
−0.0031*** (0.00007) |
| Couple, female breadwinner | −0.0095*** (0.00008) |
−0.0081*** (0.00007) |
0.0016*** (0.00010) |
| Single, male breadwinner | −0.0036*** (0.00010) |
−0.0164*** (0.00006) |
−0.0122*** (0.00010) |
| Per capita income | 0.0201*** (0.00004) |
||
| Presence of children (yes =1) | 0.0084*** (0.00004) |
||
| Household size | 0.0045*** (0.00002) |
||
| Number of earners (labour, capital earnings or pensions) | −0.0044*** (0.00003) |
||
| Lack of contribution to social security | −0.0001*** (0.00000) |
||
| Per capita capital income | 0.0665*** (0.00089) |
||
| Per capita labour income | 0.0299*** (0.00007) |
||
| Per capita pension | 0.0302*** (0.00009) |
||
| Per capita public transfer | −0.0032*** (0.00013) |
||
| Per capita imputed rent of owner-occupied house | −0.0054*** (0.00011) |
||
| Observations | 124,987 | 124,987 | 124,987 |
-
Source: Authors’ estimations based on Encuesta Continua de Hogares 2013, Instituto Nacional de Estadística.
-
Note: For household types, we report the discrete effect related to the “couple, dual earner” type, valuing the rest of the variables at their means. For the rest of the dependent variables, we report the ‘marginal effect’ by household type compared to the “couple, dual earner” type.
-
***p<0.01, **p<0.05, *p<0.1
Marginal effects estimated by a zero-inflated beta regression
| Variables | Model 1 | Model 2 | Model 3 |
|---|---|---|---|
| Single, non-employed female | −0.0045*** (0.00013) |
−0.0103*** (0.00007) |
−0.0128*** (0.00016) |
| Single, non-employed male | −0.0049*** (0.00007) |
−0.0105*** (0.00006) |
−0.0122*** (0.00011) |
| Controls | No | Yes | Yes |
| Observations | 124,987 | 124,987 | 124,987 |
-
Source: Authors’ estimations based on Encuesta Continua de Hogares 2013, Instituto Nacional de Estadística.
-
Note: The vector of household types includes 16 categories (presented in Table 2); for the estimation we omitted “couple, non-employed”. The rest of the variables are valued at mean. Models 2 and 3 include the control variables shown in tables 3 and 4.
-
***p<0.01, **p<0.05, *p<0.1
Data and code availability
The data we have used is publicly available on the National Statistical Office website (www.ine.gub.uy).
The code is open source and available from the journal upon request.