A Portable Dynamic Microsimulation Model for Population, Education and Health Applications in Developing Countries
- Consultant for The World Bank Development Data Group, United States
- The World Bank Development Data Group, United States
Figures
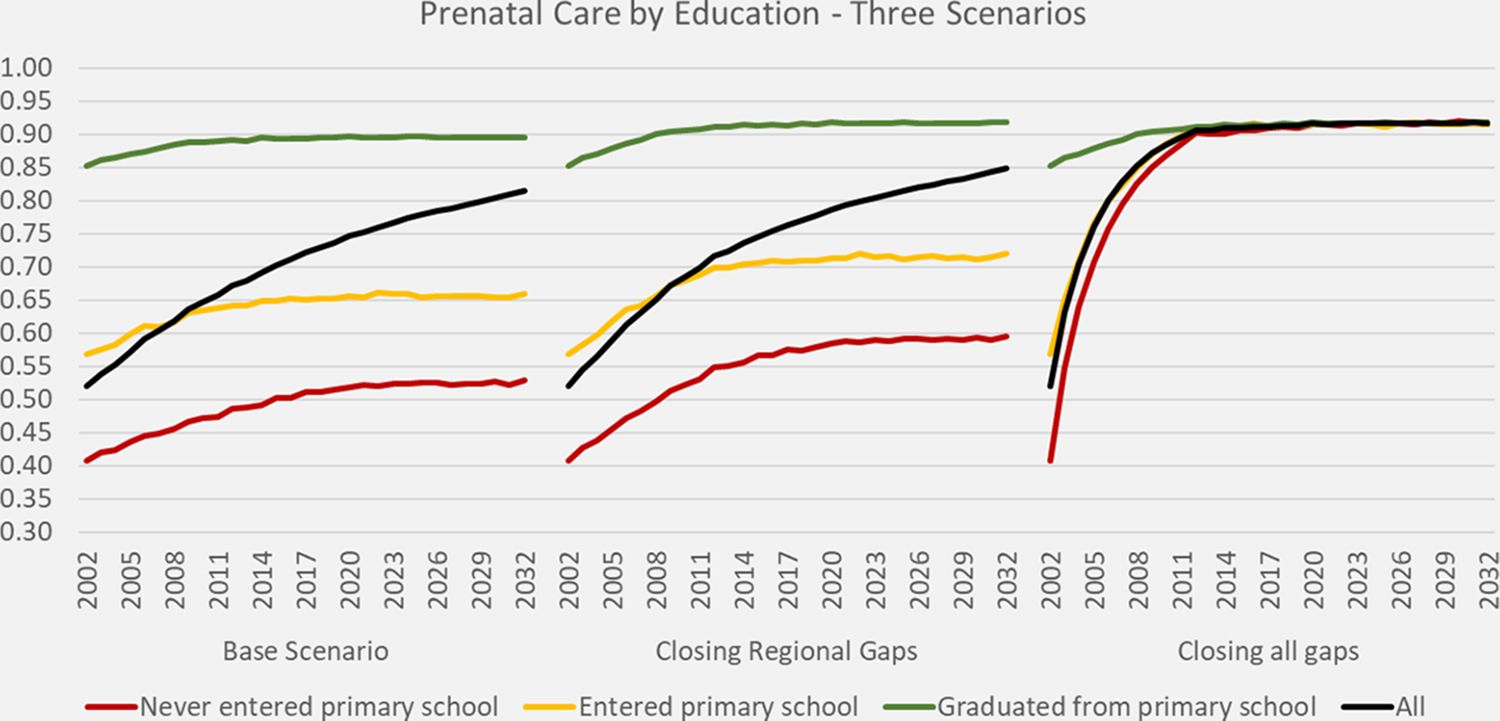
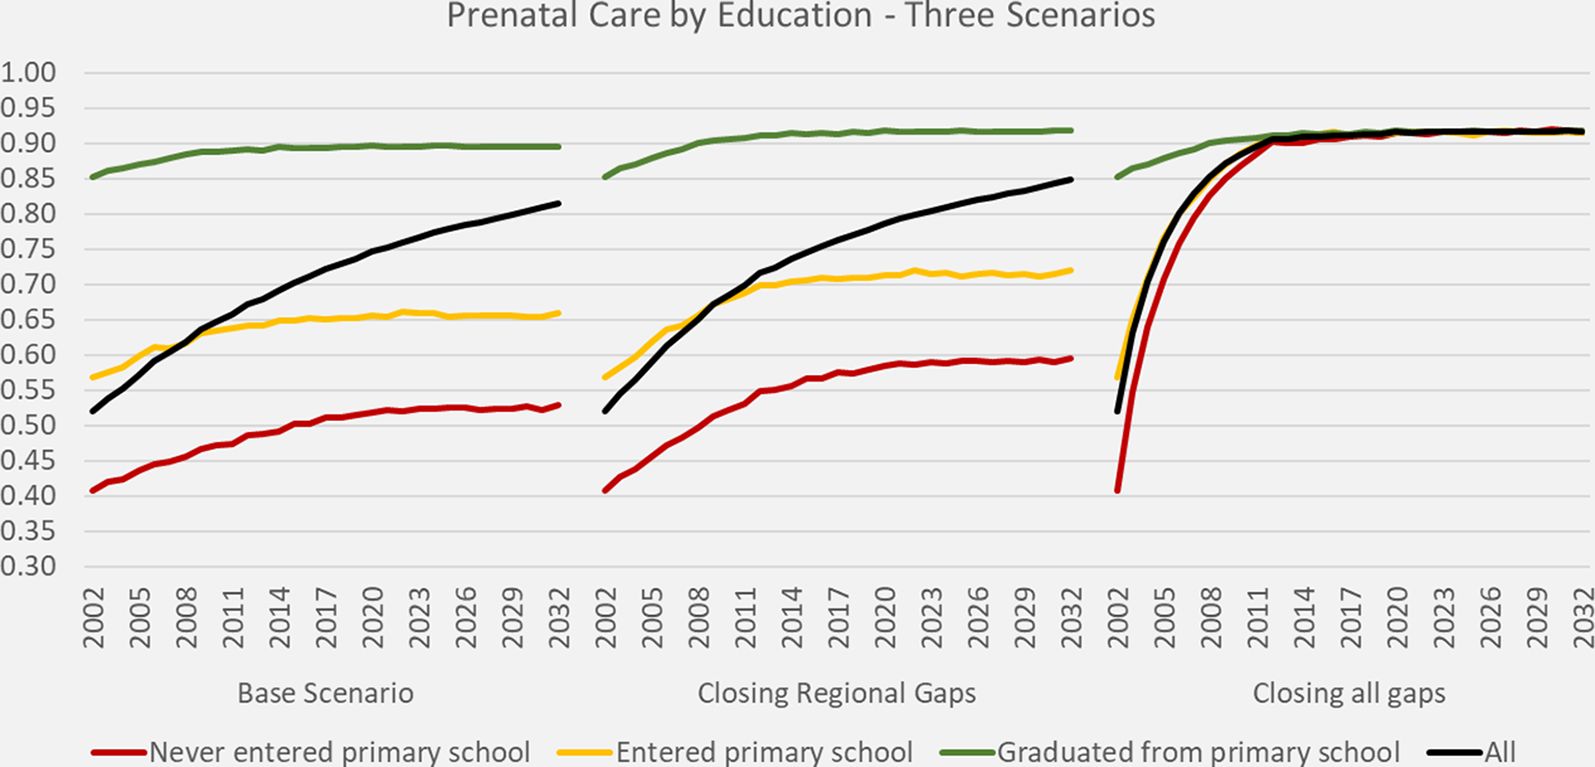
DYNAMIS-POP simulation projections for prenatal care, three scenarios.
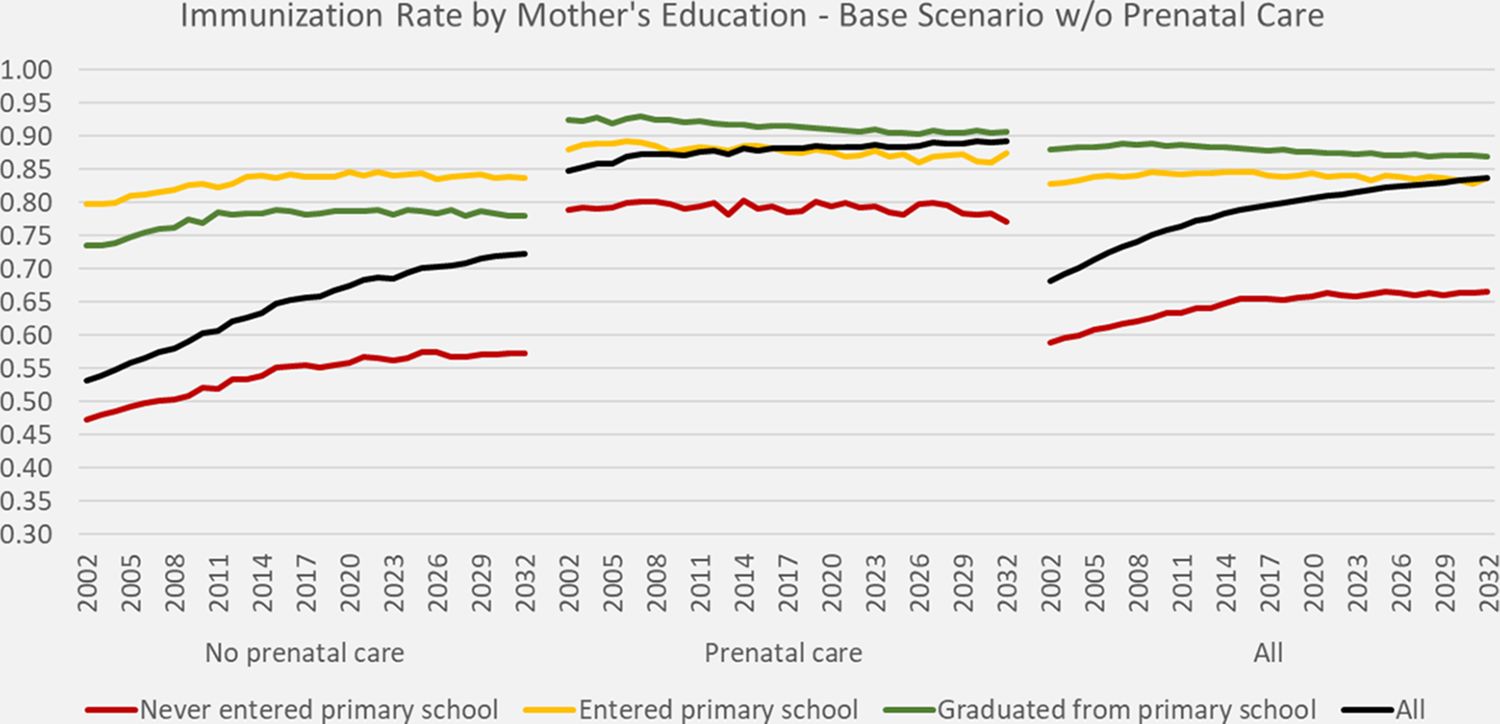
DYNAMIS-POP simulation projections for immunization rates by mother’s education, base scenario w/o prenatal care.

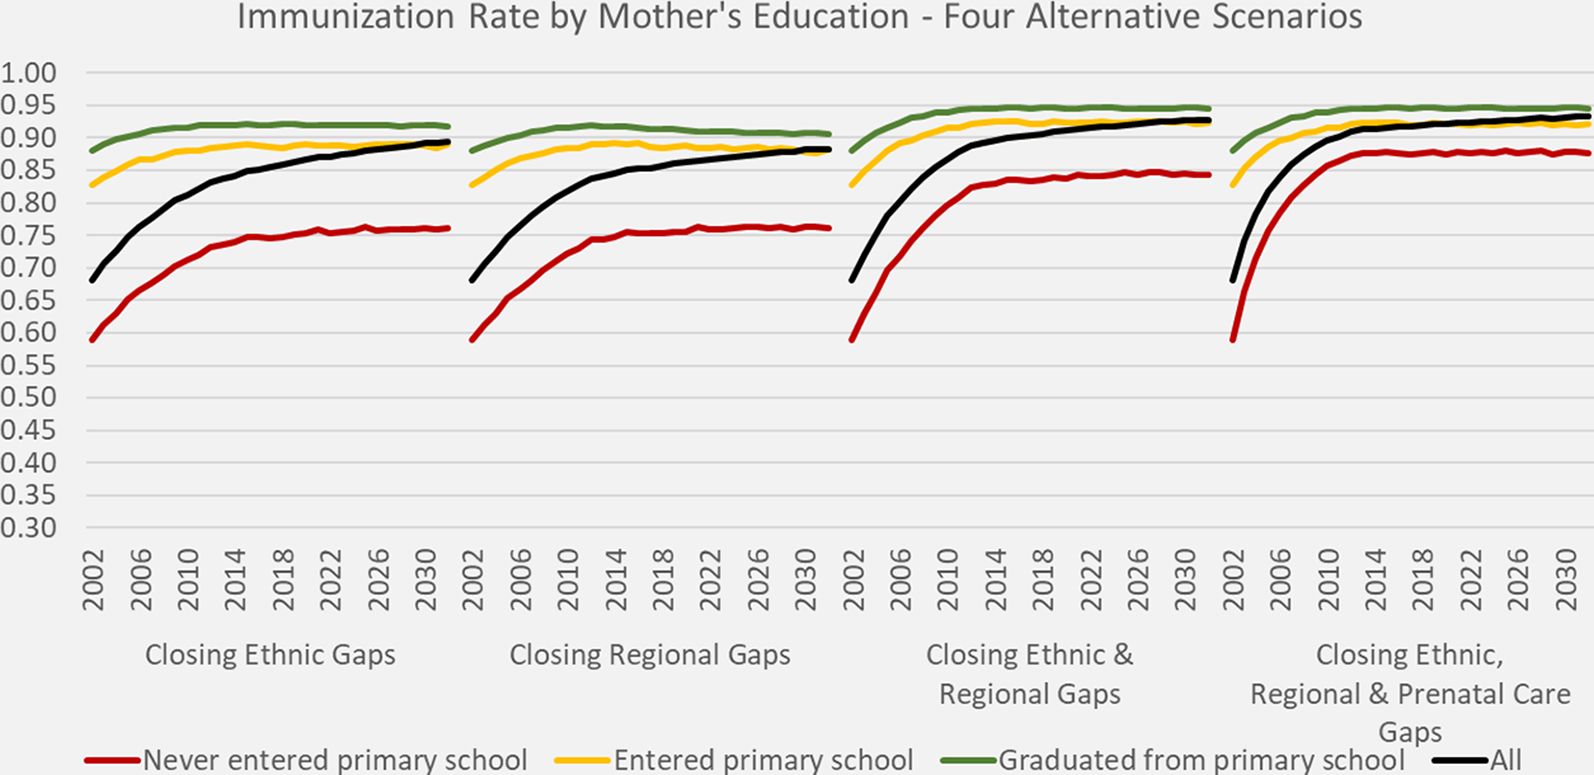
DYNAMIS-POP simulation projections for immunization rates by mother’s education, four alternative scenarios.

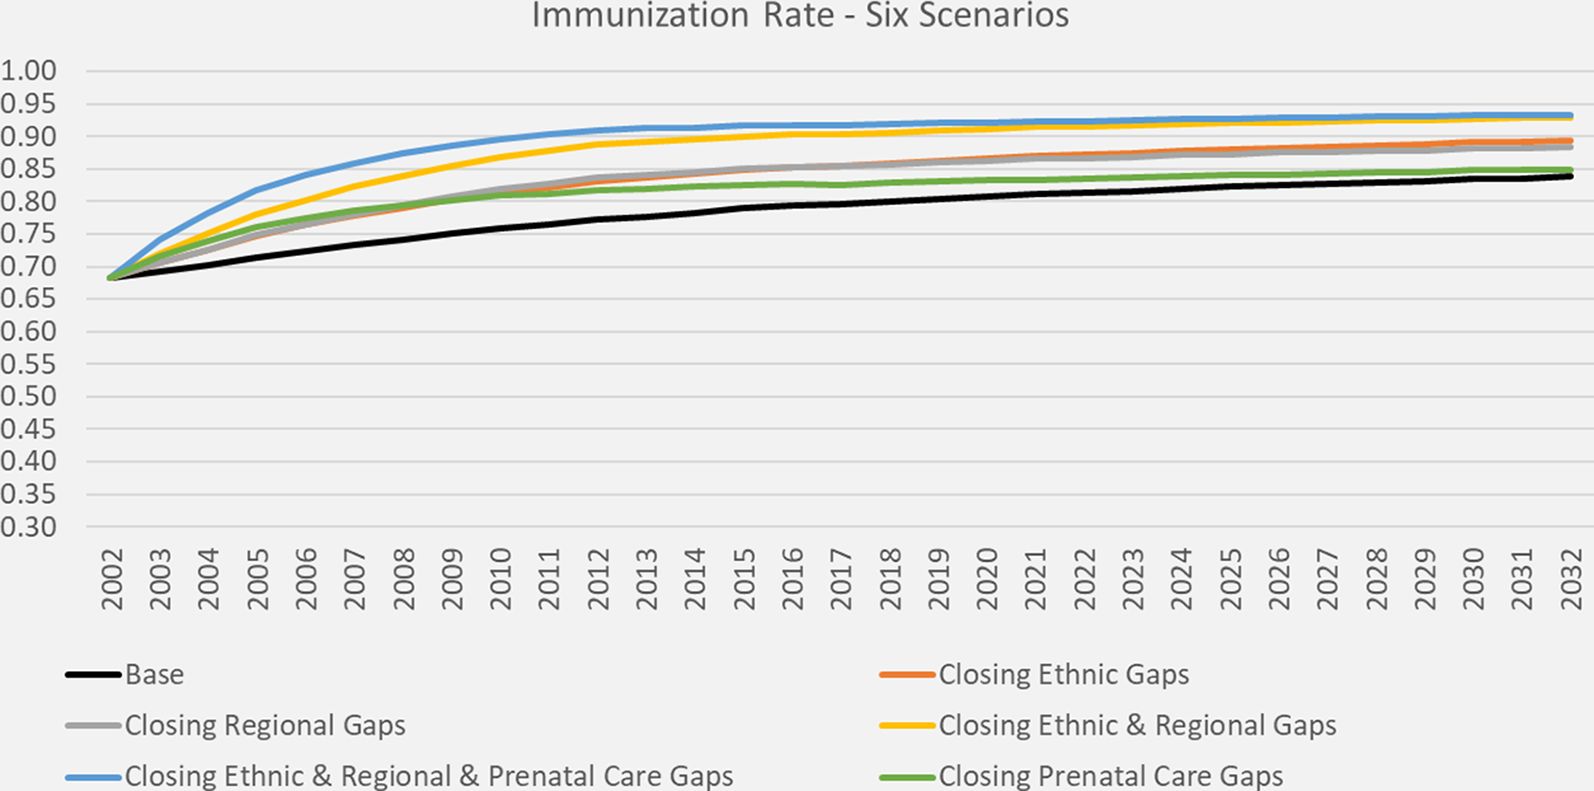
DYNAMIS-POP simulation projections for immunization rates, six scenarios.

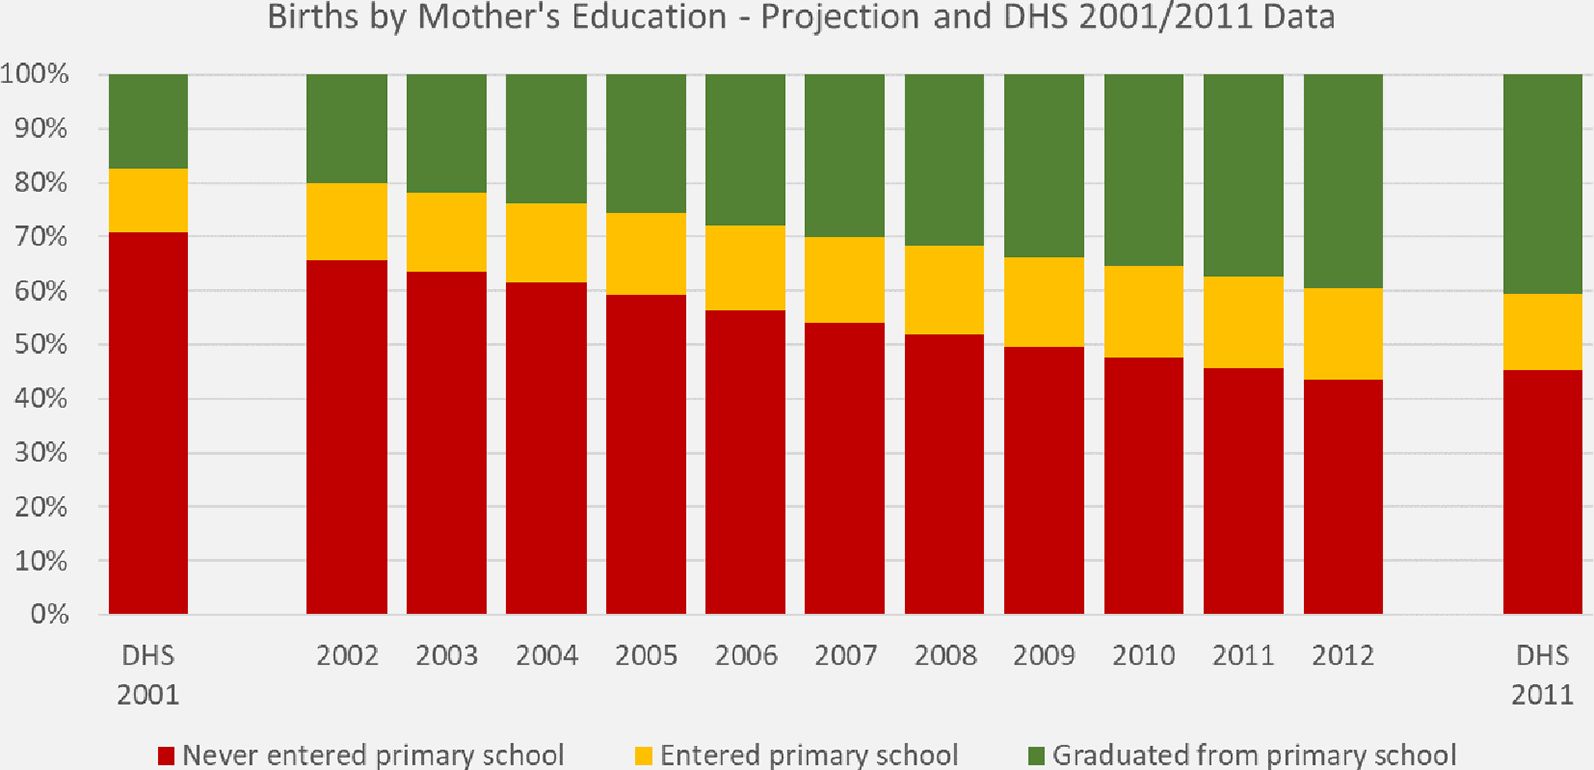
Distribution of mother’s education of one-year old children. DYNAMIS-POP projection and DHS data.

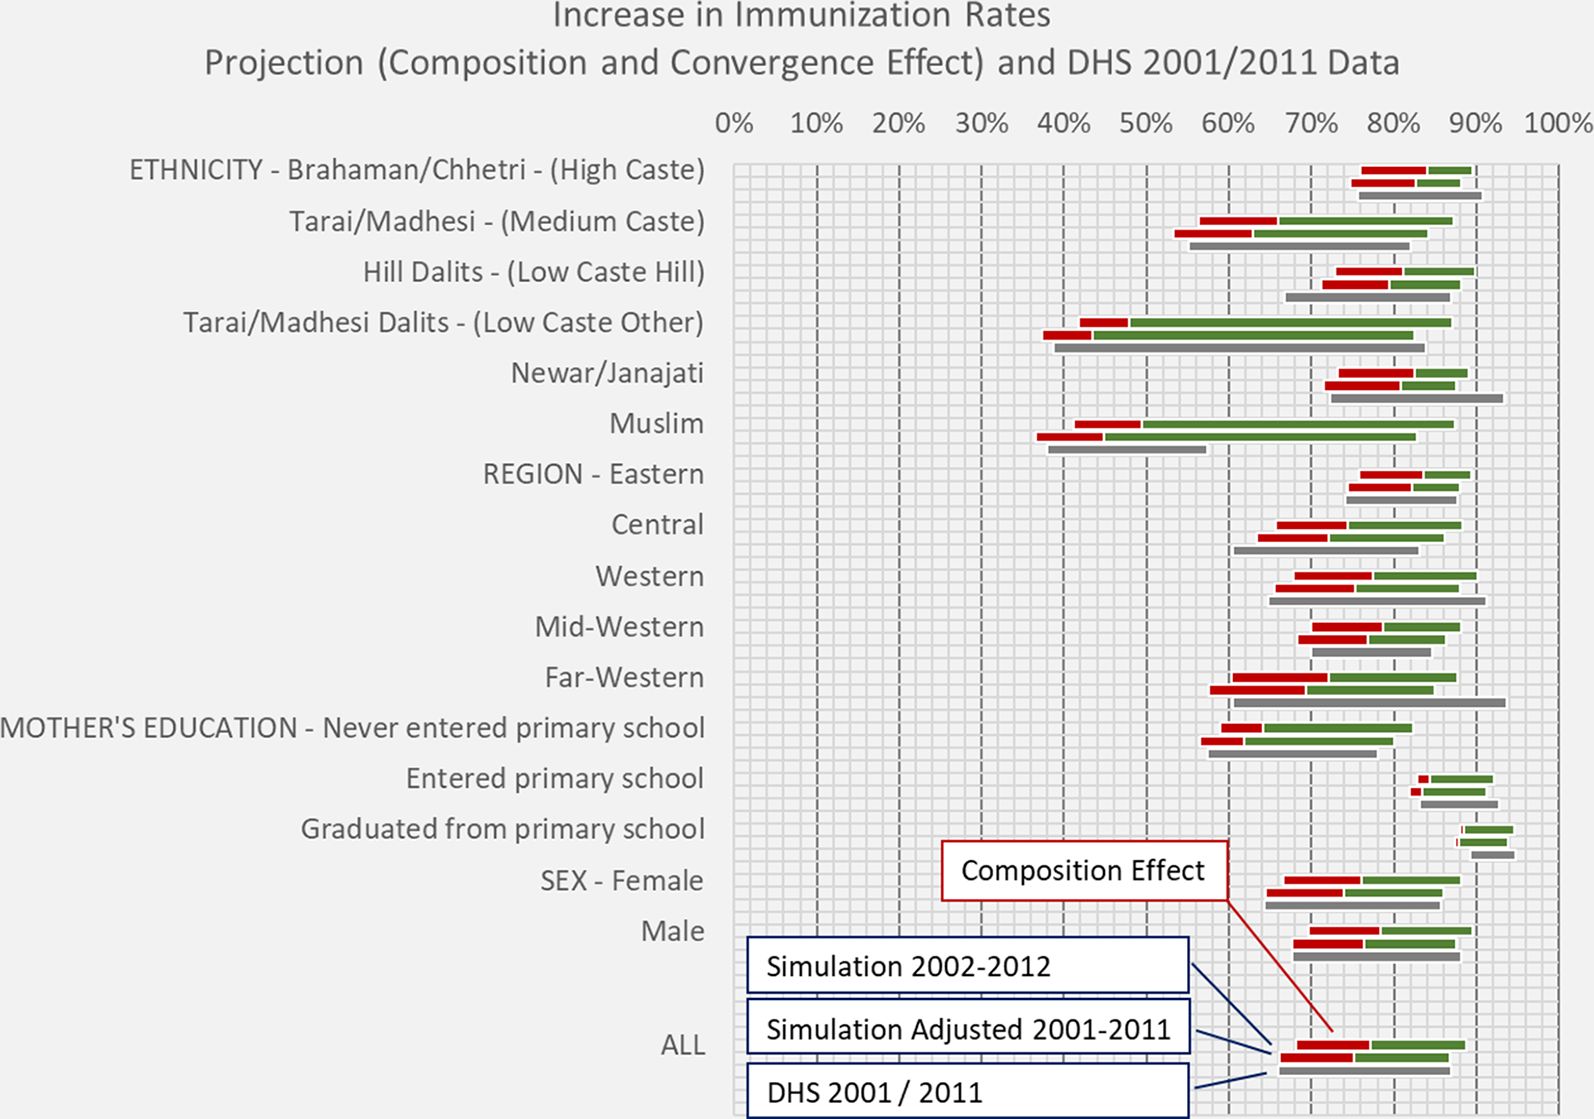
Increase in immunization rates: projected total increases and increases due to composition effects.

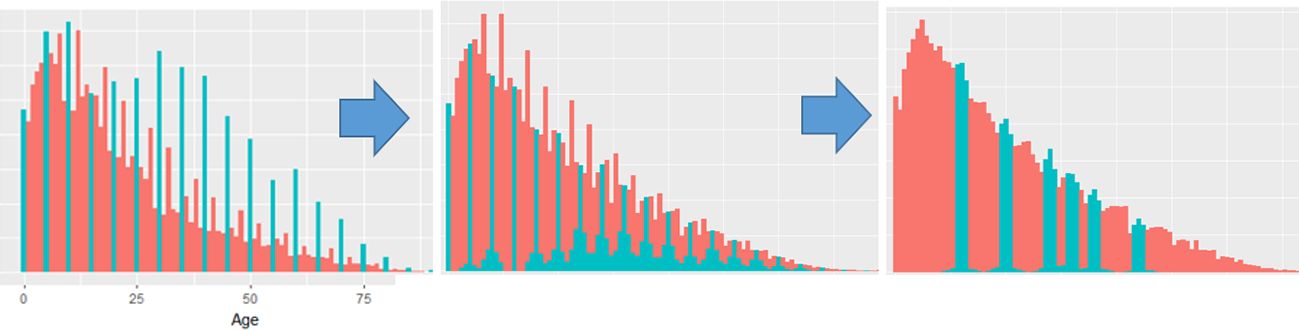
Age heaping in the 2001 Census of Nepal and its treatment preparing data for DYNAMIS-POP.

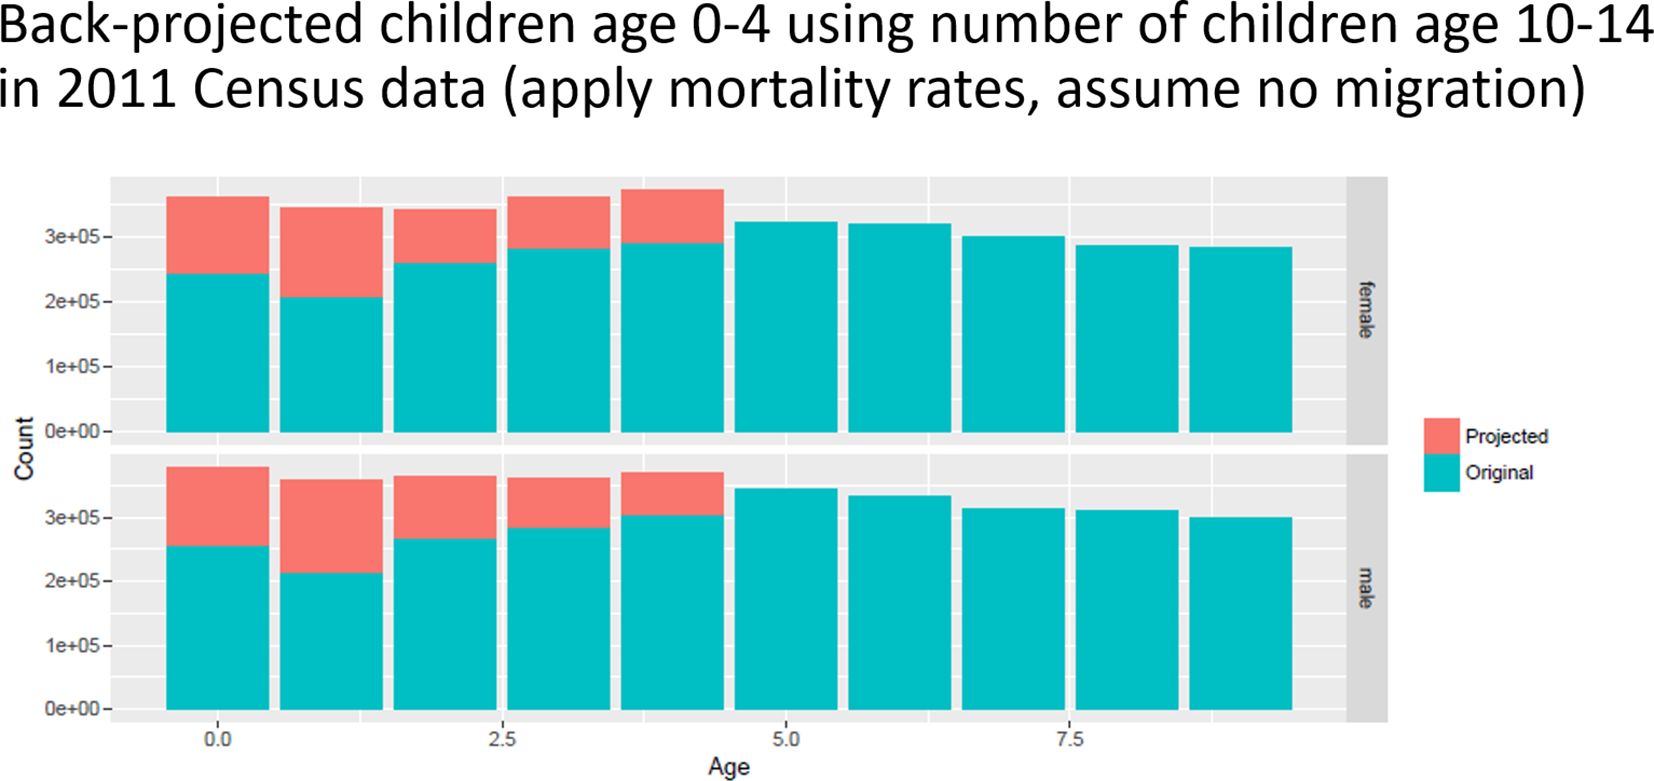
Underreporting of young children in the 2001 Census of Nepal. The red bars are ‘missing children’ when back-projecting children 0–4 using the number of children born in Nepal age 10–14 in the 2011 Census.
Tables
A simplified classification of caste and ethnicities in Nepal according to the The World Bank (2006) study on „Unequal Citizens. Gender, Caste and Ethnic Inclusion in Nepal
| % Total population | GSEA / NLSS II (10 groups) | 2001 census (103 groups) |
|---|---|---|
| Hindu caste groups (57.5%) | 1.BC (Hill) | Brahman, Chhetri, Thakuri, Sanyasi |
| 2.BC (Tarai) | Kayashta, Rajput, Baniya, Marwadi, Jaine, Nurang, Bengali | |
| 3.Tarai Middle Castes | Yadev,Teli, Kalwar, Sudi, Sonar, Lohar, Koiri, Kurmi, Kanu, Haluwai, Hajam/Thakur, Badhe, Rajbhar, Kewat Mallah, Numhar, Kahar, Lodha, Bing/Banda, Bhediyar, Mali, Kamar Dhunia | |
| 4.Dalits (Hill) | Kami, Damai, Sarki, Gaine, Badi | |
| 5.Dalits (Tarai) | Chamar, Musahar, Tatma, Bantar, Dhusadadh/Paswan, Khatway, Dom, Chidimar, Dhobi, Halkhor, Unidentified Dalit | |
| Janajatis (37.2%) | 6.Newar | All Newari Castes |
| 7.Janajatis (Hill) | Magar,Tamang, Rai, Gurung, Limbu, Sherpa, Bhote, Walung, Buansi, Hyolmo, Gharti/Bhujel, Kumal, Sunuwar, Baramu, Pahari, Adivasi Janajati, Yakkha, Shantal, Jirel, Darai, Dura, Majhi, Dunuwar, Thami, Lepcha, Chepang, Bote, Raji, Hayu,Raute, Kasunda | |
| 8.Janajatis (Tarai) | Tharu, Dhanuk, Rajbanshi, Tajpuriya, Gangai, Dhimal, Meche, Kisan, Munda, Santhal/Satar/Dhangad/Jhangad, Koche, Pattarkatta/Kusbadiya | |
| Muslims (4.3%) | 9.Muslims | Muslim, Churoute |
| Others (1%) | 10.Others |
Descriptive results of prenatal care and immunization rates. Source: DHS 2001 and DHS 2011, own calculations
| Prenatal care | Immunization DHS 2001 | Immunization DHS 2011 | |||||
|---|---|---|---|---|---|---|---|
| DHS 2001 | DHS 2011 | No Prenatal Care | Prenatal Care | All DHS 2001 | All DHS 2011 | ||
| Region | Eastern | 56.5% | 90.6% | 61.7% | 83.7% | 74.1% | 87.7% |
| Central | 54.1% | 84.7% | 46.6% | 72.3% | 60.5% | 83.1% | |
| Western | 55.2% | 84.1% | 44.2% | 81.5% | 64.8% | 91.2% | |
| Mid-West | 38.2% | 82.1% | 60.4% | 85.2% | 69.9% | 84.7% | |
| Far-West | 35.5% | 91.4% | 44.3% | 89.7% | 60.4% | 93.7% | |
| Ethnicity | Brahaman/Chhetri | 53.5% | 89.7% | 58.8% | 90.2% | 75.6% | 90.7% |
| Tarai/Madhesi | 54.6% | 91.1% | 41.5% | 66.4% | 55.1% | 82.0% | |
| Hill Dalits | 44.4% | 86.8% | 53.0% | 83.9% | 66.7% | 87.0% | |
| Tarai/Madhesi Dalits | 54.6% | 89.0% | 37.6% | 39.7% | 38.8% | 83.8% | |
| Newar/Janajati | 49.3% | 80.5% | 56.0% | 89.0% | 72.3% | 93.5% | |
| Muslim | 49.9% | 89.8% | 28.7% | 47.1% | 37.9% | 57.4% | |
| Other | 39.1% | -- | 46.3% | 57.1% | 50.5% | -- | |
| Education of mother | Never entered school | 40.2% | 79.6% | 47.7% | 71.8% | 57.4% | 78.1% |
| Primary school dropout | 58.0% | 88.2% | 78.1% | 86.8% | 83.1% | 92.9% | |
| Primary and above | 86.2% | 93.0% | 71.1% | 92.2% | 89.3% | 94.8% | |
| Mother’s age | >30 | 34.9% | 70.7% | 47.9% | 73.5% | 56.8% | 82.4% |
| 26–30 | 43.7% | 85.1% | 48.9% | 77.0% | 61.2% | 86.7% | |
| 21–25 | 52.6% | 90.4% | 52.9% | 84.1% | 69.3% | 87.8% | |
| 18–20 | 65.0% | 89.5% | 63.2% | 79.7% | 73.9% | 88.2% | |
| <18 | 62.8% | 90.6% | 48.9% | 80.7% | 68.9% | 89.1% | |
| Sex | Female | 47.8% | 84.4% | 50.6% | 79.4% | 64.3% | 85.7% |
| Male | 53.0% | 88.1% | 53.3% | 80.5% | 67.7% | 88.2% | |
| Prenatal care | No | -- | -- | -- | -- | 51.8% | 70.3% |
| Yes | -- | -- | -- | -- | 79.9% | 89.6% | |
| TOTAL | 50.3% | 86.2% | 51.8% | 79.9% | 65.9% | 87.0% | |
Regression results of logistic regression models for prenatal care and immunization based on DHS 2001 and DHS 2011 data. Own calculations. The coefficients are expressed as odds ratios
| Prenatal care | Immunization DHS 2001 | Immunization | ||||||||
|---|---|---|---|---|---|---|---|---|---|---|
| DHS 2001 | No Prenatal Care | Prenatal Care | All | DHS 2011 | ||||||
| Constant | 0.626 | ** | 1.709 | 5.213 | *** | 2.419 | *** | 3.986 | *** | |
| Male (Female reference) | 1.299 | 1.052 | 1.260 | * | 1.248 | |||||
| Mother entered primary school (No school reference) | 1.743 | ** | 3.926 | *** | 1.487 | 2.978 | *** | 2.779 | ** | |
| Mother graduated primary education | 7.590 | *** | 2.700 | * | 2.424 | * | 4.347 | *** | 3.444 | *** |
| Central region (Eastern region reference) | 0.951 | 0.526 | * | 0.591 | . | 0.581 | *** | 0.786 | ||
| Western region | 0.754 | 0.407 | ** | 0.612 | 0.479 | *** | 0.923 | |||
| Mid-Western region | 0.528 | ** | 0.711 | 0.782 | 0.647 | * | 0.680 | |||
| Far-Western region | 0.459 | *** | 0.336 | ** | 0.962 | 0.374 | *** | 1.643 | ||
| Tarai/Madhesi (Brahaman/Chheri reference) | 0.447 | * | 0.360 | * | 0.457 | *** | 0.728 | |||
| Hill Dalits | 0.878 | 0.750 | 0.851 | 0.843 | ||||||
| Tarai/Madhesi Dalits | 0.399 | . | 0.107 | *** | 0.240 | *** | 1.059 | |||
| Newar and Janajati | 0.758 | 1.091 | 0.835 | 1.654 | ||||||
| Muslim | 0.263 | ** | 0.147 | *** | 0.231 | *** | 0.235 | *** | ||
| Other | 0.570 | 0.185 | *** | 0.355 | *** | |||||
| Mother’s birth cohort 1 (25–29 at birth; 30+ reference) | 1.199 | 1.129 | 1.263 | 1.185 | 1.245 | |||||
| Mother’s birth cohort 2 (20–24 at birth) | 1.485 | * | 1.192 | 2.043 | * | 1.470 | ** | 1.170 | ||
| Mother’s birth cohort 3 ( ≤ 20 at birth) | 2.326 | *** | 1.903 | * | 1.441 | 1.808 | *** | 1.411 | ||
| Young Mother (age <18; 18+ reference) | 0.819 | 0.408 | . | 0.919 | 0.586 | ** | 0.863 | |||
| Sample size (n) | 1,295 | 649 | 646 | 1,295 | 943 | |||||
DYNAMIS-POP simulation projections for prenatal care, three scenarios
| Prenatal care scenarios | Prenatal care rate | |||
|---|---|---|---|---|
| 2002 | 2012 | 2022 | 2032 | |
| Scenario X0 - Base (used in immunization scenarios A0 and A1) | 52.0% | 67.2% | 76.0% | 81.5% |
| Scenario X1 - Closing regional gaps (used in A2 and A3) | 52.0% | 71.7% | 79.9% | 84.8% |
| Scenario X2 - Closing all prenatal care gaps (use in A4 and A5) | 52.0% | 90.7% | 91.6% | 91.7% |
DYNAMIS-POP simulation projections for immunization rates, six scenarios
| Immunization scenarios | Immunization rate | |||
|---|---|---|---|---|
| 2002 | 2012 | 2022 | 2032 | |
| Scenario A0 - Base (prenatal care scenario X0 - Base) | 68.1% | 77.2% | 81.3% | 83.8% |
| Scenario A1 - Closing ethnic gaps (prenatal care scenario X0 - Base) | 68.2% | 83.2% | 87.1% | 89.3% |
| Scenario A2 - Closing regional gaps (prenatal care scenario X1 - closing regional gaps) | 68.2% | 83.8% | 86.6% | 88.3% |
| Scenario A3 - Closing ethnic & regional gaps (prenatal care scenario X1 - closing regional gaps) | 68.2% | 88.8% | 91.5% | 92.8% |
| Scenario A4 - Closing ethnic & regional & all prenatal care gaps (prenatal care scenario X2) | 68.2% | 91.0% | 92.4% | 93.2% |
| Scenario A5 - Closing prenatal care gaps only (prenatal care scenario X2) | 68.1% | 81.7% | 83.5% | 84.9% |
Data and code availability
DYNAMIS-POP is based on data readily available for most developing countries. It is designed to be easily ported to countries. We provide a version for an imaginary country usable for testing, training, and as a template for creating new country applications. Data provided with the model are synthetically generated non-confidential data. All data-based parameters as well as the starting population are generated from a set of four data files which can be derived from population census data and from the data collected through a Demographic and Health Survey (DHS), a Multiple Indicator Cluster Survey (MICS), or equivalent. Parameter generation is highly automated to facilitate porting the model to new country contexts by adapting just a few country-specific set-up files. Equally, besides a specific country setup module, which must be adapted to account for country-specific features like geographical regions or the definition of ethnical groups, all modules are generic.
DYNAMIS-POP is fully documented, and all its components are freely available. DYNAMIS-POP is created using freely available software. Its code - including the full set of statistical analysis files for parameter generation and estimation - is available for download at dynamis.ihsn.org. The analysis presented in this paper was performed with DYNAMIS-POP version 2.202. The model is implemented in Modgen, a generic microsimulation programming language developed and maintained at Statistics Canada. All statistical analysis is performed using the open-source statistical package R. Statistical analysis files are documented and include statistical and graphical output of analysis results. DYNAMIS-POP has an intuitive graphical user interface and runs on a standard personal computer. The model documentation includes a step-by-step implementation guide which can be used as textbook for Modgen programming.