A Portable Dynamic Microsimulation Model for Population, Education and Health Applications in Developing Countries
- Consultant for The World Bank Development Data Group, United States
- The World Bank Development Data Group, United States
Abstract
Detailed socio-demographic projections are key for policy making and planning. In this paper we introduce the dynamic microsimulation platform DYNAMIS-POP. In its core, DYNAMIS-POP is a population projection model, able to reproduce existing macro (cohort-component based) population projections in their aggregate outcomes, but with the additional possibility to simulate in more detail a variety of geographic, education, ethnicity, child mortality, partnership status, fertility and health characteristics. DYNAMIS-POP is a continuous time interacting population model implemented in Modgen, a freely available programming technology developed at Statistics Canada. The code is also x-compatible with openM++, a platform-independent open-source implementation of Modgen. All components of DYNAMIS-POP are freely available and documented on line at www.dynamis.ihsn.org. Most statistical analysis scripts and scripts for post-processing and visualization of the results are implemented in R. Aiming to support portability, the model code and the R scripts are generic. Adaptation of the model to a specific country only requires adapting a single setup script and simulation module. The model is provided with test data of an imaginary country. Required data are available for most developing countries. To date, the model was tested using data from Mauritania, Nepal and Senegal. Designed as a modular and versatile microsimulation platform, DYNAMIS-POP can be adapted for a variety of applications related to population issues, education and health. In this paper we give an illustration from a study on child vaccination in Nepal.
1. Introduction
Detailed socio-demographic projections are key for policy making and planning. Changes in the size and composition of the population are key determinants of the demand for goods and services, from basic food and education, to energy and housing. Projections, based on multiple scenarios, help governments and decision makers make informed decisions.
Most countries and international organizations, like the World Bank and the United Nations, produce population projections using the cohort-component method, a macro approach limited to a very small number of characteristics. This provides projections by age and sex at the national level, often dis-aggregated by urban/rural areas; large countries sometimes provide projections at a sub-national level. Given the high importance of education on human capital and its influence as the "single most important variable besides age and sex" on demographic behaviors (Lutz et al., 1999), population projections that include education later became available for most countries, but that extension defined the technical limit of this approach.
A more advanced and flexible approach consists of dynamic microsimulation models. In this approach, the life course of a large sample of individuals is simulated. This approach is more complex, but it has major advantages: it produces detailed projections of a broad variety of individual characteristics, models realistic life-courses and their diversity, and supports the modeling of interactions between people as well as between people and the environment. The idea is to start with a micro-data population and make it evolve over time, unlike the cohort-component approach, which starts with a simple distribution of a population by age and sex but cannot track individuals over time. The idea is not new (Van Imhoff and Post, 1998), but it has become feasible and affordable only recently with the availability of free programming technologies and improvements in data availability and accessibility. Still, applications so far were limited to the developed world. The most prominent example is Demosim, the microsimulation population projection model developed and used by Statistics Canada to project the Canadian population by visible minority group (Caron-Malenfant et al., 2010) and Aboriginal identity (Morency et al., 2015), to project its labor force (Martel et al., 2011), and to study the effect of educational improvements on the future size and composition of the Aboriginal labor force (Spielauer, 2014). Variants of Demosim were recently developed as well for several European countries and Australia (Marois et al., 2017). The aim of the DYNAMIS-POP model is to demonstrate the feasibility and potential benefits of socio-demographic microsimulation in the context of developing countries, and to provide a versatile modeling platform based on data-sets available for a wide set of countries around the globe.
The growing interest in disaggregated data for development planning and monitoring (including monitoring the Sustainable Development Goals) justify a push for more disaggregation in projections and simulations. Microsimulation also allows a more explicit incorporation of theory and policy levers in projections. For example, it allows modeling of inter-generational dynamics and analysis of downstream effects on demographic change of education policy interventions.
This paper is organized in five sections. Following this introduction, Section two provides some context and rationale for using dynamic microsimulation in developing countries. In Section three we describe the DYNAMIS-POP model. Section four presents a concrete application examples of the model use: a study on child vaccination in Nepal. Child vaccination is a standard module of DYNAMIS-POP, thus both parameter generation and module implementation are fully documented at the project website dynamis.ihsn.org. From a technical side, the example demonstrates how to add a module to DYNAMIS-POP. The model is extendable as well as portable to other counties. Some recent developments are discussed in Section 5. The Appendix addresses typical data issues and ways to address them as part of the workflow of data analysis and parameter generation.
2. Rationale and context
Microsimulation in the context of socioeconomic applications can be perceived as an experiment with a virtual society of thousands -- or millions -- of individuals. Its static variant – tax benefit models – have become standard tools in the developed world (eg, EUROMOD; Sutherland and Figari, 2013) and are increasingly established in developing countries (eg, SOUTHMOD; Decoster et al., 2019). Central to dynamic microsimulation is the explicit modeling of the time dimension, following people and their families or households over time. Dynamic modeling lends itself naturally to the modeling of policies with a longitudinal component, eg, educational investments, especially in the context of general rapid social, economic, and demographic change that make it difficult to assess the contribution of individual policies to overall trends without tracking and comparing the lives of individuals who form a society. Rapid social and demographic change are typical for developing countries. This makes dynamic microsimulation a valuable tool to complement traditional evaluations of effects of development programs.
Dynamic microsimulation is attractive both from a theoretical and a practical point of view. It supports research embedded into modern paradigms, such as the life-course perspective, while simultaneously providing a tool for what-if analysis of high policy relevance. Typical application areas – due to their longitudinal component - include the analysis of pension system adequacy and sustainability, health insurance, long-term care, and education finance. Using microsimulation in demographic projections is a recent development. Although this has been discussed in literature for two decades (eg, Van Imhoff and Post, 1998), large-scale implementations are recent. Statistics Canada was the first statistical office to produce official population projections using microsimulation in 2004. Called Demosim, this model is implemented using the free microsimulation programming technology Modgen, developed and maintained by Statistics Canada. Variants of Demosim were recently developed also for several European countries and Australia (LSD; Marois et al., 2017).
The strengths of microsimulation do not come without limitations which affect the applicability of this approach. From a methodological point of view, the central limitation of microsimulation is that the degree of model detail does not go hand-in-hand with overall prediction power. Providing more detailed models, something at which microsimulation excels, does not necessarily mean the models are "better." The ability to produce distributions comes at the price of losing predictive power in projecting means, and the ability to make very accurate statements in the short run does not necessarily lead to models that are useful for long-term projections. An analogy is weather forecasts: detailed models for the weather tomorrow, on a geographical scale, will not be of use for the projection of global climate changes over the next centuries. This also applies to socioeconomic models. The longer the time horizon and the more important the mean, the more the focus should be directed to the main driving forces and a solid theoretical foundation of these mechanisms. The reason for this can be found in what is called randomness. The main sources of randomness are parameter uncertainty, randomness originating from the sampling of the starting population, and Monte Carlo variability, as the occurrence of events in microsimulation depends, besides individual characteristics, on chance. (For an in-depth discussion of randomness in microsimulation see Van Imhoff and Post, 1998). All sources of randomness will increase with the number of variables of the model. Additional variables require the modeling of additional processes with parameters usually estimated from empirical data, thus subject to parameter uncertainty. Detailed variables are frequently only available in specialized surveys of limited sample size, thus subject to sampling errors. The maintenance of additional variables in the simulation requires the modelling of additional processes, which increases the number of required Monte Carlo experiments thus adding to the Monte Carlo variability.
The fundamental problem lies in the trade-off between the additional randomness introduced by additional variables and misspecification errors caused by models that are too simplified. This means that the large number of variables that models can include, which is the feature that makes microsimulation especially attractive, at some point comes at the price of randomness and a decrease in prediction power that occurs as the number of variables increases. There are two ways of dealing with this trade-off. The first is to keep models simple. The second is to combine the strengths of different modeling approaches. Not surprisingly, in many large-scale microsimulation models, some outcomes are aligned or calibrated towards aggregated numbers or projections obtained by external means. The effort to keep models simple often leads to macro models bypassing microsimulation as a modeling strategy, the choice often justified with the higher development costs of microsimulation. This choice ignores the fact that microsimulation can often reproduce the results of macro models if needed (and at comparable costs), while also allowing for step-wise refinements and removal of simplifying assumptions inherent to macro models. This is the development strategy we followed building DYNAMIS-POP. For most behaviors, model users can choose between a base version resembling existing macro projections and a refined version. In addition, results of the refined models can be aligned to the base versions thus reproducing existing macro projections for aggregate outcomes, while producing realistic life-courses and additional characteristics. This makes DYNAMIS-POP a flexible analysis and projection tool.
Another often-stated drawback of microsimulation is that such models have high data demands, and high costs of acquisition and compilation of data. It can be noted, however, that such costs are not explicit costs associated with the microsimulation itself but represent the price to be paid for informed policy making. Recent advances in data availability and standardization could turn this argument around: microsimulation can make available data more policy relevant, as it complements traditional data analysis and combines such analysis with a what-if projection tool. In the case of DYNAMIS-POP, required data are readily available for many countries.
3. The DYNAMIS-POP model
DYNAMIS-POP is a customizable, modular microsimulation platform for socio-demographic projections portable to most developing countries. So far it was tested using data from Mauritania, Nepal and Senegal. In addition, a version including synthetic data for an imaginary country usable for testing, training, and as a template for creating new country applications is provided.
DYNAMIS-POP is implemented using Statistics Canada’s freely available Modgen microsimulation language. It has a user-friendly graphical user interface with a help function for both the user interface and the model and its modules, parameters etc. Users can easily change parameters and create and save new scenarios. It also has rich table output, which can be exported to Excel. The model can generate projected micro-data files, for user-defined variables and points in time. It runs on a standard PC under Windows. The execution time of a model run depends on processor speed, population sample size, time horizon of the simulation, and the user’s choice of model selection and alignment routines. A typical model run, starting from an initial population sample of 250,000 persons and a 100-year time horizon, is approximately 10 minutes. This time can increase substantially for some alignment options. As DYNAMIS-POP is an interacting population model in which all persons can communicate, there is no parallelization within a simulation run, but Modgen supports running a set of simulation runs (up to 41 replicates) in parallel. In this case, all table output is available both for each replicate and as average over replicates, and measures of Monte-Carlo variation (standard deviation, coefficient of variation) are provided automatically for each table cell. All presented simulations in this paper are based on a simulation for Nepal of 6 Mill persons (24 replicates of initially 250,000 persons each, sampled from a starting population of 2.3Mill; around 10% of the population 2001). In the context of presented results, the chosen simulation size makes Monte Carlo variation neglectable.
The code is also x-compatible with openM++, a platform-independent open-source implementation of Modgen (ompp.sourceforge.io/wiki). OpenM++ supports cloud computing and does not limit the number of replicates, thus supporting massive parallel runs required for assessing parameter uncertainty. An R package (OpenMPP) exists for reading and writing OpenM++ parameter/result databases and simulations can be run directly from R. While none of these added features and possibilities were used in the current development phase of the DYNAMIS-POP project, they extend the adaptability of the model and responds to potential future demands.
The Modgen (and openM++) programming language does not support statistical modeling and parameter estimation. While developers can choose which statistical package to use, we have chosen R as an open-source solution, and due to the available interface with openM++. Except for a country-specific setup script, the workflow for parameter generation is highly automated. DYNAMIS-POP is documented in detail. Both its code and all statistical analysis files are available to model builders, who can use the step-by-step instructions as a textbook and toolbox for microsimulation model development, adaptation, and implementation. All resources are available from the project website at dynamis.ihsn.org.
The model is highly modular and built step-by-step, each of the (currently 22) steps typically adding one module – and a corresponding R script for parameter estimation and parameter file generation.
Together, the modules create a fully functional model application, but modules can be adapted and extended, and new modules can be added. The generic DYNAMIS-POP model can thus be used as the core of a modeling platform.
3.1. Data requirements
For generating the starting population and all data-based parameters, DYNAMIS-POP requires two types of data: population projection data and micro-data. Population projection data are the same data as used in cohort-component models and include age-specific fertility patterns, projected total fertility rates, a standard life table, and projected life expectancies by period and sex. Such data are readily available online (eg, for the macro model DemProj; Stover and Kirmeyer, 2001).
Four micro-data files are required for parameter estimations and the creation of the starting population. These files can typically be created from population censuses and a household survey like UNICEF’s Multiple Indicators Cluster Surveys (MICS) or USAID/ICF’s Demographic and Health Surveys (DHS). The four micro-data files are:
A file of current residents typically compiled from a population census dataset. This file has 17 variables including general information (ID, Household ID, record weight, age, sex, ethnicity, education), geographic information (two levels - eg, regions and provinces - at three points of time: at birth, 12 months ago, current), and family characteristics (parity, births past 12 months, age at first marriage, age at most recent birth)
A file of recent emigrants (people who emigrated in the past 12 months). This file is typically compiled from census information from household members living abroad and not required when emigration rates by age, sex, and province are available directly. The file contains five variables: age, sex, weight, (previous) region, province.
A file of child history records reported by women. This information is available in MICS as well as in DHS surveys. The file has 11 variables. Besides general characteristics of children (eg, sex, age at birth, ethnicity, region) the file contains information on immunization status and survival, as well as on mother’s characteristics including education, receipt of prenatal care, and age at birth of the child.
A female record file recording all dates of births reported by women. This information is available in MICS as well as in DHS surveys. Besides the dates of up to 14 births, the file contains general and family information of the mother (weight, age, education, region, time of first marriage)
Once the required data files are created, most of the work-flow for model parameterization is automated. The only “manual” step required is the creation/adaptation of a country-specific R script for setting file names, the number and labels of regions and provinces, and the starting point in time of the simulation. A set of numbered generic self-documenting R scripts is available online for creating all parameter files (of a base scenario) as well as the starting population.
While the required micro-data are available for most developing countries, data quality might be an issue. These problems are not specific to the use for microsimulation but become more visible than in macro projections. On issue is age heaping. For example, in the 2001 Census of Nepal, more people report an age 25 than ages 24 and 26 together. This problem is common, and frequently hidden in population projections by aggregating analysis to 5-year age groups. DYNAMIS-POP does not aggregate age, and many potential DYNAMIS-POP applications (eg, school planning) require detailed projections of the population by age. A second common problem is the under-reporting of young children. In the case of Nepal, we found the number of reported births in the past 12 months very different from the number of 0-year-old; also, the number of 10-year-old children born in Nepal reported in the 2011 census is 30% higher than the number of 0-year-old reported in the 2001 census. In a project complementary to the development of DYNAMIS-POP, we address these issues and provide open source tools (the R package SimPop, see Templ et al. (2019); and code) which allow the integration of steps to fix data issues into the workflow of model parametrization. SimPop provides routines to address age heaping by changing the reported age in some records, meeting a set of consistency criteria (eg, avoiding that the age of a primary school graduates is reduced below school leaving age). Underreporting of young children is fixed by algorithms creating synthetic records to meet a target age distribution and adding these records to plausible households (eg, households with woman having declared a birth in the past 12 months, but the baby is not reported as household member). An example for Nepal is given in the Appendix. While fixing data issues is crucial to all applications requiring a good projection of population numbers by exact age (like school planning), the application example in this paper –child vaccination – was chosen also because it is relatively insensitive to these problems, at least as long as the focus is on rates, and not on absolute numbers, like required vaccines.
3.2. Module types
DYNAMIS-POP is organized into modules which typically address a specific behavior or process (like mortality), correspond to a code file as well as an R script for parameter generation. The modules can be classified into three groups.
Core demographic modules: These are the modules necessary for the micro-simulation implementation of a typical cohort component population projection model. Without any other modules added, these core modules constitute a fully functional equivalent to common macro models, projecting populations by age, sex, and district. When combined with additional modules, the core modules can be used to produce alignment targets. This allows to produce the same aggregate population projections as in existing projections while creating realistic individual careers and adding detail like education, school attendance, ethnicity, and partnership status.
Other core modules: These are the base versions of modules necessary for adding variables and related processes to the model. Examples are education, the intergenerational transmission of ethnicity, first union formation, prenatal care and immunization.
Refined and optional modules: These are optional modules which refine existing modules or add functionality. These modules can be removed or replaced by customized modules. For example, the refined fertility module uses information on partnership status, education and the timing and number of previous births. Refined models for child mortality and education account for mothers’ characteristics. Additional optional education modules track students through a grade system, add a secondary school system, and introduce functionality for school infrastructure planning.
The provided set of R scripts for parameter generation create a base scenario which can be changed by users within the graphical user interface of the model. As a compiled model, users can change parameters, but not the functional form of regression models. As some modules are optional, users can de-activate them (eg, all migration modules can be switched off) or choose which module to use for a process (eg, selecting a detailed fertility module replacing the base module). Built as a modeling platform, model developers can adapt and change modules and corresponding regression models or provide alternative versions and leave the model choice to the user. Some adaptations only require modifications in the country-specific setup file. This is the case eg, when changing the number and labels of districts and their aggregation to regions. In contrast, changing the functional form of a model or the number of independent variables requires code changes both in the analysis script as well as in the model implementation.
3.3. Model alignment
DYNAMIS-POP supports the (optional) alignment of a set of core processes allowing to easily reproduce available macro projections. Processes which can be aligned are child mortality, fertility, primary school entry, and primary school graduation. All processes of DYNAMIS-POP for which alignment is available are based on proportional models which express risks (in continuous time) or odds (for discrete time decisions) by a base factor applying to all, and a set of relative factors applying to specific population groups. The logic behind this type of alignment is to adjust base factors in a way that – for a given population composition, and when applying individual relative factors – a target aggregated outcome is reached. In this way, relative differences between population groups are maintained. Proportional models are very convenient in microsimulation. From a modeling perspective, they have the advantage that aggregate outcomes and relative factors can be estimated separately from different data sets, thereby combining the robustness of large data sets (like the Census or vital statistics) for overall outcomes with the wealth of variables offered by other sources such as surveys used to estimate relative factors. Another advantage of proportional models is that they support very intuitive scenarios, e.g. trends which apply to all population groups, and changes in relative differences, like scenarios of closing gaps between groups. (For a discussion in the context of Statistic Canada’s Demosim population projection model, see Caron-Malenfant et al., 2017). When estimating overall outcomes and relative differences separately, base factors still must be found which, together with the relative factors, result in the target aggregate rates for a given population composition. In the context of parameter estimation, this step is performed outside of the model. Alignment routines in DYNAMIS-POP follow the same logic as when combining estimates of aggregate targets with estimates of relative factors to one proportional model but perform the search for base factors within a simulation run. While the technical implementation of some alignment routines is complex (for a detailed documentation see project website), the mechanism has a clear statistical interpretation. All alignment is optional.
3.4. Starting population
The model starts from a baseline population file -- a standard comma-separated variables (CSV) text file. Records can be weighted, and the file length does not have to correspond to the true population size nor the size of the simulated population sample, which are parameters. According to these parameters, when the file is larger than the simulated starting sample, the model automatically samples from the starting population file. If the file is smaller than the chosen starting sample, the model replicates observations. All model output is automatically scaled to the total population size regardless of the chosen sample size for the simulation. Choosing larger samples will reduce Monte Carlo variability at the expense of additional time requirements to run the model.
3.5. Fertility
Model users can choose between two fertility modules. The core module corresponds to a typical macro model; the refined one models fertility separately by parity and includes a more detailed list of variables than just age. When using the refined module, the user can choose to align results to the macro model for producing the same aggregated outcomes.
Like in the DemProj model, the base version is parameterized by projected age distributions of births and total fertility rates. Model users can easily change the scenario of the projected total fertility rates (TFR) without having to change the age profile of fertility. Internally, the model automatically calculates fertility rates by age and period. The base fertility module is used in two alternative ways: as the model to be used to implement fertility, and as the benchmark model. In the latter case, it is used to produce the number of births to which the more detailed refined fertility model can be aligned. The limitation of the base model is that it ignores important fertility differences, eg, by number and timing of previous births. Because of this limitation, even if the future age-specific fertility was known, the model would only produce the right number of children but no realistic female life courses.
The Refined Fertility Module models fertility by age, parity, educational attainment, and union status. First births are parameterized with separate age-specific fertility tables by education and union status. Higher-order births are modeled by proportional hazard regression models estimated separately by birth order. Models contain a baseline risk profile by duration since the previous birth and the relative risks for age group, education, and union status. Additionally, users can create scenarios for future trends.
3.6. Mortality
As for fertility, we provide two versions of the mortality model: a core model that resembles a typical macro model, and a refined version. The refined model focuses on infant mortality by mother’s characteristics. When using the refined model, the user can align results to the macro model to produce the same aggregated outcomes in the number of deaths for an initial year.
In the base mortality module mortality is modeled by age and sex. Parameters are a mortality table (for age patterns) and projected period life expectancy. Within the application, the life table is scaled automatically for each year to meet the targeted life expectancy by calendar year and sex. If no national tables are available, standard mortality tables can be used.
An optional child mortality module focuses on mortality of children age 0 through 4. In addition to baseline mortality risks by age and sex, relative risks by age and level of education of mothers are used. The list of covariates can easily be adapted to allow accounting for other characteristics like ethnicity, immunization, or other variables. When switched on, this module “overwrites” the base mortality model for children up to their fifth birthday. While this will typically alter the overall life expectancy, the user can align aggregate outcomes for an initial year; in this case, life expectancy is the same as in the initial year and future differences can be attributed to the changing composition of age and education of mothers. Additionally, the user can set specific time trends by age for child mortality, different from the overall trend (which is calculated automatically to meet the life expectancy parameter).
3.7. Migration
The model includes modules for internal migration, emigration, and immigration. All modules currently follow typical macro approaches. Internal migration is based on age-specific origin-destination matrices. For easier scenario creation, probabilities to leave a province and distribution of destination provinces by age group and origin are parameterized separately.
Immigration is modeled specifying the total number of future immigrants by sex, their age distribution by sex, and the distribution of the province of destination by age group and sex. For immigrants, only their sex, place of residence, and age is initially known in the simulation. While education is modeled like for residents from birth (treating abroad like a separate region), other characteristics, including parity, union status, and time of last birth, are sampled from the foreign-born population of the same known characteristics, or the total resident population if no donors are found.
The emigration module is driven by age-specific emigration rates by province, age and sex. It is assumed that emigration patterns stay constant over time.
Refined versions of the migration processes, especially international migration, are currently under development. Specifically, we aim at addressing temporary work migration and family migration. Work migration is a common phenomenon in many developing countries. In the case of Nepal, basing regional projections on period emigration rates ignoring expected back migration would literally remove the adult male population from some provinces within a few decades.
3.8. Ethnicity
The concept of ethnicity is generic / country specific. Ethnicity can refer to any grouping of the population and could represent ethnical background, caste, or religion. Parameters are the transmission of the ethnicity variable from mother to child and the ethnicity distribution of immigrants by age and sex.
3.9. Primary education fate
Primary education is a key variable for various processes, including first union formation, fertility, and in the form of mother’s education for prenatal care, child immunization and child mortality. At its core, the model is parameterized by probabilities to enter and probabilities to graduate from primary school by year of birth, province of birth, and sex, respectively. In addition, the model can introduce inter-generational transmission of education by specifying proportional factors (odds ratios) by mother’s education. Users are given a choice if and how the refined model is used. One option consists in calibrating the aggregate outcomes by sex and province to the base model for all years of birth. In this case, aggregate outcomes remain the same, but the more likely children are chosen to enter and graduate from school. This might be of value when studying the school (and out of school) population by socio-demographic characteristics. The second option calibrates the model just for one birth cohort from which onward the refined module is used. All simulated future trends are then driven entirely by composition effects. These model capabilities allow educational change to be decomposed into changes stemming from inter-generational dynamics, from inter-provincial migration, and from overall trends.
The layout of parameters was chosen to be as intuitive and generic as possible while allowing alternative ways to derive the parameters. As default (integrated into the automated workflow for parameter generation) we use a proportional model (logistic regression) that can distinguish general trends from inter-provincial differences, which are typically very persistent. This allows for both intuitive and alternative scenarios, eg, persistent inter-provincial differences versus convergence scenarios. Odds ratios for the intergenerational progression of education are estimated by logistic regression.
3.10. Primary education grade tracking and school planning
In an optional module, we track students through the primary education grade system. The number of grades is country specific and can be adapted to different school systems. At the end of each school season it is decided who newly enters the school at grade one, who of the active students passed the attended grade, who graduated, who permanently leaves school, and for all others if enrollment is continued or the school career is interrupted by one year. The module builds on the fate model of school entry and success, thus only models the careers of those fated to enter school. Those fated to graduate from school at some point pass all grades. Those fated to drop out accordingly do not pass all grades - the distribution of the highest grade attended being a model parameter.
Another optional module is the school planning module. Based on parameters of current and future target teacher to student ratios and classroom sizes, it calculates the number of teachers and classrooms required for each school year on a regional level.
The parameters of these two modules are scenario-parameters currently not calculated from micro-data. The provided R script integrated into the automated workflow just generates default parameter tables.
3.11. Secondary education
This is an optional module for modeling a secondary school which can be attended after graduating from primary education. The number of grades is country-specific. The model follows a period approach. Each year at the end and beginning of school season it is decided if a person enters school, succeeds a grade, progresses to the next or repeats a grade, interrupts studies or permanently drops out. A parameter controls the maximum number of years which can be delayed due to repetition or temporary dropout. A student interrupting education can resume studies after a year or stay out permanently. The model is driven by parameters for each calendar year and grade.
Besides grade and period, the school progression parameters have two additional dimensions, one for geographical region, the other for personal characteristics. The levels of these two characteristics are country specific. Currently only totals are implemented.
The parameters of this module are currently not estimated or calculated from the micro-data sets, but scenarios must be created by the user, eg, using progression rates as published by UNESCO. The provided R script integrated into the automated workflow just generates default parameter tables.
3.12. First union formation
Changes in the age at first union formation is one of the key mechanisms behind fertility changes. Many developing societies currently experience a rapid increase in that age, partly resulting from educational expansion. Including this variable in the fertility model allows a better depiction of the concentration of reproduction: instead of distributing children to women independent of union status, fertility will be more concentrated to fewer women, especially at young ages, which better reflects reality.
From a modeling perspective, the fast-changing age profile in first union formation poses interesting challenges. Fast demographic change, especially shifts in age profiles, make period data of limited use for modeling. For example, union formation rates decrease fast for the very young, but this observation does not necessarily mean that fewer people enter a union over the life-course, even if union formation rates are currently low at higher ages, where most people observed today have entered a union already. It is in such environment that parametric models demonstrate their power. We implemented the Coale & McNeil approach for modeling entry into first unions. The parameterization of such a model is very intuitive; parameters are the minimum age at first union formation, the average age, and the proportion of women who will eventually enter a partnership. The model was proposed by Coale and McNeil in the 1970s, based on extensive studies on the age pattern of first marriages in many countries. For the countries studied so far (Mauritania, Senegal, Nepal) we found a very good fit and clear trends. Past trends are used to inform a default scenario. These trends can easily be modified by users for creating alternative scenarios. The approach works less well for more developed countries. The provided analysis script includes extensive graphical output for assessing the appropriateness of the approach when porting the model to another country.
Currently DYNAMIS-POP does not track the partnership status over life and does not include partner matching. Family links are currently established only between mothers and children. An alternative module for first union formation, a module for female union status after entering a first union, as well as a partner matching module are under development.
3.13. Child vaccination (Immunization)
This module implements child vaccination. A child is assumed to be immunized if it received a set of vaccines during the first year of life. Immunization is decided at birth and depends on a set of individual and mother’s characteristics. The set of characteristics is country-specific and typically includes sex, mother’s education, region, and ethnicity. An important predictor for child vaccination is whether the mother has received prenatal care. Therefore, in a first step, prenatal care receipt is decided.
The model has two parameters which contain a set of odds of receiving prenatal care respectively all required vaccines. The odds are estimated by logistic regression. The module and its use are illustrated in the application example in Chapter 4.
3.14. Running the model
The model’s graphical user interface allows editing parameter tables, creating and saving new scenarios, running the model, and viewing table output. Table results can be exported to Excel individually or collectively to an Excel Workbook. The application offers scenario control by saving all simulation results together with all parameters. Users can create new scenarios by editing parameters and saving the scenario under a new name. The user interface is fully documented within the application. The menu offers users access to a detailed hyperlinked help file, which covers relevant aspects, such as editing parameters, creating scenarios, options for running the model, and viewing and exporting model results. Like the user interface, the model is also fully documented within the application. Users can access documentation from the help menu, including descriptions of the modules, parameters, model actors, and all table output.
In addition to model parameters, the user also controls some scenario settings. Most importantly, users can choose the time horizon of the simulation and number of replications simulated. When running more than one replicate, all model results are automatically calculated as averages over the replicates and distributional information (eg, the coefficient of variation) is automatically available for each output table cell. This allows users to assess Monte Carlo variation in results.
The model produces two types of output: a collection of tables and micro-data files for (user-) selected moments in time. A special micro-data output feature is the creation of four micro-data files corresponding with the files required for parameter estimation. This allows to compare simulated data with newly available micro-data and supports model validation.
Both micro-data and table output files can be post-processed by statistical packages. Like for parameter estimation and generation, a set of R scripts for scenario comparison and visualization of results including age pyramids by education, and the visualization of regional differences using geographical maps is available on the project website dynamis.ihsn.org.
4. Application example: Child vaccination in Nepal
In this application example we study and project child vaccination in Nepal. Based on data from the 2001 Demographic and Health Survey (DHS) we model immunization rates by a set of individual and mother’s characteristics. One of the main predictors of child vaccination is prenatal care which we model explicitly as well. Regression results are used to parameterize the vaccination module of DYNAMIS-POP. In a set of what-if scenarios, we project the change of immunization rates resulting from ongoing socio-demographic changes (our base scenario) as well as of hypothetical improvements in closing gaps between ethnic groups and regional gaps in immunization, and prenatal care. As the simulations are based on 2001 data, projections can be directly compared to observed outcomes. We perform such a comparison with 2011 DHS data. This application intends to demonstrate the use of DYNAMIS-POP for the analysis of child vaccination and – by performing retrospective projections - to contribute to its validation. Immunization is a standard module of DYNAMIS-POP. As the case for all standard modules of DYNAMIS-POP, the statistical analysis presented in this contribution is produced by a generic R script being part of the highly automated work-flow for parameter estimation and generation. This allows to easily replicate the analysis for other countries.
In the context of a general introduction of DYNAMIS-POP and its potential use, child vaccination was chosen also as it provides a typical example how a new module and corresponding analysis can be added to the model. As the case for all model development steps, the module as well as the analysis script are fully documented on the project website, which also contains step-by-step instructions how the presented simulation analysis can be replicated.
4.1. Data and variables
A child is assumed to be immunized if it received the 8 doses of vaccines during the first year of life required for obtaining immunity against tuberculosis, diphtheria, pertussis, tetanus, polio and measles. The analysis is based on one of the four standardized files – the child record file - required by DYNAMIS-POP. In the case of Nepal, this file is generated from the Demographic and Health Survey (DHS) birth records (NPBR41FL/2001, NPBR60FL/2011), with mother’s characteristics linked from the female individual records (NPIR41FL.DTA/2001, NPIR60FL.DTA/2011). The regression analysis focuses on one-year old children when measuring the coverage of immunization programs, which is the dominant approach in literature. Accordingly, our analysis and regression models are very similar and consistent with available literature on child vaccination in Bhandari et al. (2007) studying the “Sociocultural and Geographical Disparities in Child Immunization in Nepal “, and Shanta and Lee (2011) studying the role of women’s empowerment as determinants of child immunization in Nepal. For a critical assessment of this approach based on a study in Nepal see Hughes et al. (2016) We use six explanatory variables:
Sex
Region: The five development regions of Nepal, which are the Eastern, Central, Western, Mid-Western, and Far-Western Region.
Mother’s primary education: (1) never entered primary; (2) some primary, (3) graduated from primary education, or higher.
Ethnicity: 7 groups, consistent both with the (more detailed classification) currently used in the DYNAMIS-POP starting population and classifications found in literature and used in DHS, especially Bennett et al. (2008) and The World Bank (2006); see Table 1 .
Mother’s age at birth of the child. Immunization rates have an age profile, with immunization rates higher the younger the mother. The exception are very young mothers (up to age 17). We interpret this pattern as a combination of cohort effects (four cohorts) and an age effect of very young mothers. Thus, in the simulation we assume that immunization rates will increase with more recent birth cohorts of mothers replacing older birth cohorts, while keeping the negative effect of very young mothers.
The receipt of prenatal care: In the Nepal 2001 DHS, this information is only collected for the most recent birth; in cases where the studied one-year old children have zero-year-old siblings, we use the variable as proxy.
A simplified classification of caste and ethnicities in Nepal according to the The World Bank (2006) study on „Unequal Citizens. Gender, Caste and Ethnic Inclusion in Nepal
| % Total population | GSEA / NLSS II (10 groups) | 2001 census (103 groups) |
|---|---|---|
| Hindu caste groups (57.5%) | 1.BC (Hill) | Brahman, Chhetri, Thakuri, Sanyasi |
| 2.BC (Tarai) | Kayashta, Rajput, Baniya, Marwadi, Jaine, Nurang, Bengali | |
| 3.Tarai Middle Castes | Yadev,Teli, Kalwar, Sudi, Sonar, Lohar, Koiri, Kurmi, Kanu, Haluwai, Hajam/Thakur, Badhe, Rajbhar, Kewat Mallah, Numhar, Kahar, Lodha, Bing/Banda, Bhediyar, Mali, Kamar Dhunia | |
| 4.Dalits (Hill) | Kami, Damai, Sarki, Gaine, Badi | |
| 5.Dalits (Tarai) | Chamar, Musahar, Tatma, Bantar, Dhusadadh/Paswan, Khatway, Dom, Chidimar, Dhobi, Halkhor, Unidentified Dalit | |
| Janajatis (37.2%) | 6.Newar | All Newari Castes |
| 7.Janajatis (Hill) | Magar,Tamang, Rai, Gurung, Limbu, Sherpa, Bhote, Walung, Buansi, Hyolmo, Gharti/Bhujel, Kumal, Sunuwar, Baramu, Pahari, Adivasi Janajati, Yakkha, Shantal, Jirel, Darai, Dura, Majhi, Dunuwar, Thami, Lepcha, Chepang, Bote, Raji, Hayu,Raute, Kasunda | |
| 8.Janajatis (Tarai) | Tharu, Dhanuk, Rajbanshi, Tajpuriya, Gangai, Dhimal, Meche, Kisan, Munda, Santhal/Satar/Dhangad/Jhangad, Koche, Pattarkatta/Kusbadiya | |
| Muslims (4.3%) | 9.Muslims | Muslim, Churoute |
| Others (1%) | 10.Others |
The ethnic groups are:
Brahman/Chhetri - Higher Castes. (Groups 1 and 2 of the The World Bank, 2006 classification)
Tarai/Madhesi - Middle Castes. (Group 3 of the The World Bank, 2006 classification)
Hill Dalits - Low Castes Hill (Group 4 of the The World Bank, 2006 classification)
Tarai/Madhesi Dalits - Low Castes Other (Group 5 of the The World Bank, 2006 classification)
Newar and Janajati. (Groups 6–8 of the The World Bank, 2006 classification)
Muslims. (Group nine in the The World Bank, 2006 classification)
Others (Group 10 in the The World Bank, 2006 classification)
Officially abolished in 1963, caste-based discrimination, while diluted, remains a problem in Nepal. Dalits -"untouchable"- are at the bottom of Nepal’s caste hierarchy. (The World Bank, 2006, p14). Hill Dalits are less disadvantaged than other Dalits, which also holds true for immunization rates as found by Bhandari et al. (2007). Accordingly, in our analysis, we distinguish Hill Dalits from other (Tarai/Madhesi) Dalits. Another marginalized population group in Nepal, outside of the Hindu caste system, is the Muslim population.
While the selection of explanatory variables is highly pragmatic, ie, based on the set of variables readily available in DYNAMIS-POP, it coincides with the most important predictors of child vaccination found in literature. This is especially true for mother´s education which is a key measure of women’s empowerment. E.g. Shanta and Lee (2011) - based on 2006 DHS data - found that „... the odds of being fully immunized for children of mothers with secondary education were 5.91 times the odds for children of mothers without any formal education [while] other measures of women’s empowerment – women’s age at birth of first child, gap in age between spouses, women’s knowledge about sexually-transmitted diseases, their role in intra-household financial, health and mobility decisions, and their perceptions toward wife beating – were not associated with child immunization.“. In explicitly modeling prenatal care as part of the immunization module, we follow Shanta & Leea who found, that "among control variables, mothers who received antenatal care were 3.31 times as likely to immunize their children as mothers who did not receive any antenatal care. Other such barriers to health service use such as cost of care, distance to health services, and quality of health services were not significant." (Shanta and Lee, 2011, p642).
4.2. Descriptive analysis
The cross-tabulations of prenatal care and immunization rates presented in Table 2 show a wide variation of the studied rates by each of the control variables in 2001. Both prenatal care and immunization rates improved considerably by 2011, while most regional and ethnical differences diminished. This is especially the case for Dalits who were in the focus of policy and institutional initiatives by national and international actors, as documented in Bhattachan et al. (2009). Of the ethnic groups distinguished in our analysis, only the Muslim population lags behind in immunization rates, while - interestingly - prenatal care rates have fully caught up with all population groups.
Descriptive results of prenatal care and immunization rates. Source: DHS 2001 and DHS 2011, own calculations
| Prenatal care | Immunization DHS 2001 | Immunization DHS 2011 | |||||
|---|---|---|---|---|---|---|---|
| DHS 2001 | DHS 2011 | No Prenatal Care | Prenatal Care | All DHS 2001 | All DHS 2011 | ||
| Region | Eastern | 56.5% | 90.6% | 61.7% | 83.7% | 74.1% | 87.7% |
| Central | 54.1% | 84.7% | 46.6% | 72.3% | 60.5% | 83.1% | |
| Western | 55.2% | 84.1% | 44.2% | 81.5% | 64.8% | 91.2% | |
| Mid-West | 38.2% | 82.1% | 60.4% | 85.2% | 69.9% | 84.7% | |
| Far-West | 35.5% | 91.4% | 44.3% | 89.7% | 60.4% | 93.7% | |
| Ethnicity | Brahaman/Chhetri | 53.5% | 89.7% | 58.8% | 90.2% | 75.6% | 90.7% |
| Tarai/Madhesi | 54.6% | 91.1% | 41.5% | 66.4% | 55.1% | 82.0% | |
| Hill Dalits | 44.4% | 86.8% | 53.0% | 83.9% | 66.7% | 87.0% | |
| Tarai/Madhesi Dalits | 54.6% | 89.0% | 37.6% | 39.7% | 38.8% | 83.8% | |
| Newar/Janajati | 49.3% | 80.5% | 56.0% | 89.0% | 72.3% | 93.5% | |
| Muslim | 49.9% | 89.8% | 28.7% | 47.1% | 37.9% | 57.4% | |
| Other | 39.1% | -- | 46.3% | 57.1% | 50.5% | -- | |
| Education of mother | Never entered school | 40.2% | 79.6% | 47.7% | 71.8% | 57.4% | 78.1% |
| Primary school dropout | 58.0% | 88.2% | 78.1% | 86.8% | 83.1% | 92.9% | |
| Primary and above | 86.2% | 93.0% | 71.1% | 92.2% | 89.3% | 94.8% | |
| Mother’s age | >30 | 34.9% | 70.7% | 47.9% | 73.5% | 56.8% | 82.4% |
| 26–30 | 43.7% | 85.1% | 48.9% | 77.0% | 61.2% | 86.7% | |
| 21–25 | 52.6% | 90.4% | 52.9% | 84.1% | 69.3% | 87.8% | |
| 18–20 | 65.0% | 89.5% | 63.2% | 79.7% | 73.9% | 88.2% | |
| <18 | 62.8% | 90.6% | 48.9% | 80.7% | 68.9% | 89.1% | |
| Sex | Female | 47.8% | 84.4% | 50.6% | 79.4% | 64.3% | 85.7% |
| Male | 53.0% | 88.1% | 53.3% | 80.5% | 67.7% | 88.2% | |
| Prenatal care | No | -- | -- | -- | -- | 51.8% | 70.3% |
| Yes | -- | -- | -- | -- | 79.9% | 89.6% | |
| TOTAL | 50.3% | 86.2% | 51.8% | 79.9% | 65.9% | 87.0% | |
Universal immunization is a national health priority in Nepal - the government’s target is to achieve and maintain at least a 90% vaccination rate at both the national and district levels (see e.g. the „Comprehensive Multi-Year Plan 2011–2016 of the Child Health Division (2011)“. DHS data are consistent with data collected by the EPI (Expanded Program on Immunization) coverage survey performed in 2009, which shows an overall 88% coverage for all antigens. EPI data also confirm the low variation among development regions found in the more recent DHS data set.
4.3. Regression analysis
To model prenatal care receipt and child vaccination, we use logistic regression models based on DHS data. The model for child vaccination is very similar to models found in literature, especially Bhandari et al. (2007) and Shanta and Lee (2011). Results of estimates from 2001 DHS are consistent with literature and most variables are significant. In estimates from 2011 DHS, both the regional and ethnical variations lose statistical significance - reflecting the narrowing gaps between population groups and possibly also the smaller sample size 2011.
The model for prenatal care as well as the two separate models of immunization by mother’s receipt of prenatal care are estimated as part of the DYNAMIS-POP standard automated work-flow for parameter generation and feed into the following microsimulation analysis.
4.4. Simulation projections
In the presented simulation analysis, we apply DYNAMIS-POP for projecting prenatal care and immunization rates into the future. DYNAMIS-POP produces detailed regional population projections including all variables required in our study. The base scenario runs DYNAMIS-POP "out of the box", ie, with the default model parameters produced by a series of documented analysis (R) scripts available online with the project. The starting population is based on the 2001 population Census with some corrections made for removing age-heaping and the underreporting of children. Parameters were estimated from 2001 Census and 2001 DHS data.
The changes in prenatal care and immunization rates in the base scenario are entirely driven by composition effects, most importantly by improvements in education. Concerning education, DYNAMIS-POP continues recent (logarithmic) trends. Alternative scenarios were created by linearly changing selected odds ratios (displayed in Table 3) over a 10-year transition period 2002–2011.
Regression results of logistic regression models for prenatal care and immunization based on DHS 2001 and DHS 2011 data. Own calculations. The coefficients are expressed as odds ratios
| Prenatal care | Immunization DHS 2001 | Immunization | ||||||||
|---|---|---|---|---|---|---|---|---|---|---|
| DHS 2001 | No Prenatal Care | Prenatal Care | All | DHS 2011 | ||||||
| Constant | 0.626 | ** | 1.709 | 5.213 | *** | 2.419 | *** | 3.986 | *** | |
| Male (Female reference) | 1.299 | 1.052 | 1.260 | * | 1.248 | |||||
| Mother entered primary school (No school reference) | 1.743 | ** | 3.926 | *** | 1.487 | 2.978 | *** | 2.779 | ** | |
| Mother graduated primary education | 7.590 | *** | 2.700 | * | 2.424 | * | 4.347 | *** | 3.444 | *** |
| Central region (Eastern region reference) | 0.951 | 0.526 | * | 0.591 | . | 0.581 | *** | 0.786 | ||
| Western region | 0.754 | 0.407 | ** | 0.612 | 0.479 | *** | 0.923 | |||
| Mid-Western region | 0.528 | ** | 0.711 | 0.782 | 0.647 | * | 0.680 | |||
| Far-Western region | 0.459 | *** | 0.336 | ** | 0.962 | 0.374 | *** | 1.643 | ||
| Tarai/Madhesi (Brahaman/Chheri reference) | 0.447 | * | 0.360 | * | 0.457 | *** | 0.728 | |||
| Hill Dalits | 0.878 | 0.750 | 0.851 | 0.843 | ||||||
| Tarai/Madhesi Dalits | 0.399 | . | 0.107 | *** | 0.240 | *** | 1.059 | |||
| Newar and Janajati | 0.758 | 1.091 | 0.835 | 1.654 | ||||||
| Muslim | 0.263 | ** | 0.147 | *** | 0.231 | *** | 0.235 | *** | ||
| Other | 0.570 | 0.185 | *** | 0.355 | *** | |||||
| Mother’s birth cohort 1 (25–29 at birth; 30+ reference) | 1.199 | 1.129 | 1.263 | 1.185 | 1.245 | |||||
| Mother’s birth cohort 2 (20–24 at birth) | 1.485 | * | 1.192 | 2.043 | * | 1.470 | ** | 1.170 | ||
| Mother’s birth cohort 3 ( ≤ 20 at birth) | 2.326 | *** | 1.903 | * | 1.441 | 1.808 | *** | 1.411 | ||
| Young Mother (age <18; 18+ reference) | 0.819 | 0.408 | . | 0.919 | 0.586 | ** | 0.863 | |||
| Sample size (n) | 1,295 | 649 | 646 | 1,295 | 943 | |||||
Prenatal care scenarios: We create two alternative scenarios, one closing the gaps between regions (all groups approaching the higher odds ratios of the Eastern region - the reference category - within 10 years). The second alternative scenario eliminates all differences by region and education within the 10-year transition period. (Table 4).
DYNAMIS-POP simulation projections for prenatal care, three scenarios
| Prenatal care scenarios | Prenatal care rate | |||
|---|---|---|---|---|
| 2002 | 2012 | 2022 | 2032 | |
| Scenario X0 - Base (used in immunization scenarios A0 and A1) | 52.0% | 67.2% | 76.0% | 81.5% |
| Scenario X1 - Closing regional gaps (used in A2 and A3) | 52.0% | 71.7% | 79.9% | 84.8% |
| Scenario X2 - Closing all prenatal care gaps (use in A4 and A5) | 52.0% | 90.7% | 91.6% | 91.7% |
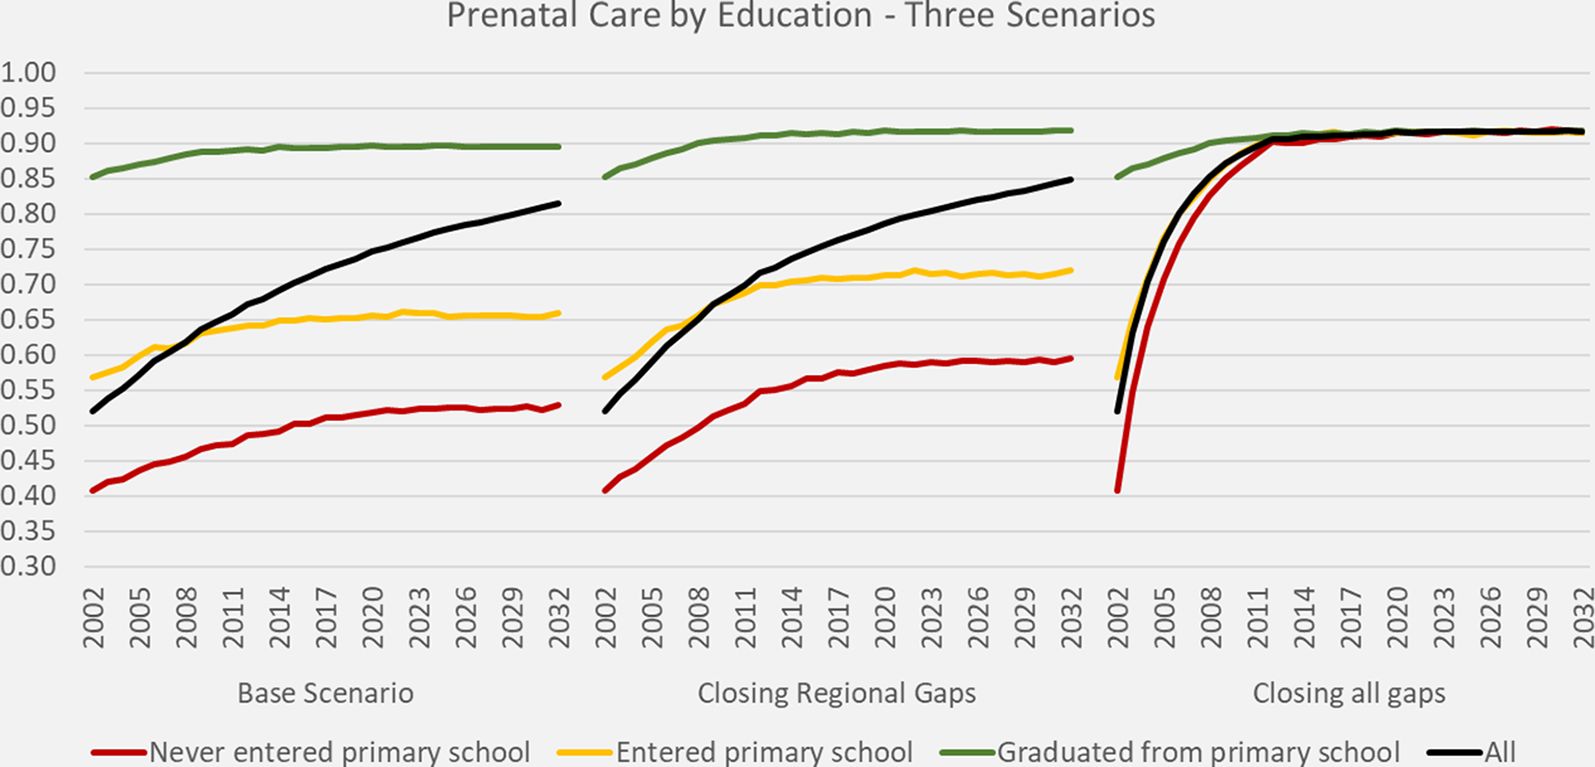
Figure 1 depicts the projected prenatal care rates of the base and two alternative scenarios by education. In the base scenario, within education groups rates initially increase by the modeled cohort effects but these increases level off when all women giving birth are born after 1980. The biggest increase of overall rates can be attributed to the educational expansion. When closing all gaps - including between education groups - as in Scenario X2, from 2011 onwards a universal prenatal care rate above 90% is reached.
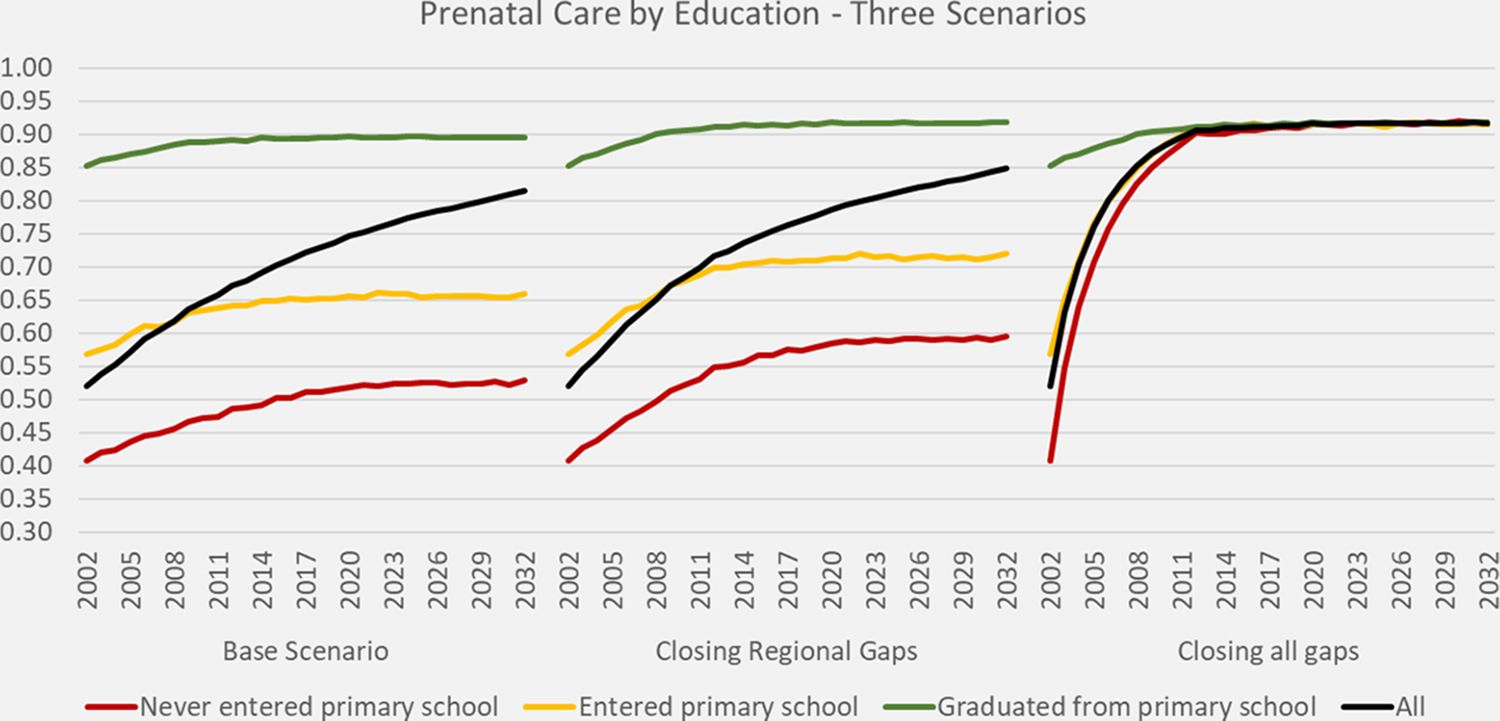
DYNAMIS-POP simulation projections for prenatal care, three scenarios.
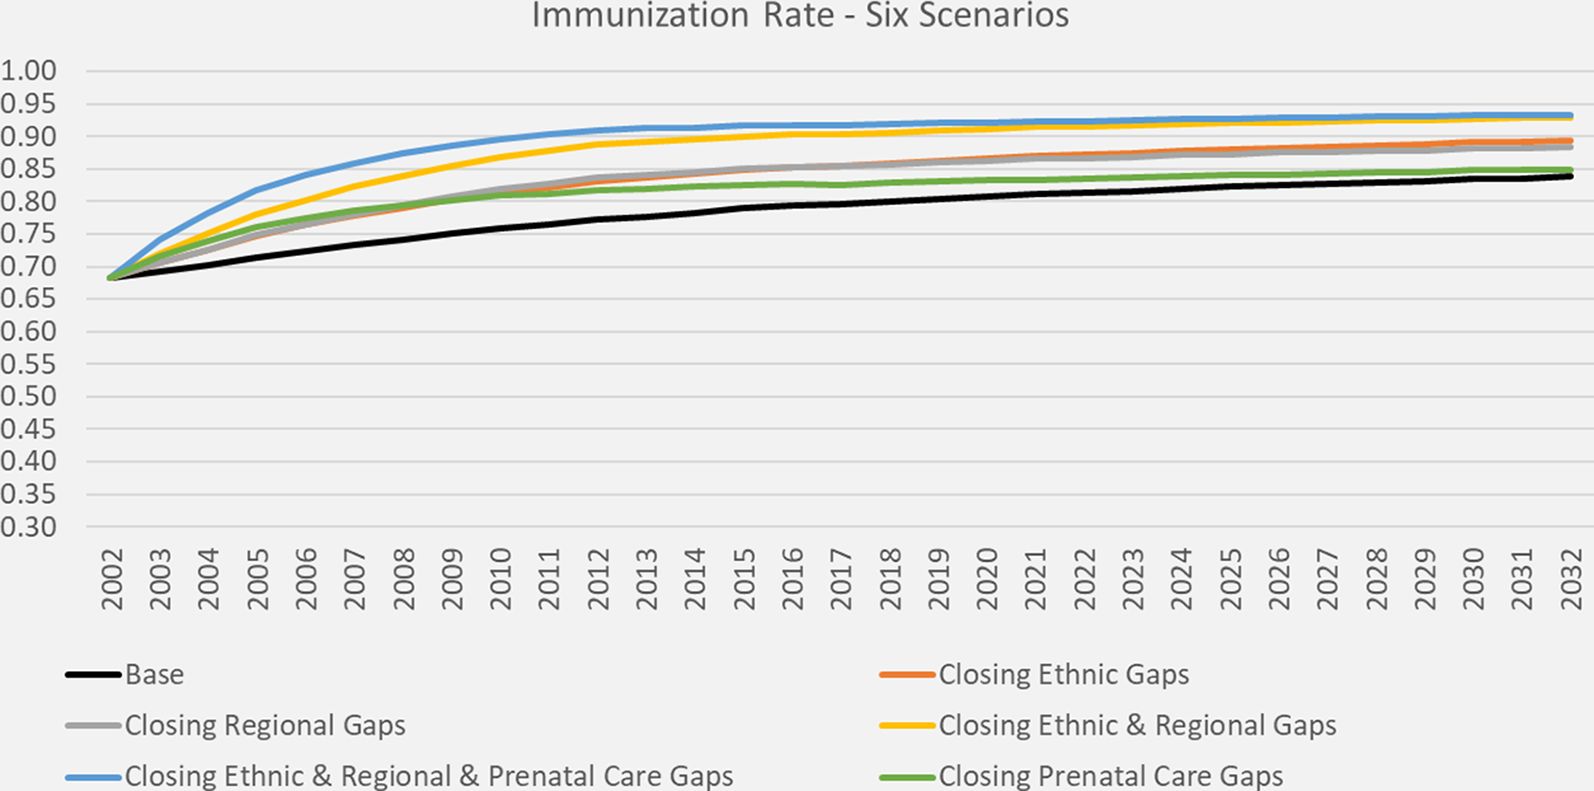
Immunization scenarios: In the base scenario for child vaccination immunization rates would increase from 68% in 2001 to 77% in 2011. We create five alternative scenarios, which combine the scenarios for prenatal care with scenarios of closing ethnic, a/o regional gaps in immunization. Depending on the scenario, aggregate immunization rates will increase to between 83% and 91% in 2011; see (Table 5)
DYNAMIS-POP simulation projections for immunization rates, six scenarios
| Immunization scenarios | Immunization rate | |||
|---|---|---|---|---|
| 2002 | 2012 | 2022 | 2032 | |
| Scenario A0 - Base (prenatal care scenario X0 - Base) | 68.1% | 77.2% | 81.3% | 83.8% |
| Scenario A1 - Closing ethnic gaps (prenatal care scenario X0 - Base) | 68.2% | 83.2% | 87.1% | 89.3% |
| Scenario A2 - Closing regional gaps (prenatal care scenario X1 - closing regional gaps) | 68.2% | 83.8% | 86.6% | 88.3% |
| Scenario A3 - Closing ethnic & regional gaps (prenatal care scenario X1 - closing regional gaps) | 68.2% | 88.8% | 91.5% | 92.8% |
| Scenario A4 - Closing ethnic & regional & all prenatal care gaps (prenatal care scenario X2) | 68.2% | 91.0% | 92.4% | 93.2% |
| Scenario A5 - Closing prenatal care gaps only (prenatal care scenario X2) | 68.1% | 81.7% | 83.5% | 84.9% |
Figure 2 depicts the increase in immunization rates in the base scenario by mother’s education and receipt of prenatal care. Within educational groups, changes are mostly driven by cohort effects (which were slightly negative for mothers who received prenatal care). Aggregate rates increase driven by the educational expansion. While primary school graduation was highly correlated with receiving prenatal care, the small group of graduates who have not received prenatal care have lower immunization rates as primary school dropouts – a typical selection effect.
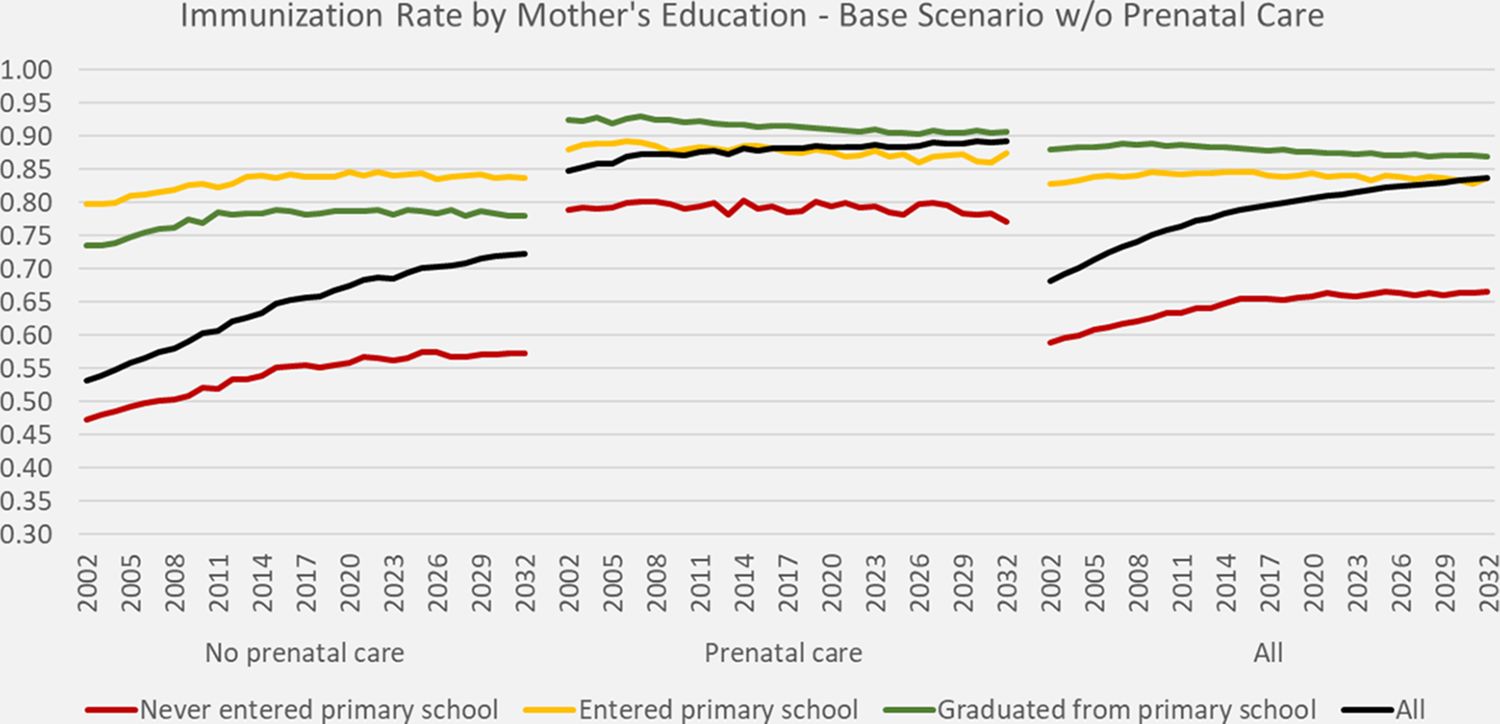
DYNAMIS-POP simulation projections for immunization rates by mother’s education, base scenario w/o prenatal care.
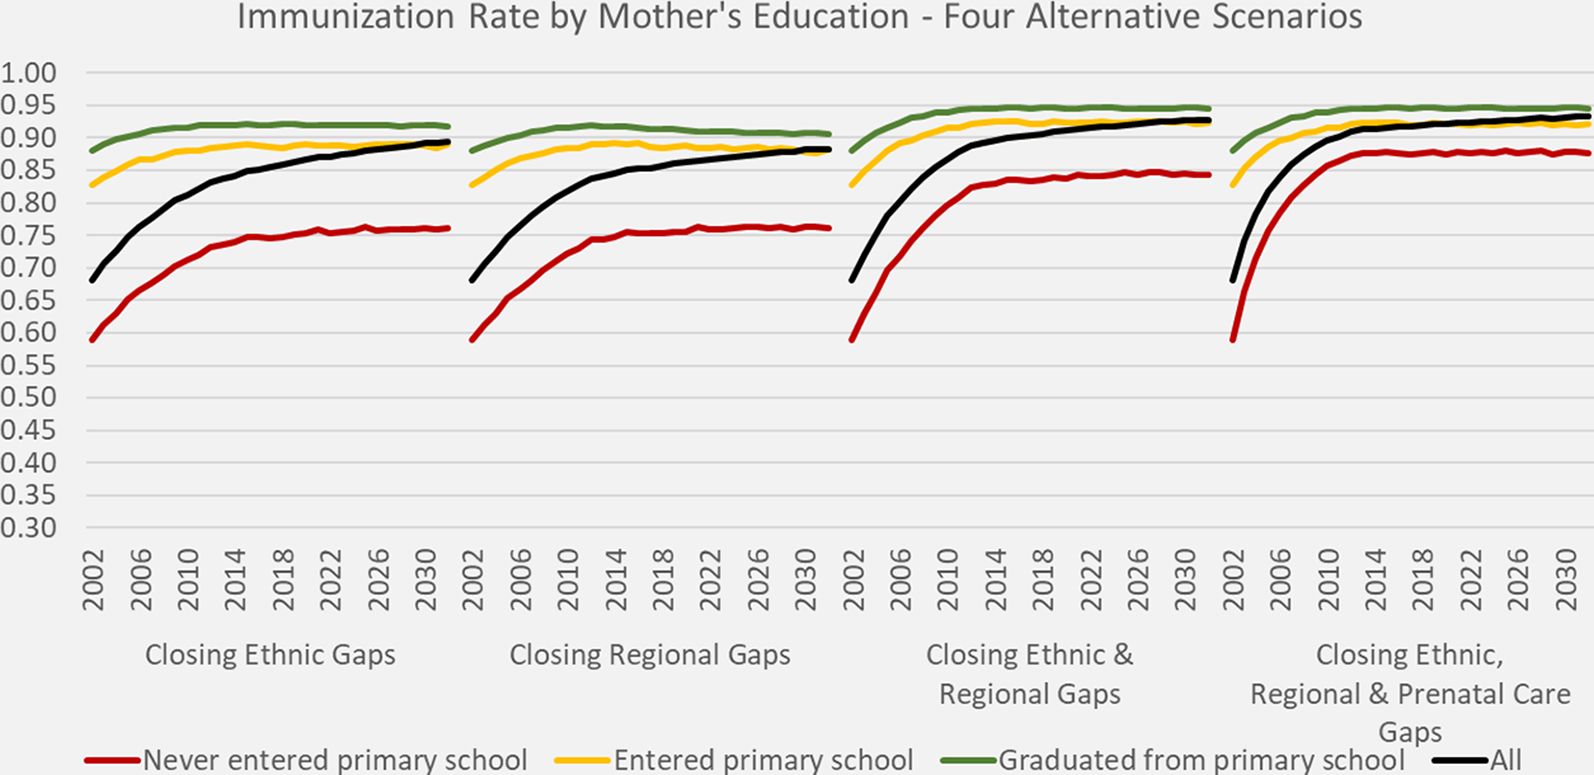
The base scenario indicates, that without policy interventions addressing the gaps in prenatal care and immunization by region and ethnicity, a target immunization rate of 90% cannot be reached even in presence of the projected educational expansion towards universal primary education. By closing either the ethnical or the regional gaps alone, 90% of immunization would be reached around 2030; by simultaneously addressing both gaps, the 90% goal would be reached by around 2015. If, in addition, 90% of pregnant women would receive prenatal care independent of education, ethnicity and region by 2011, the 90% child vaccination rate would be achieved within 10 years. (Figure 3)

DYNAMIS-POP simulation projections for immunization rates by mother’s education, four alternative scenarios.
When comparing all six scenarios (Figure 4), in the long run – by around 2030 – we see three different outcomes. In both the base scenario and the scenario of closing all gaps in prenatal care, immunization rates level off at round 85%. The difference between the two scenarios is the speed in which this level is reached as improved prenatal care has immediate effects, while relying on the ongoing educational improvements – the main driver of prenatal care in absence of other policy interventions – plays out much slower. The same holds true when comparing the two scenarios closing all regional and ethnical gaps eventually leading to immunization rates close to 95%. Again, adding improvements in prenatal care speeds up this process. The two scenarios which only address one gap each – ethnical differences and regional variations – have almost identical effects over the whole projection horizon levelling off at around 90%.

DYNAMIS-POP simulation projections for immunization rates, six scenarios.
4.5. Discussion and validation
The different what-if scenarios demonstrate the effect of potential policy interventions addressing gaps in prenatal care and immunization by ethnicity and region in a society experiencing rapid improvements in primary education which itself positively impacts the outcomes. Both prenatal care and immunization rates improved considerably between 2001 and 2011, while – as 2011 data show - most regional and ethnical differences diminished or disappeared altogether. Of the different scenarios, the scenario of closing all ethnical and regional gaps in immunization corresponds very closely to the observed improvements. Our analysis also shows, that composition effects – mainly due to improvements in education - alone would have increased immunization rates by 8 percent points, or around 40% of the total improvement, while 60% would not have happened without additional policies addressing the unequal access to prenatal care and immunization.
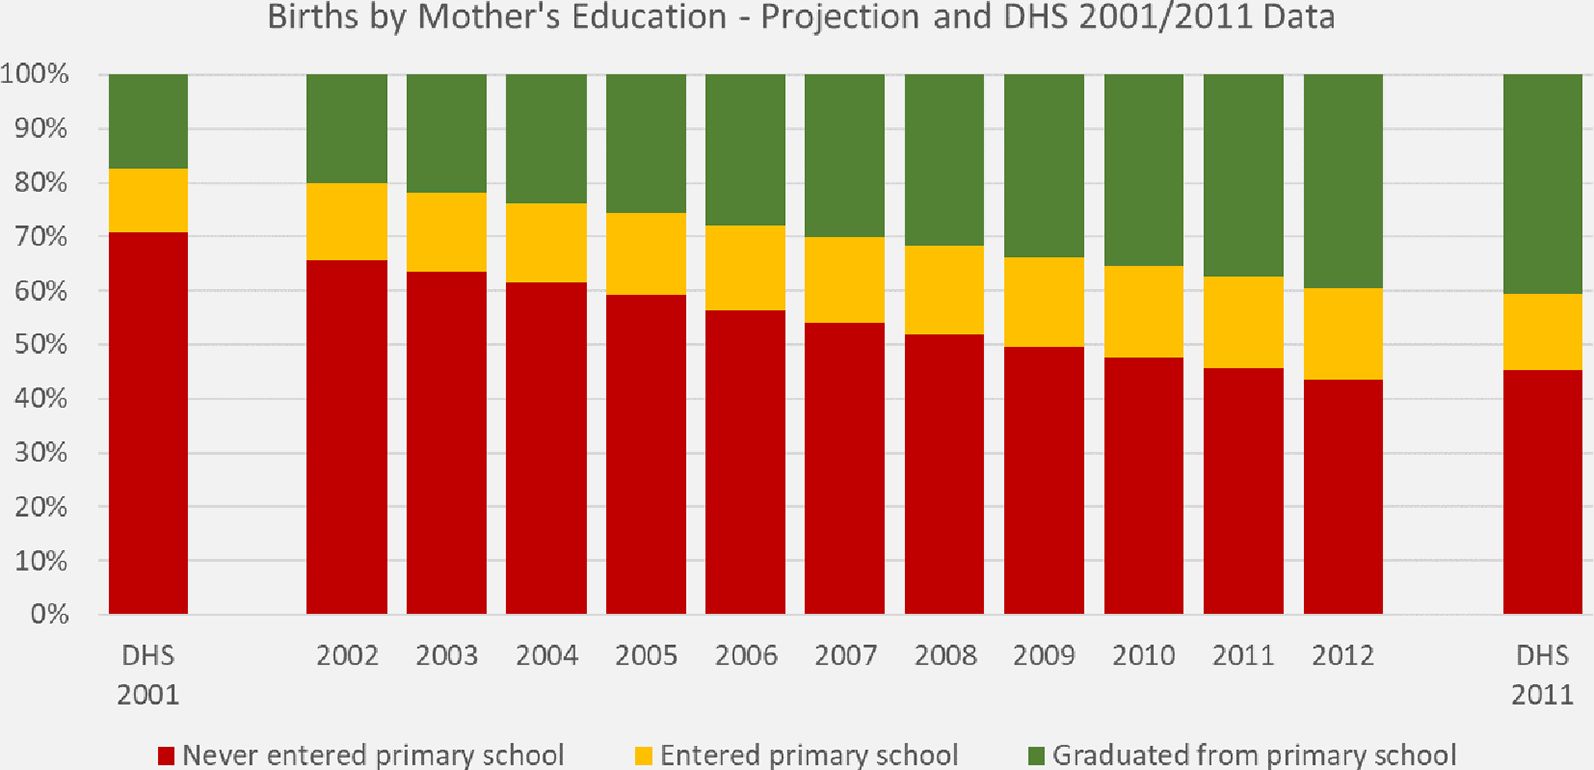
In the following we compare the immunization rates projected by the scenario which closes all regional and ethnical gaps with DHS data and decompose the improvements into composition effects and the contribution added by closing the considered gaps. While closing gaps is a what-if scenario, the projected composition of mothers by education depends on the validity of the education variable in the starting population as well as the models for fertility and education. We use the default parameterization both for the fertility module (which accounts for education) and the education model which contains a (logarithmic) trend variable informed by the recent increases observed in the data. The education variable in the staring population as well as the education models are based on Census data. A comparison of the composition of mothers by education with DHS data for 2001 and 2011 show a very good correspondence of the initial education composition at the start of the simulation as well as the projected distribution 10 years later. The first birth cohort produced in the simulation is the 2001 birth cohort. As we study the immunization rates of one-year old, this cohort cannot be directly compared with the observations in 2001 DHS data, but - as displayed in Figure 5 – the differences between DHS 2001 and the simulated outcomes for 2002 are well in line with the trends.

Distribution of mother’s education of one-year old children. DYNAMIS-POP projection and DHS data.
Given the good fit of the projected with the observed education composition of mothers and the persistent relative differences of immunization rates by mother’s education between 2001 and 2011 (see Table 3 for estimation results based on 2001 and 2011 data) the base scenario provides a very realistic projection of increases in immunization rates resulting entirely by composition effects.
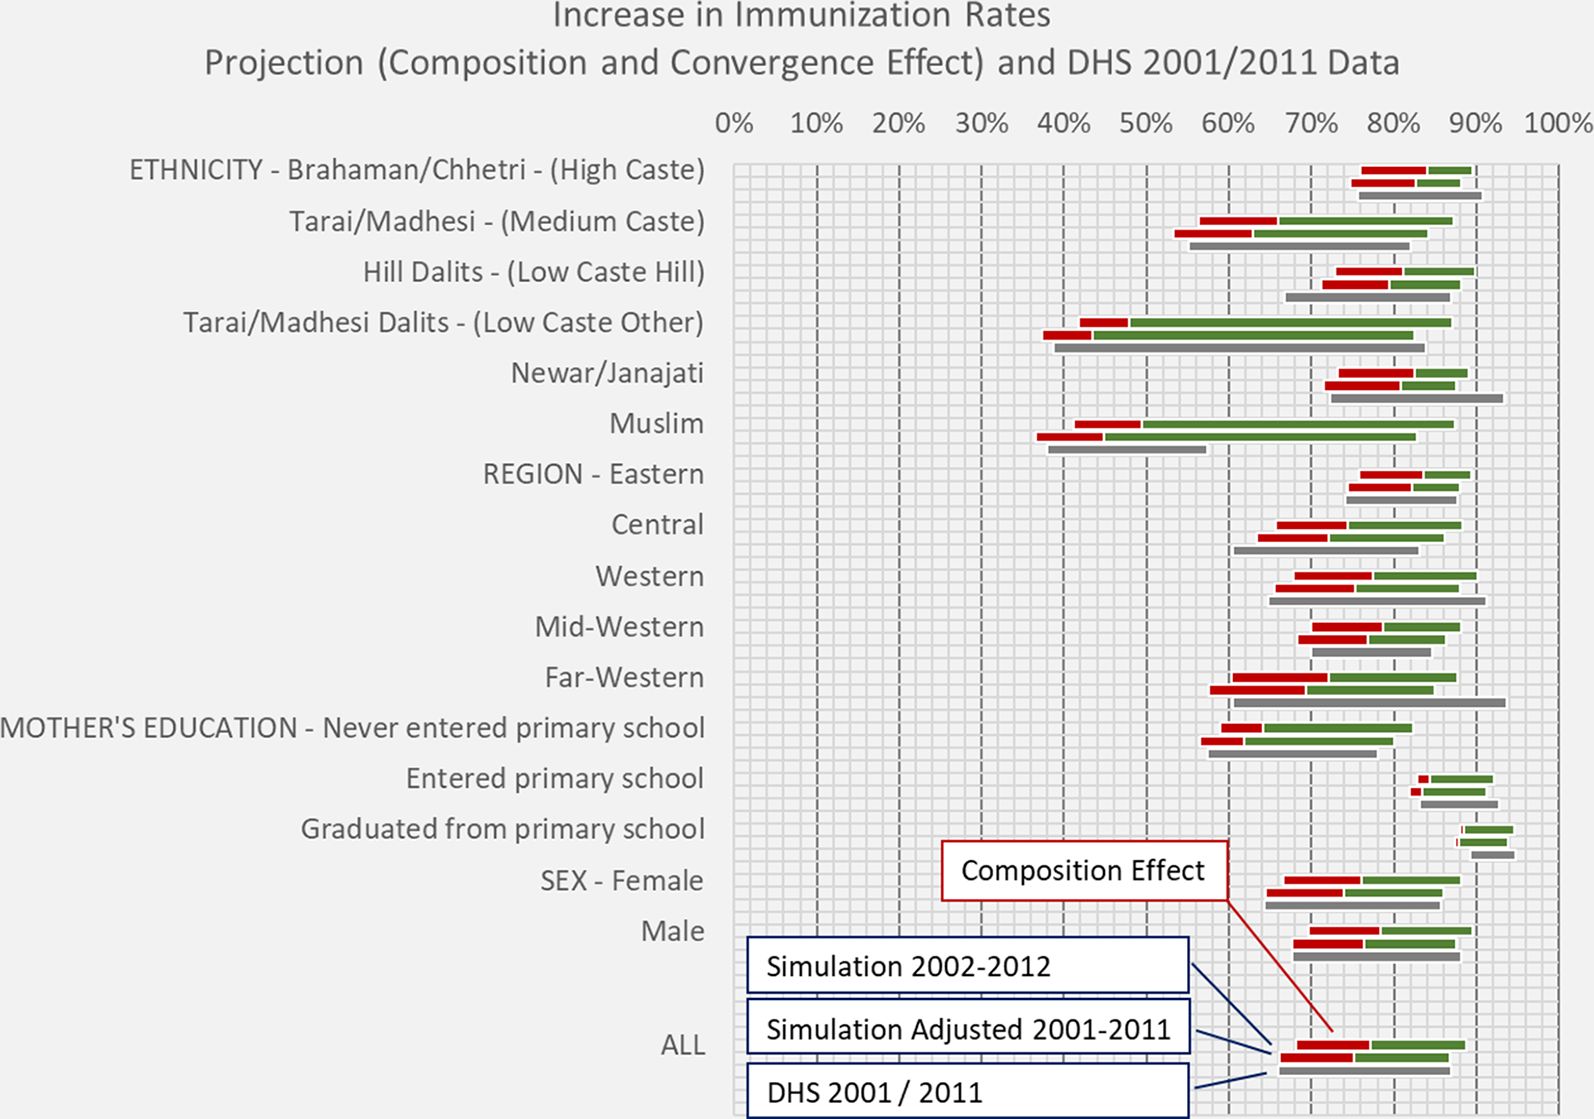
In Figure 6 we depict the increases in immunization rates by region, ethnicity, mother’s education, and sex projected in the base scenario (the red bars) and how these improvements are further augmented by closing the regional and ethnical gaps in immunization (the green bars). The graph also compares the increase in immunization rates between projected values and DHS. As the first year of the simulation corresponds to one-year old in 2002 vs 2001 in the DHS data, the graph also includes adjusted projections corresponding to the DHS timeframe. (This is done by shifting the bars to the left by the average yearly increase in immunization rates within each group).

Increase in immunization rates: projected total increases and increases due to composition effects.
Overall, the projection scenario almost exactly coincides with the observed changes in immunization. Consistent with the scenario assumption of disappearing gaps between ethnicities and between regions, we see impressive increases in immunization rates in initially very disadvantaged groups. Comparing ethnical groups, middle and lower castes (Dalits having been explicitly in the focus of targeted policies) almost completely caught up, improvements in observed rates coming very close to projections. The exception concerning ethnicities is the Muslim population where improvements stayed modest.
While the presented retrospective projection of immunization rates almost exactly coincides with later observations, the projection of course was not a forecast, as most of the increase (around 60%) stems from a what-if scenario (closing all regional and ethnical gaps) chosen from a set of what-if scenarios. Nevertheless, the presented example demonstrates that the “out of the box” population and education projections of the model, combined with what-if scenarios in changes in the variation of prenatal care and immunization by region and ethnicity can project very realistic pathways of improvements in outcomes in the context of fast socio-demographic change.
5. Summary and Outlook
DYNAMIS-POP is a multi-purpose model with a wide field of potential applications including regional population, education, health, and sociodemographic projections. The project aims to demonstrate how dynamic micro-simulation can use available data from multiple sources to inform development policies and research on development issues. As a portable model it can be easily adapted to most developing countries and/or be based on more recent data. The model can be used as is or adapted and extended to meet specific needs. The model and all analysis steps for parameter estimation are fully documented at http://dynamis.ihsn.org/.
The model remains in active development. Modules currently under development include (1) partnership status, partner matching and the maintenance of family links, (2) work migration and back-migration, and (3) enhancements in the modeling of secondary and higher education. Also, solutions to exploit geo-spatial data will be developed and integrated, allowing finer geographic disaggregation of the model’s input and output.
Appendix 1
Supplementary material
DYNAMIS-POP is fully documented at dynamis.ihsn.org. The project website includes an extensive report, a User Guide, and downloads of analysis scripts, the model code, the model executable, and test data for an imaginary country. The DYNAMIS-POP User Guide includes detailed instructions on how to reproduce the presented analysis.
Dealing with micro-data issues
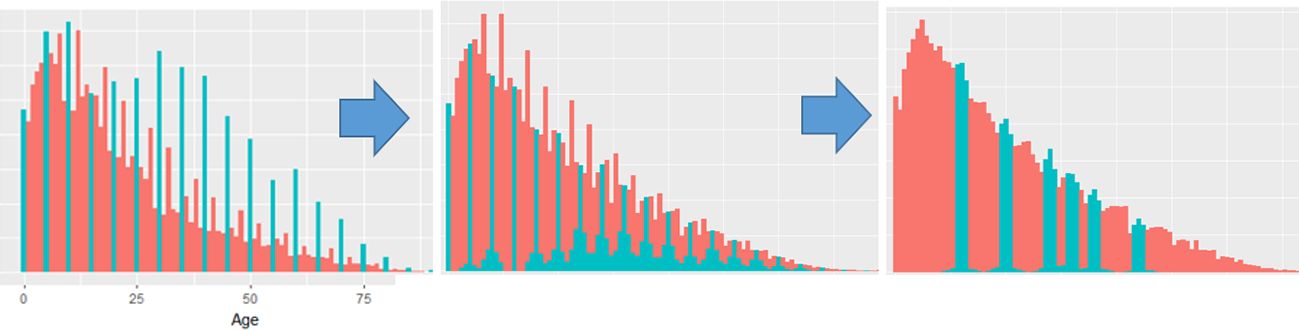
The quality of DYNAMIS-POP projections depends on the quality of data; a suite of statistical tools (R simPop package; Templ et al., 2019) addressing common data issues was developed in a complementary project. In the case of Nepal, detected – and treated - issues include age heaping (Appendix 1—Figure 1) and the under-reporting of children.

Age heaping in the 2001 Census of Nepal and its treatment preparing data for DYNAMIS-POP.
The under-reporting of young children in the Census is noticeable in a comparison of DHS with Census data. A second way is back-projecting the number of children from the 2011 Census (10–14-year-old born in Nepal; accounting for mortality) (Appendix 1—Figure 2)
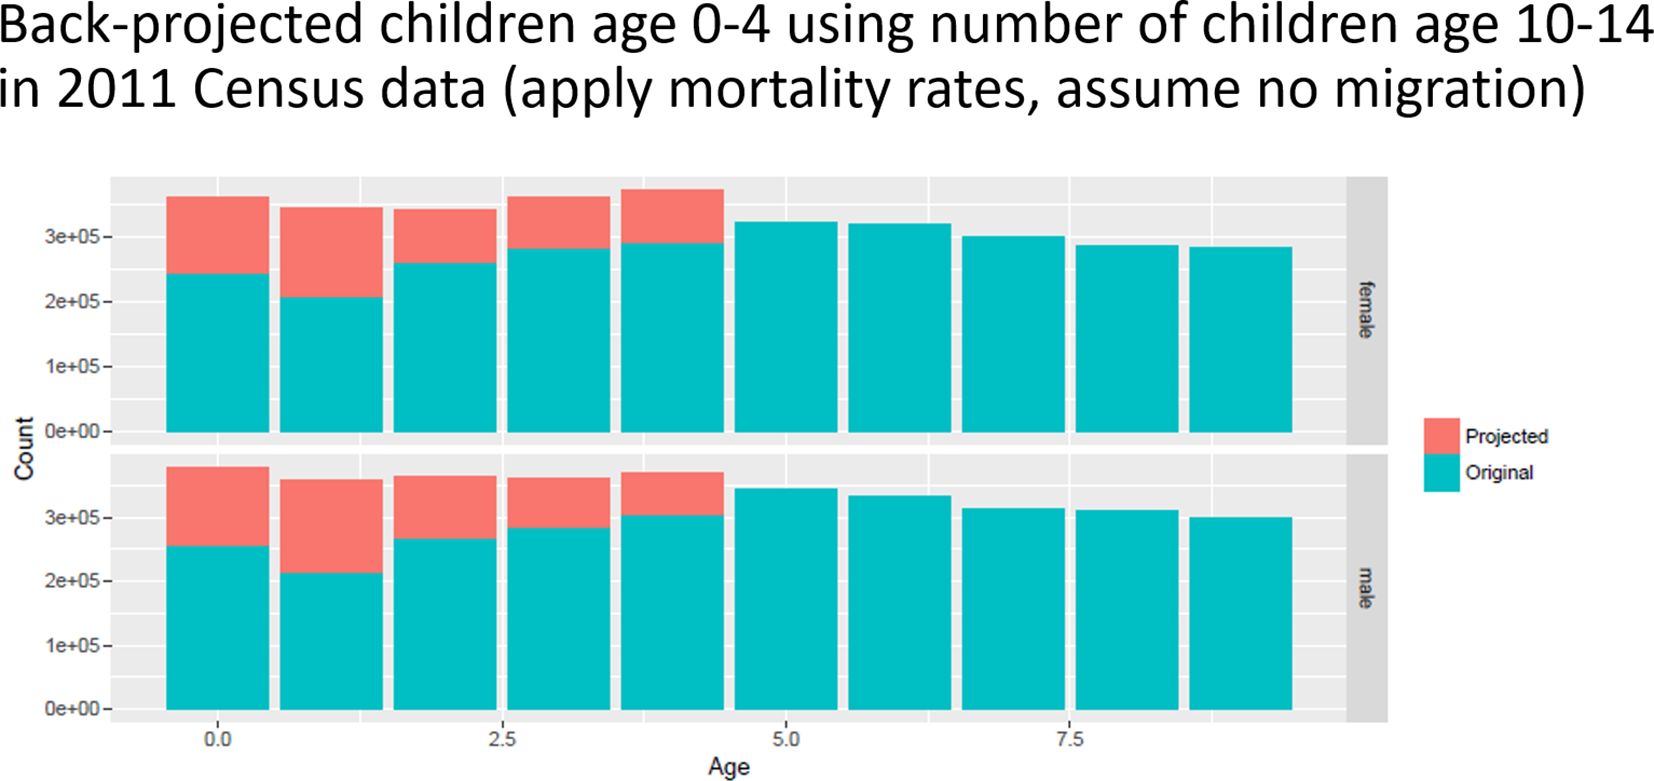

Underreporting of young children in the 2001 Census of Nepal. The red bars are ‘missing children’ when back-projecting children 0–4 using the number of children born in Nepal age 10–14 in the 2011 Census.
In the case of Nepal, the back-projected number of children is consistent with the age profile of the population in the DHS survey 2001. Preparing data for DYNAMIS-POP we used DHS data for informing data corrections, ie, the addition of children to the original data set, as this approach does not require the availability of more recent data. Comparable data issues were detected when preparing data for Mauretania and Senegal.
While data quality might be an issue in many developing countries, these problems are not specific to the use for microsimulation but become more visible and detectable than in macro projections. Combining data from various sources allows to address some issues supporting the development of more realistic projections. Some of the fixes can be included as data preparation steps in the standard workflow of data preparation for DYNAMIS-POP.
In the presented study we have used the simPop package (Templ et al., 2019) to fix age-heaping and the under-reporting of young children. Besides that, the package can also be used to create entirely synthetic data sets. Synthetic population datasets are created based on – and integrate variables from - multiple sources. They provide a close representation of the actual population and are anonymized by design. The creation of high-quality publicly accessible synthetic datasets together with new country versions and applications of DYNAMIS-POP is one of the future project goals.
References
-
1
Caste, Ethnic and Regional Identity in Nepal: Further Analysis of the 2006 Nepal Demographic and Health SurveyCalverton, Maryland, USA: Macro International Inc.
-
2
Sociocultural and geographical disparities in child immunization in NepalAsia-Pacific Population Journal 22:43–64.https://doi.org/10.18356/1e441780-en
-
3
Caste-based Discrimination in NepalIndian Institute of Dalit Studies Working Paper Volume III Number 08.
-
4
Projections of the Diversity of the Canadian Population 2006 to 2031Statistics Canada Catalogue no. 91-551-X.
-
5
Demosim: An Overview of Methods and Data SourcesStatistics Canada Catalogue no. 91-621-X (ISBN 978-0-660-06909-8).
-
6
National Immunization Program Comprehensive Multi-Year Plan 2068-2072 (2011- 2016)National Immunization Program Comprehensive Multi-Year Plan 2068-2072 (2011- 2016).
-
7
Southmod: modelling Tax-Benefit systems in developing countriesInternational Journal of Microsimulation 12:1–12.
-
8
Infant vaccination timing: beyond traditional coverage metrics for maximizing impact of vaccine programs, an example from southern NepalVaccine 34:933–941.https://doi.org/10.1016/j.vaccine.2015.12.061
-
9
A Supplement to Vol. 24, 1998, Population and Development ReviewFrontiers of Population Forecasting, A Supplement to Vol. 24, 1998, Population and Development Review, New York, The Population Council.
-
10
A Microsimulation Approach for Modelling the Future Human Capital of EU28 Member CountriesIIASA Working Paper. IIASA, Laxenburg, Austria: WP-17-017.
-
11
Projected trends to 2031 for the Canadian labour forceStatistics Canada Catalogue no. 11-010-X, vol. 24, no. 8.
-
12
Projections of the Aboriginal Population and Households in Canada, 2011 to 2036Statistics Canada Catalogue no. 91-552-X.
-
13
Determinants of child immunization in Nepal: The role of women’s empowermentHealth Education Journal.
-
14
The relation between education and labour force participation of Aboriginal peoples: a simulation analysis using the Demosim population projection modelCanadian Studies in Population 41:144–164.https://doi.org/10.25336/P6RG79
-
15
DemProj Version 4 - A Computer Program for Making Population ProjectionsThe POLICY Project Spectrum.
-
16
EUROMOD: the European Union tax-benefit microsimulation modelInternational Journal of Microsimulation 6:4–26.
-
17
Simulation of Synthetic Populations for Survey Data Considering Auxiliary InformationR Package Documentation.
-
18
Unequal Citizens. Gender, Caste and Ethnic Inclusion in NepalUnequal Citizens. Gender, Caste and Ethnic Inclusion in Nepal, 37966v2.
-
19
Microsimulation methods for population projectionPopulation. English selection 10:97–136.
Article and author information
Author details
Funding
This project, led by the World Bank Development Data Group, is funded by the World Bank Knowledge for Change Program (KCP, grant No TF0A1095) and by the International Household Survey Network Trust Fund (grant No TF0A7461) from the United Kingdom Department for International Development.
Acknowledgements
This project, led by the World Bank Development Data Group, is funded by the World Bank Knowledge for Change Program (KCP, grant No TF0A1095) and by the International Household Survey Network Trust Fund (grant No TF0A7461) from the United Kingdom Department for International Development.
The project was initiated and led by Olivier Dupriez, Lead Statistician at the World Bank Development Data Group. Martin Spielauer, expert in micro-simulation and consultant for the World Bank, is the main author of the model.
Publication history
- Version of Record published: December 31, 2019 (version 1)
Copyright
© 2019, Spielauer, Dupriez
This article is distributed under the terms of the Creative Commons Attribution License, which permits unrestricted use and redistribution provided that the original author and source are credited.