The Hypothetical Household Tool (HHoT) in EUROMOD: a new instrument for comparative research on tax-benefit policies in Europe
- Herman Deleeck Centre for Social Policy, University of Antwerp, Belgium
- European Commission, Joint Research Centre (JRC), Spain
- Institute for New Economic Thinking at the Oxford Martin School, University of Oxford, UK
- Institute for Social and Economic Research, University of Essex, UK
- Organisation for Economic Co-operation and Development (OECD), France
- Bank of Italy, Italy
- Formerly Herman Deleeck Centre for Social Policy, University of Antwerp, Belgium
- Federal Public Service Social Security, Belgium
Figures
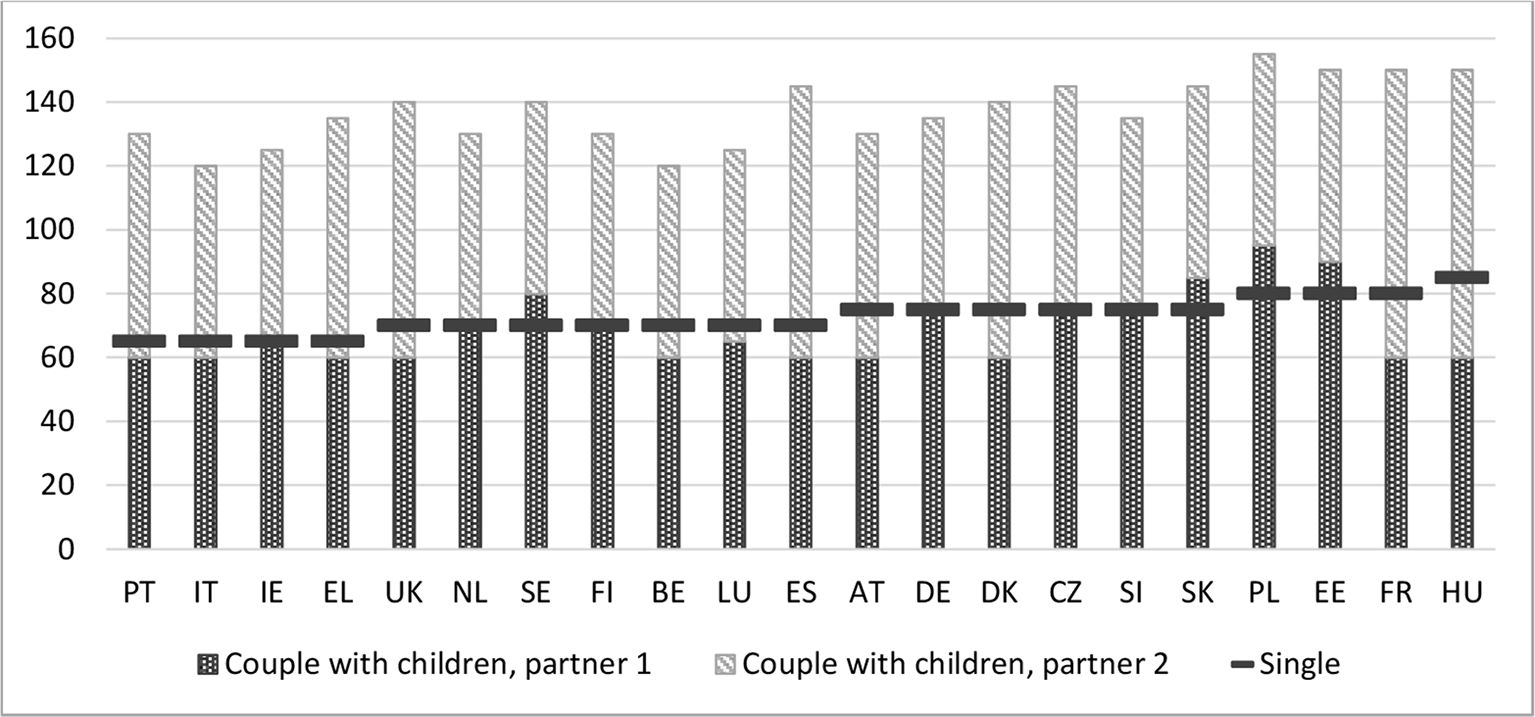
Gross wage needed to reach the at-risk-of-poverty line, as a percentage of the average gross wage per full-year full-time equivalent employee, for a hypothetical family , 2014.
Source: own calculations using EUROMOD H1.0+ and HHoT; poverty threshold and average wages based on EUROMOD calculations using EU-SILC. Note: countries sorted from lowest to highest percentage of the gross average wage needed to reach a disposable income at the level of poverty threshold for a single-person household. The selection of countries is based on availability in EUROMOD and availability of the average gross wage (for 2014 in the OECD online database at the time of writing).

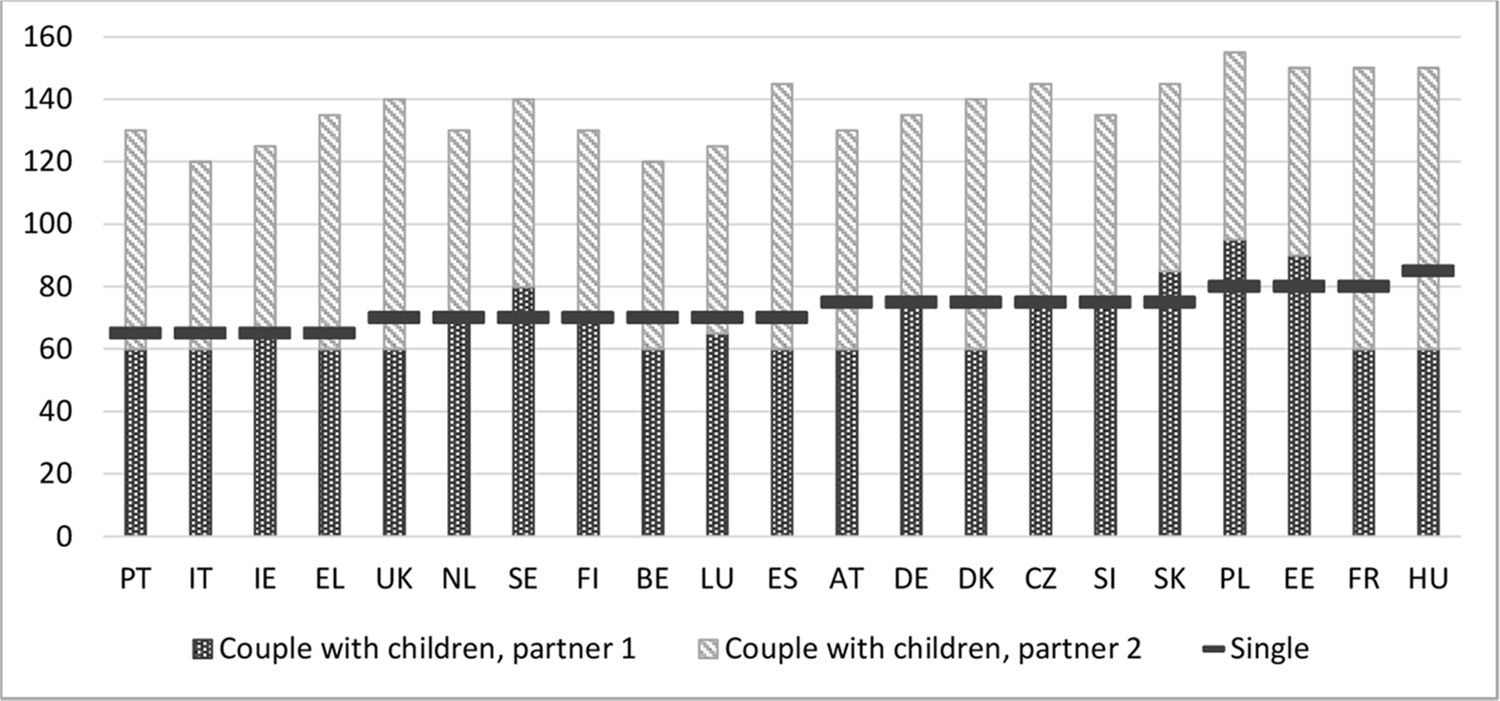
Net income for three household types expressed as a percentage of the net income of a single-person household with the same gross wage, but without children, 2014.
Note: Positive values for taxes and social contributions indicate that a household with a child pays less in taxes or social contributions, or receive higher tax credits. Source: own calculations using EUROMOD H1.0+ and HHoT; average wage based on EUROMOD calculations using EU-SILC.

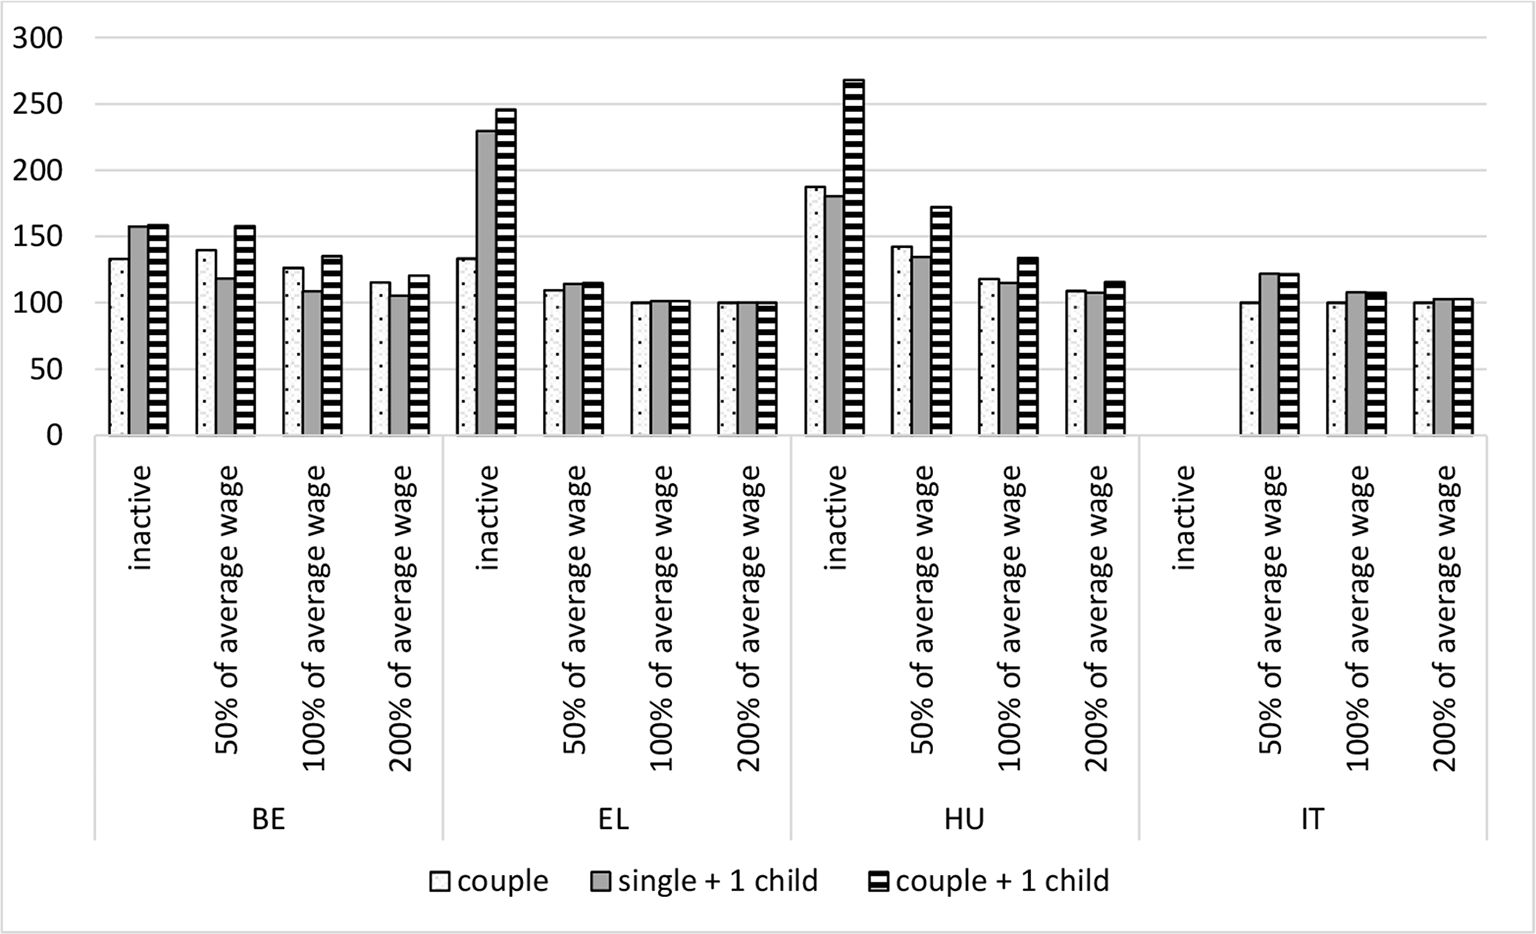
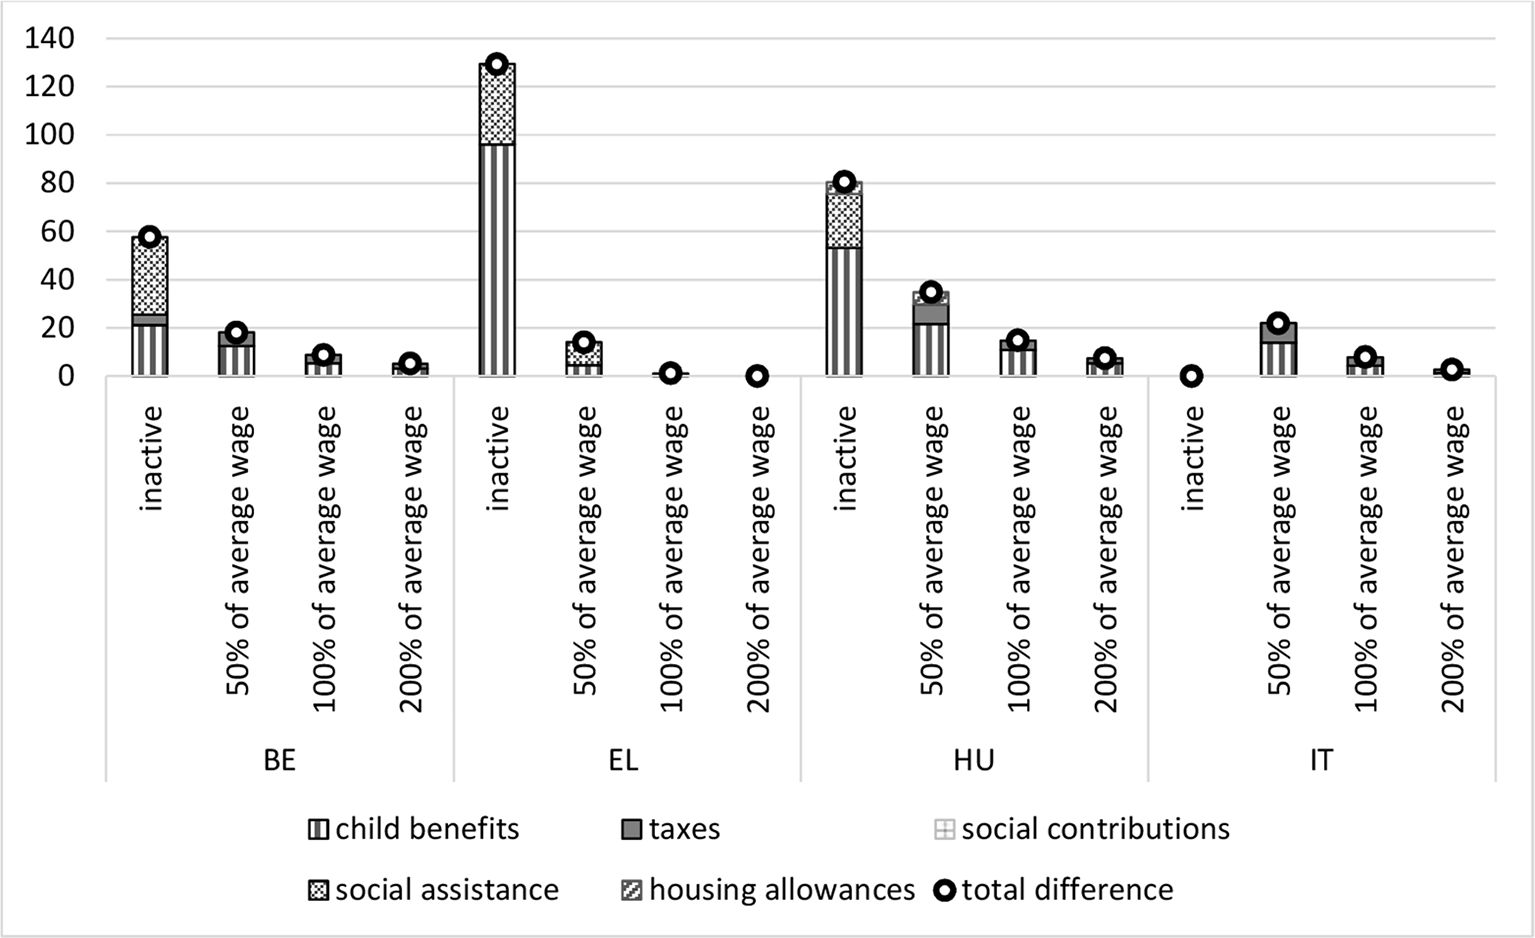
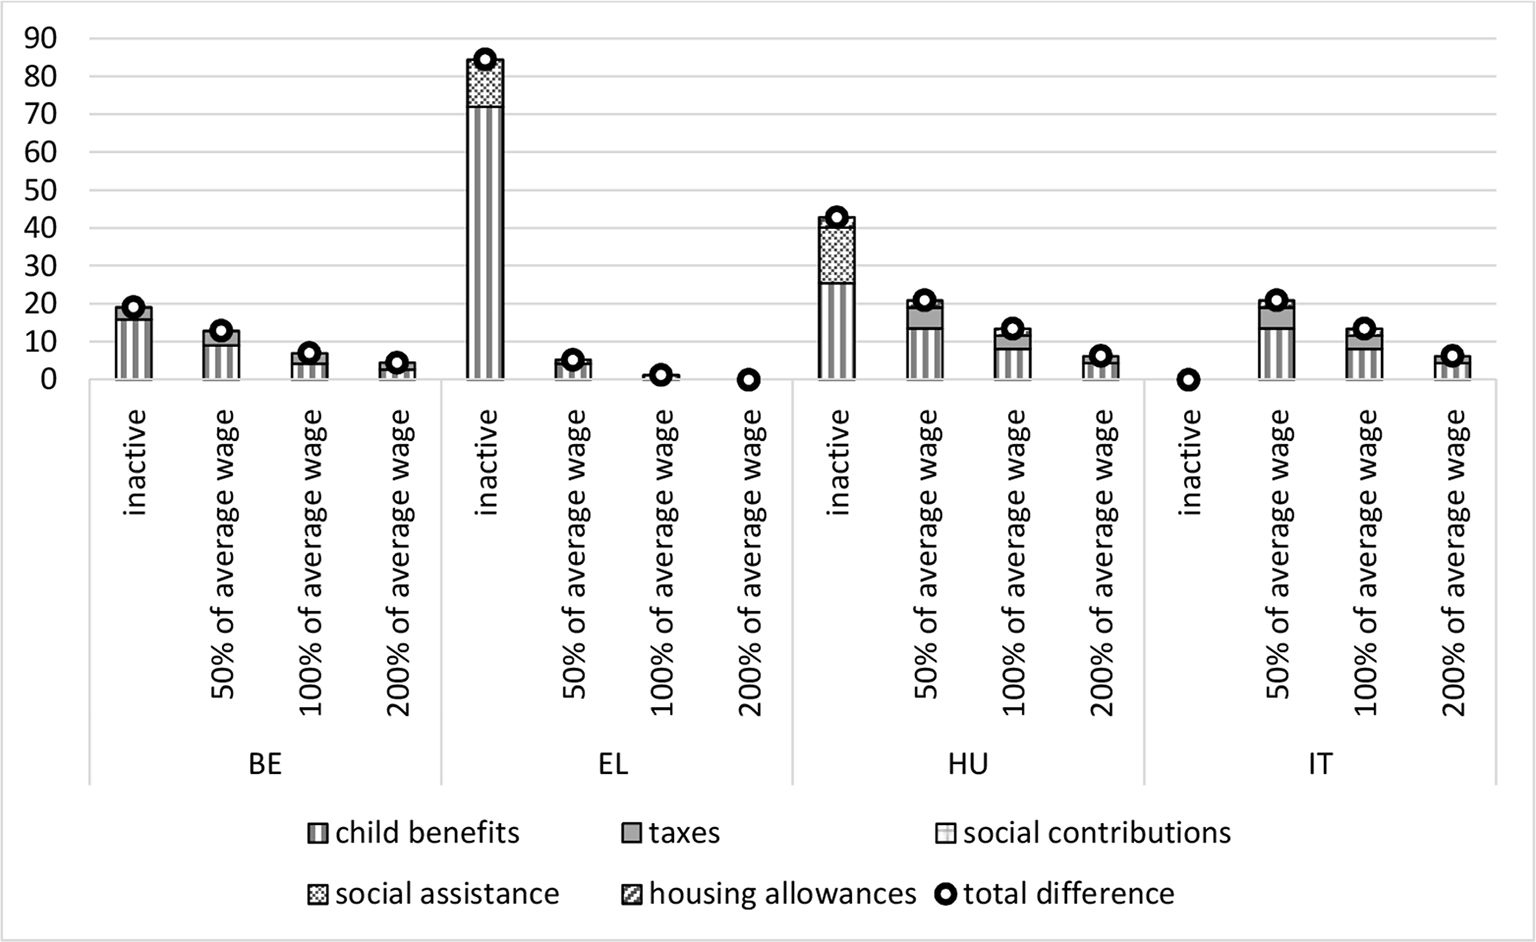
Tax-benefit package for a child in a single parent household, income components expressed as a percentage of the net income of a single parent household without children, 2014.
Source: own calculations using EUROMOD H1.0+ and HHoT; average wage based on EUROMOD calculations using EU-SILC.

Tax-benefit package for a child in a couple parent household, income components compared to the net income in a couple household without children, 2014.

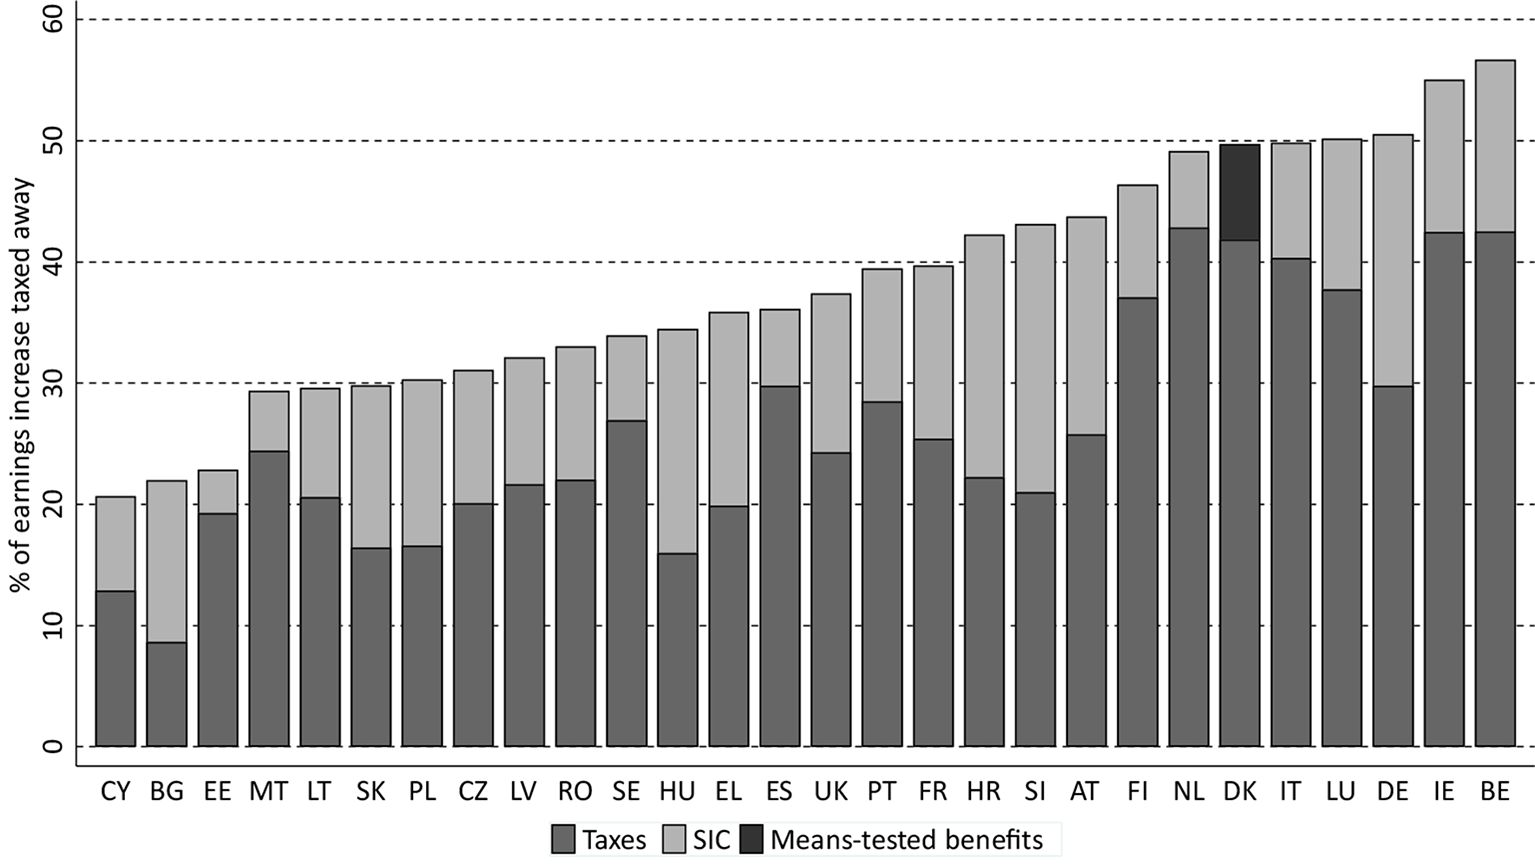
Decomposition of average METRs for a single person household at earnings levels from 80% to 120% of average earnings by income component, 2017 policy system.
Source: own calculations using EUROMOD H1.0+ (Gasior and Recchia, 2019). Note: SIC = social insurance contributions. Countries are ranked by the percentage of marginal earnings increase taxed away. Policy system 2017 refers to the status quo on 30th of June 2017. Results are based on the assumption of full tax-compliance and full benefit take-up.

Decomposition of METRs at different earnings levels in Cyprus, Hungary and Belgium by income component, 2017 policy system.
Source: own calculations using EUROMOD H1.0+ (Gasior and Recchia, 2019). Note: Policy system 2017 refers to the status quo on 30th of June 2017. Results are based on the assumption of full tax-compliance and full benefit take-up. Level of gross earnings refers percentage of average gross earnings.
Tables
Summary of hypothetical households used in example 1
| Demographic composition | Labour market status adults | |
|---|---|---|
| Couple (2 earners) with child (8 years) | Employee – full time at minimum wage | Inactive |
| Single with child (8 years) | ||
| Couple (2 earner) with 3 children (5, 8 and 12 years) | ||
| Single with 3 children (5, 8 and 12 years) | ||
Net disposable income and different income components for four hypothetical households, minimum wage, 2016
| Two adults with 1 child | One adult with 1 child | Two adults with 3 children | One adult with 3 children | |||||
|---|---|---|---|---|---|---|---|---|
| Baseline | Reform | Baseline | Reform | Baseline | Reform | Baseline | Reform | |
| Total | Total | Total | Total | Total | Total | Total | Total | |
| Gross earnings | 2,947 | 2,947 | 1,473 | 1,473 | 2,947 | 2,947 | 1,473 | 1,473 |
| Total taxes | 220 | 220 | 70 | 70 | 220 | 220 | 70 | 70 |
| SIC employee | 602 | 602 | 301 | 301 | 602 | 602 | 301 | 301 |
| Means-tested benefits | 0 | 0 | 0 | 0 | 0 | 0 | 410 | 410 |
| Non-means-tested Child Benefit | 190 | 180 | 190 | 248 | 576 | 540 | 576 | 744 |
| Disposable income | 2,315 | 2,305 | 1,293 | 1,351 | 2,701 | 2,665 | 2,089 | 2,257 |
-
Source: own calculations based on EUROMOD H1.0+ and HHoT.
Net disposable income and different income components for four hypothetical households, inactive, 2016
| Two adults with 1 child | One adult with 1 child | Two adults with 3 children | One adult with 3 children | |||||
|---|---|---|---|---|---|---|---|---|
| Baseline | Reform | Baseline | Reform | Baseline | Reform | Baseline | Reform | |
| Total | Total | Total | Total | Total | Total | Total | Total | |
| Gross earnings | 0 | 0 | 0 | 0 | 0 | 0 | 0 | 0 |
| Total taxes | 0 | 0 | 0 | 0 | 0 | 0 | 0 | 0 |
| SIC employee | 0 | 0 | 0 | 0 | 0 | 0 | 0 | 0 |
| Means-tested benefits | 1,096 | 1,106 | 861 | 803 | 1,082 | 1,118 | 886 | 718 |
| Non-means-tested Child benefit | 190 | 180 | 190 | 248 | 576 | 540 | 576 | 744 |
| Disposable income | 1,111 | 1,111 | 876 | 876 | 1,658 | 1,658 | 1,462 | 1,462 |
-
Source: own calculations based on EUROMOD H1.0+ and HHoT.
At-risk-of-poverty rate of persons living in Germany, by family type, 2016
| Baseline | Reform | Difference | ||||
|---|---|---|---|---|---|---|
| Change | Standard error | 90% confidence interval | ||||
| Lower bound | Upper bound | |||||
| Population | 15.15 | 15.19 | 0.04 | 0.04 | –0.02 | 0.11 |
| One adult with children | 25.04 | 24.28 | –0.75 | 0.44 | –1.48 | –0.03 |
| Two adults with children | 11.53 | 11.75 | 0.21 | 0.12 | 0.02 | 0.41 |
-
We use a fixed poverty line at 60% of the median equivalised disposable income in the baseline.
-
Source: own calculations based on EUROMOD H1.0 and EU-SILC 2014, full sample design information is not available. For estimating the standard errors and confidence intervals, we take account of clustering within households and the covariance between the simulated scenarios (Goedemé, 2013; Goedemé et al., 2013).
Summary of hypothetical households used in example 2
| Demographic composition | Labour market status adults |
|---|---|
| Single | Employee(s), full time, wage varying from 60% to 200% of average gross wage*[ |
| Couple (2 earners) with 2 children (5 and 8 years) |
-
*
Although we show only one outcome, different combinations of the wages of both partners are possible.
Summary of hypothetical households used in example 3
| Demographic composition | Labour market status adults (one-earner families) | |||
|---|---|---|---|---|
| Single | Inactive | Employee, 50% of average EU-SILC wage | Employee, 100% of average EU-SILC wage | Employee, 200% of average EU-SILC wage |
| Couple | ||||
| Single with child of 10 years old | ||||
| Couple with child of 10 years old | ||||
Summary of hypothetical households used in example 4
| Household composition | Labour market status |
|---|---|
| Single | Employee, full time with between 80% and 120% of the EU-SILC average wage (in 1% steps). |
Country specific 2017 average monthly earnings used in Example 4
| Country | In EUR | In national currency |
|---|---|---|
| AT | 3140.24 | – |
| BE | 3500.56 | – |
| BG | 601.72 | 1176.84 |
| CY | 1891.30 | – |
| CZ | 1024.31 | 27332.60 |
| DE | 3495.43 | – |
| DK | 4091.22 | 30425.57 |
| EE | 1363.38 | – |
| EL | 1412.15 | – |
| ES | 1965.41 | – |
| FI | 3167.61 | – |
| FR | 2730.09 | – |
| HR | 928.85 | 6913.83 |
| HU | 695.74 | 215012.62 |
| IE | 3984.27 | – |
| IT | 2251.91 | – |
| LT | 893.97 | – |
| LU | 4753.80 | – |
| LV | 1043.15 | – |
| MT | 1881.91 | – |
| NL | 3617.86 | – |
| PL | 912.65 | 3891.83 |
| PT | 1363.98 | – |
| RO | 479.33 | 2176.91 |
| SE | 3350.66 | 32152.29 |
| SI | 1539.31 | – |
| SK | 928.29 | – |
| UK | 4080.11 | 3526.11 |
-
Source: Own calculation based on EU-SILC 2015 (2014 for UK and DE) data and EM uprating factors and exchange rates.
Data and code availability
The EU-SILC data were made available by Eurostat under contract 175/2015-EU-SILC-ECHP-LFS.
The HHoT is now available as an integral part of EUROMOD.