IDMOD: An Australian microsimulation model of lifetime economic and social factors in familial intellectual disability
- GenIMPACT: Centre for Economic Impacts of Genomic Medicine, Macquarie Business School, Macquarie University, Australia
- Royal Prince Alfred Hospital, Australia
- Heart Centre for Children, The Sydney Children’s Hospitals Network, Australia
- Discipline of Paediatrics, School of Women’s & Children’s Health, UNSW Medicine, The University of New South Wales, Australia
- Genetics of Learning Disability (GoLD) Service, Australia
- National Centre for Social and Economic Modelling (NATSEM), Institute for Governance and Policy Analysis, University of Canberra, Australia
- Neuroscience Research Australia, University of New South Wales, Australia
- Sydney Children’s Hospital, Australia
Abstract
Intellectual disability (ID) is associated with far reaching economic and psychosocial outcomes. People with ID require a wide range of supports from both governments, and families. No study has thoroughly assessed the economic and social costs of care for individuals with familial ID. Understanding the comprehensive costs of ID is important for policy makers to decide on resources required to support the families affected by the condition. In the Australian Economic and Psychosocial Impacts of Caring for Families Affected by Intellectual Disability (EPIC-ID Study), we developed a microsimulation model, IDMOD, to provide a holistic perspective of the economic costs of ID for use in cost-effectiveness studies related to genomic testing and precision medicine for familial ID. This paper describes the construction of IDMOD. The model base population are individuals who were referred to the Genetics of Learning Disability (GoLD) clinics. Through a detailed questionnaire, we collected information including health expenditure, income, education, welfare payments, savings, housing and residential care, and support received for purchase of aids and equipment, employment for both people with ID and their carers. Both government and patient costs were included. Data on quality of life, psychological wellbeing, relationship strength and social inclusion are also collected before and after genomic diagnostic testing. Patients’ use of medical services, prescription medicines, and hospital services were captured via linked datasets. Lost income, assets, and tax were imputed via synthetic matching to records from the Static Incomes Model (STINMOD). Each unit record in the model was weighted using input from the Survey of Disability, Ageing, and Carers (SDAC) to reflect the total familial ID population in Australia. The model will provide data on the economic costs of familial ID in Australia, and the associated effects of implementing genomic testing and precision medicine for this population group.
1. Introduction
Approximately 1% of the global population are affected by intellectual disability (ID) (Maulik et al., 2011). People with ID are reported to have lower life expectancy (Bittles et al., 2002). In addition, people with ID often experience other comorbidities that severely impact their quality of life, including mental health problems, low physical fitness, feeding problems and obesity (Beange et al., 1995; Hilgenkamp et al., 2012; Lennox et al., 2015; Matson and Kuhn, 2001; Sutherland et al., 2002). A report from the Australian Bureau of Statistics showed that individuals with disabilities are less likely to be employed, and more likely to be dependent on income support (Australian Bureau of Statistics (2016b); The Commonwealth of Australia, 2009). Due to their condition, people with ID require a wide range of social supports, including extensive medical care, welfare payments, supported accommodation, special education, aids and appliances, and support with social activities. In addition, family members and unpaid carers experience related reduction in their capacity to work and earn income (Saunders et al., 2015), relationships (Martorell et al., 2011), and mental and physical well-being (Totsika et al., 2017).
There are limited studies that comprehensively assess the cost burden of ID. Most studies are restricted to a single perspective, including health care (Gordon et al., 2012; Lunsky et al., 2019; Panca et al., 2019), social care (Okon et al., 2019), or costs to their carer (Genereaux et al., 2015). One of the very few studies to report comprehensive economic costs of ID suggested that the majority of the burden is borne by the families (Doran et al., 2012). Doran et al. reported that the total cost (including both government and family expenditure) of ID amounted to AU$60,000 annually, although this study was skewed towards younger people with mild ID (Doran et al., 2012). The Centers for Disease Control and Prevention (CDC) reported that the lifetime cost of ID amounted to approximately US$1 million per person in 2003, from a societal perspectives (Centers for Disease Control and Prevention (CDC), 2004). In the UK, the lifetime cost for an individual with Autism Spectrum Disorders (ASD) and ID is estimated at approximately £1.23 million (Knapp et al., 2009), while an Australian study estimated the costs of workforce productivity due to informal caring for this group demonstrating AU$310 million in lost income for carers (Schofield et al., 2019c). However, these studies did not consider the broader impacts on family members caring for individuals with ID and did not specify costs where the disorder was familial. The factors associated with caring for an individual with ID extend beyond the financial aspects, with many reporting a negative outcomes in terms of carer’s relationships, physical and mental health, and employment opportunities (Dawson et al., 2016; Yoong and Koritsas, 2012). Carers also reported insecurity and often had difficulty in making concrete plans for their own and their offspring’s future (Innes et al., 2012).
To our knowledge no study has thoroughly assessed the economic and psychosocial costs of care for individuals with ID and their families within a familial ID genetics clinic. Understanding the costs of ID is important for policy makers to decide resources required to support families affected by the condition. In the Economic and Psychosocial Impacts of Caring for Families Affected by Intellectual Disability (EPIC-ID Study), we developed a microsimulation model, IDMOD, to provide a holistic perspective of the economic costs of ID for use in cost-effectiveness studies related to genomic testing and precision medicine for familial ID. The Genetics of Learning Disability (GoLD) service serves multigenerational families referred to genetics services over a 20–30 year period, creating a unique opportunity to survey costs for different life stages to build a microsimulation model of the lifetime health and welfare costs and to provide insight into the burden of caring for family members with intellectual disability in Australia.
2. Materials and methods
2.1 Participants recruitment and base population
Patients are individuals with ID who were referred to the GoLD clinics. When recruitment is completed we plan to include a total of about 200 families (about 100 in each of the “retrospective” and “prospective” groups) who are the primary carers of a child or relative with moderate to severe ID. The retrospective group were used to construct lifetime histories and had had some form of genetic testing with or without a diagnosis. The prospective group received whole genome sequencing. To date we have recruited 163 patients with ID, 82 in the retrospective arm and 81 in the prospective arm. We have also recruited 105 carers. There is, on average, more than one individual with ID per family in our cohort.
The primary carers in prospective group were asked to complete an EPIC-ID baseline questionnaire before genomic testing and two follow up EPIC-ID questionnaires at one month and 12 months after receiving the results of genomic testing. Primary carers in the retrospective group were asked to complete one EPIC-ID questionnaire about their family and their child or relative(s) with ID and were not offered genomic testing. The EPIC-ID baseline questionnaire for the prospective group is similar to that of the retrospective group except that they do not include questions about genomic testing (The EPIC-ID survey is described in more detail in section 2.3).
Information collected from the prospective cohort data only is used to model the potential benefits of accurate molecular diagnosis of ID by genomic testing for families and the financial burdens associated with ID on the Australian health system, including a cost-effectiveness analysis of the proposed new diagnostic pathway using Whole Genome Sequencing (WGS) compared to standard diagnostic case. The retrospective cohorts’ data is used to model lifetime economic costs associated with familial ID.
The microsimulation model, IDMOD, is developed to assess the cost burden of caring for families affected by intellectual disability from multiple perspectives, including the Commonwealth government, State government, and families’ direct and indirect costs, and opportunity costs.
2.2 IDMOD structure
The structure of the microsimulation model, IDMOD, is composed of several unit record datasets (Figure 1). The EPIC-ID participants’ demographic information, and data collected through the EPIC-ID questionnaire formed the base population in IDMOD. Data from the New South Wales (NSW) admitted hospital data collection and emergency department data collection were linked by the Centre for Health Record Linkage (CHeReL) to analyse hospital and emergency department utilisation by EPIC-ID participants. Medicare data on medical and pharmaceutical costs were also included in the model (Medicare data is described in more detail in section 2.5).
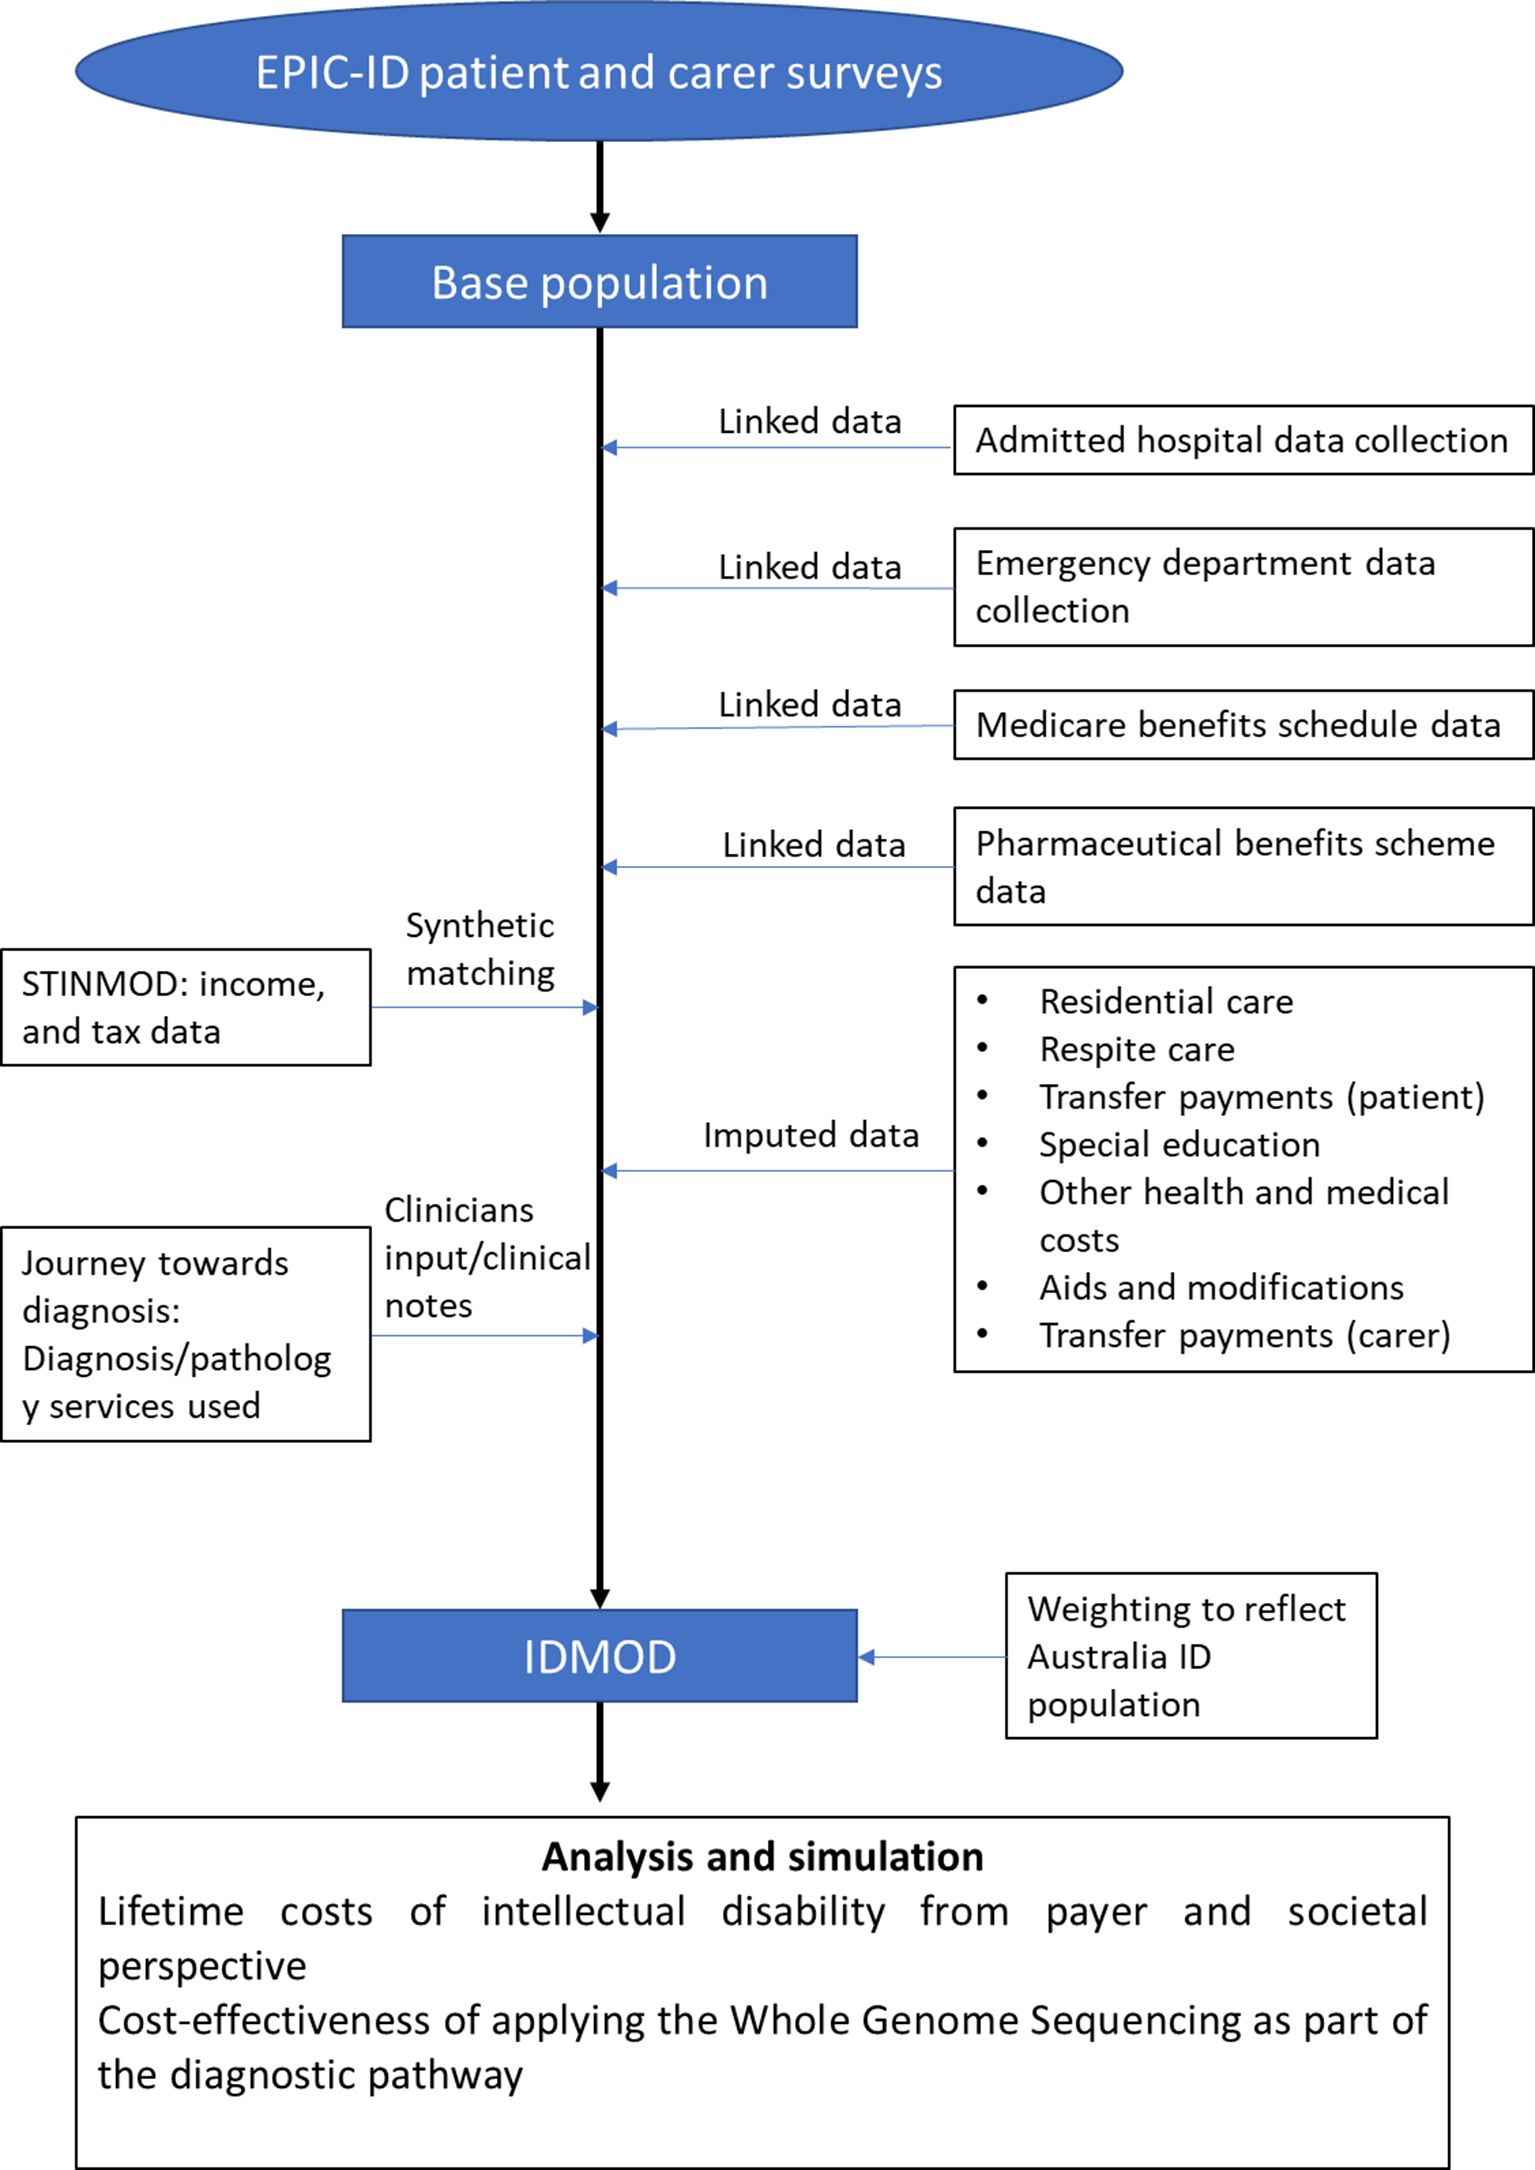

Structure of IDMOD
In order to estimate the costs associated with ID on the families’ financial situation, we also imputed data from the Static Income Model (STINMOD) to determine lost income, taxation, and wealth for the participants (Lambert et al., 1994) (Figure 1).
2.3 Questionnaire design
Through detailed questionnaires, we collected information on patients with familial ID. We asked carers about the patients’ quality of life, physical and mental health, education, residential and respite care, use of public housing, welfare dependence, income, use of employment services, savings, use of aids and appliances, health care services (eg, allied health, genetics services, complementary medicine) and home and vehicle modifications via a custom designed questionnaire recording costs over a 10 year period. Data on psychological wellbeing, relationship strength and social inclusion were also collected before and after genomic diagnostic testing. We also collected information on quality of life (QoL), family relationships, employment, income, welfare dependence, wealth accumulation and psychological wellbeing for the carer completing the questionnaire. Carers’ QoL was measured using the AQoL-8D (Richardson et al., 2014), while QoL of patients was measured using the HUI23 (Barr et al., 1993; Torrance et al., 1996). Family relationships were measured using the McMaster Family Functioning Scale (Boterhoven de Haan et al., 2015). Depression and anxiety were measured using the Depression Anxiety and Stress Scales (DASS) (Lovibond and Lovibond, 1996). Counterfactual QoL and psychosocial trajectories are imputed using population norms (age-specific, where available) for each instrument. All instruments included in the questionnaire are validated. The questionnaire was administered by EPIC-ID genetic counsellors and the questionnaire was approved by the Hunter New England Human Research Ethics Committee (NSW HREC Reference No: HREC/16/HNE/309).
2.4 Linked data
2.4.1 Hospital admission and emergency department presentation
The Australia’s health system is co-funded by the Commonwealth government and State governments. We estimated health system costs using a number of datasets. For all inpatient and emergency department visits, we obtained consent to extract patient’s hospital and emergency department data via data linkage. We used the Australian Refined-Diagnosis Related Group (AR-DRG) codes for each hospital separation that is available in the NSW Admitted Patient Data Collection (APDC) to derive a cost per hospital episode based on the National Hospital Cost Data Collection average cost and average length of stay estimates produced by the Independent Hospital Pricing Authority for public hospital patients (Independent Hospital Pricing Authority (IHPA), 2018). For private hospital patients, we used the Hospital Casemix Protocol average cost estimates for each AR-DRG (Department of Health, 2017). AR-DRGs were used to classify patient hospital admissions by connecting the number and type of patients treated in a hospital (known as hospital casemix) to the resources required by the hospital. We estimated the cost of emergency department presentations using the Urgency Related Group (URG) code that is available in the NSW Emergency Department Data Collection (Independent Hospital Pricing Authority (IHPA), 2018).
2.5 Medicare benefits schedule (MBS) and Pharmaceutical Benefits Scheme (PBS) data
Medicare is Australia’s universal health insurance scheme for eligible residents. It provides subsidies for out-of-hospital medical services, selected diagnostic imaging and pathology services, and selected allied health services listed in the MBS. Medicare also includes the PBS, which subsidises the cost of a wide range of pharmaceutical medicines.
2.6 Imputed costs
The following describes service utilisation information collected via the EPIC-ID questionnaire and relevant costs imputed onto IDMOD.
2.6.1 Residential care and specialist disability accommodation
Depending on their circumstances, individuals may live in supported group accommodation, residential care, with their family, or in their own home (typically with support). Group accommodation, also often known as supported independent living, provides accommodation and daily care/support for people with a disability with 2–7 other people. Until March 2018, this service was funded by the state government, however the Commonwealth government is taking responsibility for housing support through the National Disability Insurance Scheme (NDIS), under the framework of Specialist Disability Accommodation and Supported Independent Living (Table 1).
Services used, and costs data collected in the EPIC-ID questionnaire
| Category | Item | Cost (annual unless specified otherwisea) | Perspective | Data source | Note |
|---|---|---|---|---|---|
| Health system | |||||
| Inpatient | AR-DRG | Government | NSW Admitted Patient Data Collection | ||
| Emergency department | URG | Government | NSW Emergency Department Data Collection | ||
| Outpatient consultation | Government | Medicare Benefits Schedule data | |||
| Naturopatha | $107 per session | OOP | (Cancer Council Australia, 2018) | ||
| Prescription medication | Government | Pharmaceutical Benefits Scheme data | |||
| Supplements and OTC medication | Self-reported | OOP | |||
| Supported accommodation & respite | |||||
| Residential care | $16,973 Income and assets mean tested (no more than $$27,754 per year) | Government | (Australian Government Department of Health, 2017) | ||
| Residential care-basic daily fee | $18,038 | Government | (Australian Government Department of Health, 2017) | Basic daily fee is paid out of pocket for over 65 residents. Fee for under 65 disabled residents is covered by the NDIS. | |
| Specialist Disability Accommodationa | $4,452-$59,375 | Government | (National Disability Insurance Agency, 2017) | Cost of accommodation is subject to patients’ needs (accessibility, on-site overnight assistance, or high level of physical access provision with high support need) and number of people sharing the accommodation. | |
| Supported Independent Livinga | $1,727-$4,951 per week | Government | (National Disability Insurance Agency, 2016) | Cost of supported independent living depends on support needed to undertake household tasks and/or self-care activities. | |
| Respite care | $13,024 | Government | (Australian Institute of Health and Welfare, 2017) | ||
| Rent subsidy | Market rent less 25%–30% of household income | Government | (Department of Communities and Justice NSW, 2019) | Eligibility for government subsidy is income tested. | |
| Welfare | |||||
| Disability support pension (under 20 years and living independent) | $13,335 | Government | (Australian Government Social Security Guide, 2018a) | ||
| Disability support pension (under 18 years and living at home) | $8,104 | Government | (Australian Government Social Security Guide, 2018a) | ||
| Disability support pension (18–20 years and living at home) | $9,393 | Government | (Australian Government Social Security Guide, 2018a) | ||
| Disability support pension (above 20 years old) | $23,254 | Government | (Australian Government Social Security Guide, 2018a) | ||
| Mobility allowance standard rate | $2,493 | Government | (Australian Government Social Security Guide, 2018b) | ||
| Mobility allowance higher rate | $3,487 | Government | (Australian Government Social Security Guide, 2018b) | ||
| Supported employment | $5,031 | Government | (Australian Institute of Health and Welfare, 2017) | ||
| Education | |||||
| Primary student-Supplementary level support | $16,107 | Government | (Department of Education, 2019) | ||
| Primary student-Substantial level support | $27,903 | Government | (Department of Education, 2019) | ||
| Primary student-Extensive level support | $46,733 | Government | (Department of Education, 2019) | ||
| Secondary student-Supplementary level support | $18,958 | Government | (Department of Education, 2019) | ||
| Secondary student-Substantial level support | $30,789 | Government | (Department of Education, 2019) | ||
| Secondary student-Extensive level support | $49,604 | Government | (Department of Education, 2019) | ||
| Early intervention classa | $185 per hour | Government | (National Disability Insurance Agency, 2018) | ||
| Aids and modifications | Self-reported | OOP/Government | EPIC-ID questionnaire recorded costs and subsidies received for aids and modifications, including nappies, special diet, mobility aids (eg, wheelchair), lifting/hoisting apparatus, peg feeding equipment, visual, hearing and communication aids, orthotics, home modifications (eg, stairs, bedroom), and vehicle modifications. | ||
| Carer’s costs | |||||
| Welfare (eg, carer payment, and carer allowance) | Self-reported | Government | Carer payment and carer allowance are obtained from EPIC-ID questionnaire response. | ||
-
AR-DRG = Australian Refined-Diagnosis Related Group; OOP = Out-of-pocket; OTC = Over-the-counter; URG = Urgency Related Group;
-
a
Costs that were not reported in the year of 2017 were adjusted at an inflation rate of 3% per annum.
In some areas of Australia, specialised disability accommodation is not available for younger people with disability who have high or complex care needs. Individuals with ID, including some younger people under the age of 65, may live in residential care facilities. Residential care facilities provide accommodation support for people who are unable to continue living independently in their own homes. These services are also funded by the NDIS. We assigned an annual average residential care cost of $16,973 for individuals living in residential care based on the report by the Joint Standing Committee on the National Disability Insurance Scheme (Joint Standing Committee on the National Disability Insurance Scheme, 2016). In addition, the residential care residents were assigned an out-of-pocket basic daily fee to cover daily living costs, as scheduled by the Department of Human Services (Australian Government Department of Health, 2017), this cost is paid by the NDIS for eligible NDIS participants (Table 1).
2.6.2 Respite care
Respite services provide a short-term and time-limited break for families and other voluntary caregivers of people with disability. Unit costs were estimated from published reports (Australian Institute of Health and Welfare, 2017). We assigned an annual average respite cost of $13,024 for individuals who responded that they had used respite care in the past 12 months based on Australian Institute of Health and Welfare (AIHW) report (Australian Institute of Health and Welfare, 2017) (Table 1).
2.6.3 Transfer payments
Many of our participants are eligible for transfer payments, either in the form of pensions, allowances, supplementary payments, or family payments. Through our EPIC-ID questionnaire, we collected data for both patients and carers on the types of welfare payments they received and how long have they been receiving these payments. Annual costs for each type of transfer payment were estimated by applying an income and asset tests or a flat rate if applicable.
2.6.4 Education
Information on education, including special education, mainstream school with an aide, or mainstream school, and early intervention programs was also surveyed (National Disability Insurance Agency, 2018). Education costs were imputed based on the Nationally Consistent Collection of Data on School Students with Disability (NCCD) (Department of Education, 2019). Additional loadings were stratified into three levels of additional support needed by a student with disability – supplementary, substantive and extensive, were assigned to each patient based on their ID severity. Government funding for schools was based on the Schooling Resource Standard (SRS) estimates, where the Commonwealth government contributed 20% of the SRS for government schools with the remaining 80% of non-government school’s SRS funded by the Commonwealth government (Department of Education, 2019).
Publicly funded early intervention programs were costed based on NDIS pricing guidelines (National Disability Insurance Agency, 2018) (Table 1). Out-of-pocket expenses were based on families’ questionnaire response.
2.6.5 Other health and medical costs
Participants provided utilisation and cost information on health services other than those from linked data, over-the-counter medicine and complementary medicine over the previous 12 months through our EPIC-ID questionnaire. They also indicated whether these were publicly or privately funded. Publicly funded health and medical costs were imputed based on the NDIS price guide (National Disability Insurance Agency, 2018), while privately funded items were costed according to patients’ questionnaire response (Table 1).
2.6.6 Aids and equipment
We surveyed participants regarding the type of aids used in the past 10 years, including but not limiting to the use of wheelchairs, lifting apparatus, hearing aids, and communication aids. Information on funding amount and sources used to purchase these aids, either through the NDIS, other government funding, or out-of-pocket expense was also collected. Similarly, we also collected data on home or vehicle modifications. Information on the costs and government subsidies received for these items was imputed onto IDMOD from participants’ responses to the questionnaires.
2.6.7 Transfer payment (carer)
Caring for people with ID has a significant cost reflected in carer’s financial circumstances as well as those for the patient. Eligible carers can receive government support through the Carer Allowance and Carer Payment with carer payment being income and asset tested.
2.7 Synthetic matching of data
Some financial data not included in patient and carer surveys imputed for adults with ID and carers by synthetically matching records with STINMOD. Tax paid by participants and carers was imputed by matching records from STINMOD on family type, income group, and net assets.
2.8 Diagnostic pathway
In order to analyse the cost-effectiveness of WGS, diagnostic services used by patients were extracted from clinical notes. Previous work suggests that the use of genomic sequencing technology is a cost-effective approach to diagnosis and improving family health outcomes for rare diseases. (Ewans et al., 2018a; Schofield et al., 2019a; Stark et al., 2017; Stark et al., 2019) We hypothesized that WGS would improve diagnostic efficiency compared to the standard diagnostic pathway.
2.9 Counterfactual imputation
We undertook counterfactual modelling for adults with ID and carers to reflect their likely circumstances in the event that they had been unaffected by ID, we imputed counterfactual data using synthetic matching with STINMOD. Typically, when using synthetic matching to impute missing data, closely associated variables are used to increase similarity between model and imputed records (eg, income, and assets) for specific characteristics (Schofield et al., 2009; Schofield et al., 2014; Shrestha et al., 2018). However, when deriving a counterfactual, fewer variables were used so that the synthetic matching process could provide an estimate of circumstances patients and carers of families unaffected by ID. Thus, counterfactuals encompass a much broader range of circumstances and the variables associated with ID such as education, income, assets and welfare received were not included as matching variables for the counterfactuals as these would specifically select records for people in similar circumstances rather than the general population.
2.9.1 Lost income, assets, and tax (patient)
We estimated income that individuals with ID otherwise could have achieved by imputing income information from STINMOD (Lambert et al., 1994) on people with broadly similar characteristics from the general population onto our cohort in the EPIC-ID model, we did this by synthetically matching participant records with similar sociodemographic characteristics in the two datasets, namely age, sex, and state of residence.
Apart from age and sex, education attainment also plays a significant role in income distribution. Due to the nature of the disease, people with ID are often unable to complete their compulsory education. When imputing counterfactual incomes for patients, we have taken a two step approach during the synthetic matching process. Firstly, we determined the proportion of each category of education attained from the Australian Bureau of Statistics 2016 Census data (Australian Bureau of Statistics, 2016a). An upper and lower bound range for each category was created using cumulative percent values (example in Table 2). To model the counterfactual education that EPIC-ID patients could have achieved if they did not have ID, we assigned a random value between 0–1 drawn from a uniform distribution to individuals in the EPIC-ID. Controlling for age, sex, and state of residence, if the value falls between upper and lower bounds for an education category, e.g. between 0 and 0.074 for Postgraduate degree in Table 2, then the individual would be assigned to achieve postgraduate degree in this simulation. Once we have imputed the counterfactual education, we synthetically match EPIC-ID participants records with similar characteristics in STINMOD, namely age, sex, state of residence, and highest education achieved (counterfactual) to obtain counterfactual income. The two step matching process was repeated 1,000 times, and the average value from the repeated process was assigned as the counterfactual income for the record if he/she had not been affected by ID. Lost income represents the difference between the counterfactual income and their current income. We estimated asset loss by imputing wealth information for synthetically matched records from STINMOD onto our model. In a similar fashion, counterfactual tax was imputed.
Example of education distribution in Australian Bureau of Statistics 2016 Census data
| Age | Sex | State/Territory | Highest qualification attained | Proportion | Upper bound | Lower bound |
|---|---|---|---|---|---|---|
| 25–29 years | Male | New South Wales | Postgraduate degree, graduate diploma/graduate certificate | 0.074 | 0.000 | 0.074 |
| 25–29 years | Male | New South Wales | Bachelor degree | 0.234 | 0.074 | 0.308 |
| 25–29 years | Male | New South Wales | Advanced diploma/diploma | 0.212 | 0.308 | 0.520 |
| 25–29 years | Male | New South Wales | Certificate III / IV | 0.079 | 0.520 | 0.598 |
| 25–29 years | Male | New South Wales | Certificate I / II | 0.001 | 0.598 | 0.599 |
| 25–29 years | Male | New South Wales | Certificate not further defined | 0.022 | 0.599 | 0.621 |
| 25–29 years | Male | New South Wales | No non-school qualification | 0.282 | 0.621 | 0.903 |
| 25–29 years | Male | New South Wales | Level not determined | 0.097 | 0.903 | 1.000 |
2.9.2 Lost income, assets, and tax (carer)
Many carers are unable to remain in the labour force due to their caring duties. If a carer indicated that they were forced to leave the labour force due to caring, and if the carer did not report the amount of income earned before they left the workforce, we estimated income that the carer could have achieved if they remained at work via STINMOD as well as the income lost due to caring. Variables used to impute income in synthetic matching to records in STINMOD were age, sex, state of residence, and the highest level of education achieved.
In addition to losing income, patients’ carers also have a reduced ability to accumulate wealth due to their depleted income source (Schofield et al., 2019b). We estimated asset loss by imputing wealth information for synthetically matched records from STINMOD onto our model.
The amount of tax losses associated with ID from the government’s perspective were imputed through matching records from STINMOD. Variables used for synthetic matching to records in STINMOD to impute counterfactual wealth and tax were: counterfactual income (income earned if not caring for ID), age, highest education achieved, and sex.
2.10 Weighting
The model assigns weights to individuals to reflect an estimate of familial ID within the Australian population. Most familial ID cases are X-linked ID (X-linked ID arises due to genetic variants in the X-chromosome), and we use X-linked ID as a proxy to estimate the prevalence of familial ID in our model. It has been reported that X-linked ID represented 10%–12% of the ID population. (Lubs et al., 2012) In another source, X-linked ID was reported to account for 23% of ID with a further 18% being recessive and 5% of other origin (unpublished data, personal communication Dr. Roscioli, 31st July 2019). Estimates from the developmental disorders study (DDD study) suggested that 22% of diagnoses were inherited variants (Wright et al., 2015; Wright et al., 2018). However, there is likely ascertainment bias in terms of priority given for referral to a genetics clinic. Therefore, we will undertake sensitivity analysis on the results for familial ID being between 10% and 23%.
The majority (85%) of cases of ID in the population are mild (van Bokhoven, 2011). Severity of ID, in this case, was classified according to individual’s intelligence quotient (IQ) values, with moderate to severe ID characterised by IQ values below 50 and mild ID including values from 50 to 70.
We retrieved the records of persons with ID and their weight from the Survey of Disability, Ageing and Carers 2015 (SDAC 2015), a national survey of disability conducted by the Australian Bureau of Statistics. (Australian Bureau of Statistics (2016b)) The total weights associated with individuals with ID from the 2015 SDAC represented the total number of people with ID in Australia. Using this input, and our assumptions on the prevalence of familial ID, we have estimated the number of people with ID by their severity, and number of people with familial ID. (Table 3)
National estimate of ID by severity, or by familial cause
| Age group | Number of people with ID recruited to date | Number of moderate to severe ID in Australia (low estimate) | Number of moderate to severe ID in Australia (high estimate) | Number of mild ID in Australia (low estimate | Number of mild ID in Australia (high estimate) | Number of familial ID in Australia (low estimate) | Number of familial ID in Australia (high estimate) | Number of moderate to severe ID with familial cause (low estimate) | Number of moderate to severe ID with familial cause (high estimate) | Number of mild ID with familial cause (low estimate) | Number of mild ID with familial cause (high estimate) |
|---|---|---|---|---|---|---|---|---|---|---|---|
| 0–4 | 7 | 1,700 | 2,500 | 14,100 | 15,000 | 1,700 | 3,800 | 200 | 600 | 1,500 | 3,300 |
| 5–19 | 92 | 23,500 | 35,200 | 199,700 | 211,400 | 23,500 | 54,000 | 2,300 | 8,100 | 21,100 | 45,900 |
| 20–29 | 30 | 8,800 | 13,200 | 74,800 | 79,200 | 8,800 | 20,200 | 900 | 3,000 | 7,900 | 17,200 |
| 30–39 | 15 | 5,300 | 8,000 | 45,200 | 47,800 | 5,300 | 12,200 | 500 | 1,800 | 4,800 | 10,400 |
| 40–49 | 17 | 5,100 | 7,700 | 43,700 | 46,300 | 5,100 | 11,800 | 500 | 1,800 | 4,600 | 10,100 |
| 50–59 | 1 | 5,300 | 8,000 | 45,200 | 47,900 | 5,100 | 12,800 | 500 | 1,800 | 4,500 | 11,000 |
| 60–69 | 1 | 5,000 | 7,500 | 42,500 | 44,900 | 4,700 | 12,100 | 500 | 1,700 | 4,200 | 10,300 |
2.10 Lifetime costs
Lifetime costs for each household with a family member with ID were derived by multiplying the average cost for each age group by the number of years lived in each age group up to age 74, 68, and 59 for people with mild, moderate, and severe ID respectively (Bittles et al., 2002). Calculations were made both with and without applying a discount rate (3.5%).
2.11 Counterfactual simulation
The model is designed to analyse the cost-effectiveness of WGS in diagnosing the genetic cause of ID, comparing the costs, quality of life, and benefits gained from having a diagnosis using the population from the “prospective” group. Data from the “retrospective” group are used to impute lifetime costs for patients with and without a diagnosis as depicted in Figure 2.
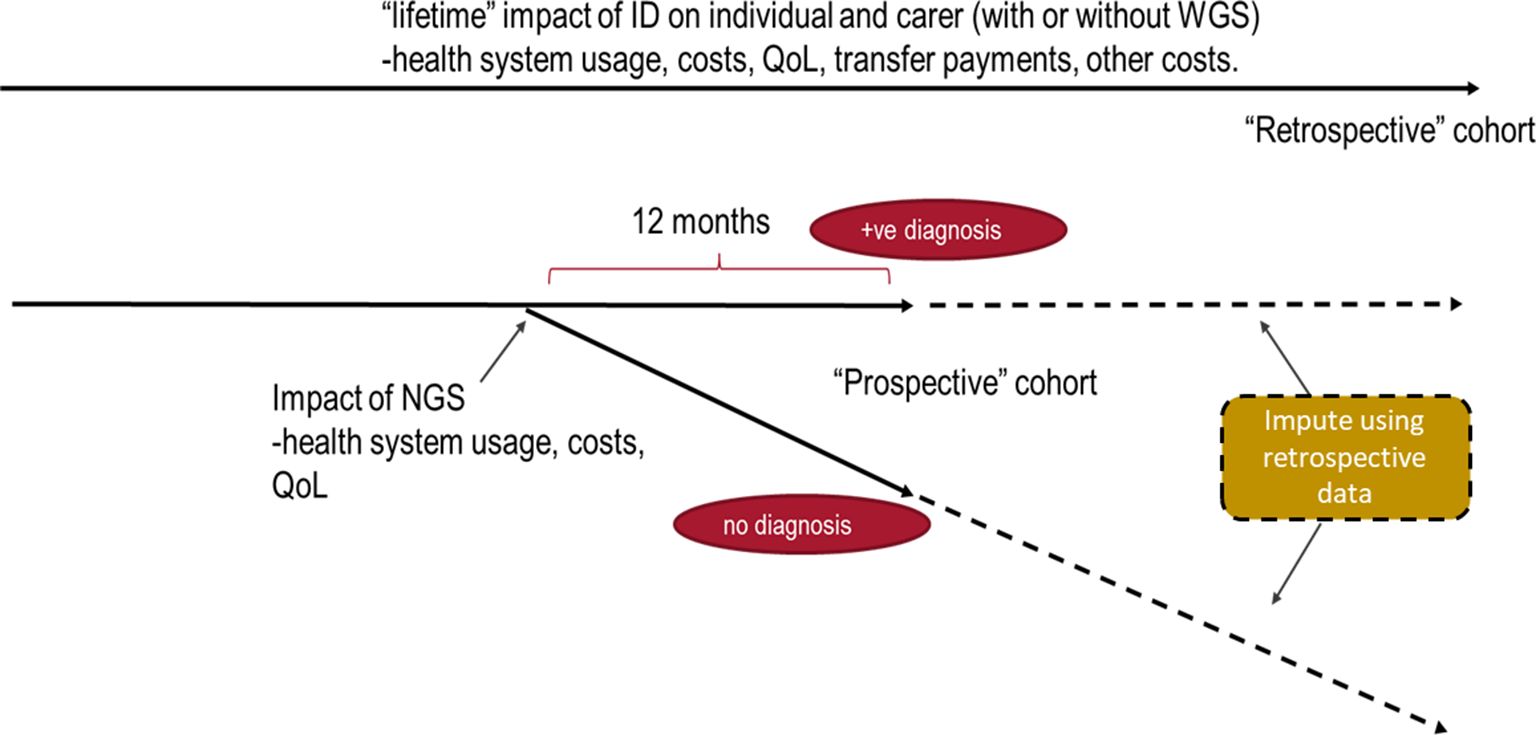

Data collected from “retrospective” and “prospective” cohorts will be used to assess the lifetime burden associated with ID without the WGS, and with WGS, respectively.
3. Discussion
IDMOD is the first microsimulation model of familial ID, and its economic and psychosocial consequences. The economic costs of familial ID are often understated in the literature because most studies are restricted to a single perspective of the cost burden (usually the health system), do not use a familial ID cohort and/or include predominantly children and young people with mild ID. Understanding the factors associated with of ID is ID is important for policy makers to allocate appropriate resources to support the families affected by the condition. IDMOD was developed for the purpose of providing the costs of ID from multiple perspectives. IDMOD is also used to study the associated economic and social outcomes associated with ID on families and on Australian and State governments agencies providing special education, and welfare services including the newly implemented National Disability Insurance Scheme (NDIS).
It should be noted that at the time of publication, there were small numbers in some age groups, but this limitation should be overcome when recruitment is completed. Another limitation is that the data, although weighted, was mainly collected only in NSW, the most populous Australian State. However, the data is still quite representative as NSW represents a third of the Australian population with age and regional population distributes similar to Australia as a whole. Nonetheless, this was a large-scale project that collects extensive primary data, given the lack of large nationally representative datasets that microsimulation models are typically based on. The GoLD cohort is considered to be quite representative as it is a state-wide service.
One of the important factors in managing ID is achieving a molecular diagnosis of the cause of the condition. (Redin et al., 2014) Until recently, the cause of severe ID was, in most cases, not identified. (Rauch et al., 2006) The standard diagnostic pathway often represented a diagnostic journey with significant social and economic consequences for patients, and their families with delayed or inappropriate clinical management. (Biesecker and Green, 2014; Redin et al., 2014) With advances in new diagnostic technology, such as next generation sequencing, we expect the efficiency of achieving a diagnosis to be greatly improved (Stark et al., 2017), however, WGS is not yet available as standard of care (Doble et al., 2016; Doble et al., 2017). Diagnosing the aetiology of ID is important for the individual as well as the affected families, with significant implications for prognosis, treatment, access to support services, and reproductive planning, including potential use of reproductive technologies such as In vitro Fertilisations (IVF) and preimplantation genetic diagnosis (PGD), and quality of life. (Schieppati et al., 2008) IDMOD will be utilised to model the costs effectiveness of implementing the latest genetic sequencing technology, subsequent changes in treatment and use of reproductive technologies.
IDMOD was developed with the flexibility to add further modelling components including new treatments as they become available. It is also an important international contribution given it is the first model of its kind, and the results are likely to be widely used as has been the case with our previous studies (Ewans et al., 2018b; Stark et al., 2017; Tan et al., 2017). The model will test a number of hypotheses, including that ID is associated with poorer QoL, psychosocial outcomes and economic outcomes for both patients and carers using comparison with published norms for the validated and standardised questionnaires included in the EPIC-ID survey.
References
-
1
2016 Census - Employment, Income and Education, TableBuilder. Findings based on use of ABS TableBuilder dataCanberra: Australian Bureau of Statistics.
- 2
- 3
- 4
- 5
- 6
-
7
An assessment of global health status in survivors of acute lymphoblastic leukemia in childhoodThe American journal of pediatric hematology/oncology 15:284–290.
-
8
Medical disorders of adults with mental retardation: a population studyAmerican journal of mental retardation: AJMR 99:595–604.
-
9
Diagnostic clinical genome and exome sequencingThe New England journal of medicine 371:1170.https://doi.org/10.1056/NEJMc1408914
-
10
The influence of intellectual disability on life expectancyThe journals of gerontology 57:M470–472.https://doi.org/10.1093/gerona/57.7.m470
-
11
Reliability and validity of a short version of the general functioning subscale of the McMaster family assessment deviceFamily process 54:116–123.https://doi.org/10.1111/famp.12113
-
12
Understanding Complementary Therapies-A guide for people with cancer, their families and friendsSydney: Cancer Council Australia.
-
13
Economic costs associated with mental retardation, cerebral palsy, hearing loss, and vision impairment--United States, 2003MMWR. Morbidity and mortality weekly report 53:57–59.
-
14
The impact of caring for an adult with intellectual disability and psychiatric comorbidity on carer stress and psychological distressJournal of intellectual disability research : JIDR 60:553–563.https://doi.org/10.1111/jir.12269
-
15
Tenancy Charges and Account Management - Previous Policy Rules and RatesTenancy Charges and Account Management - Previous Policy Rules and Rates.
- 16
- 17
-
18
The promise of personalised medicineLancet 387:433–434.https://doi.org/10.1016/S0140-6736(16)00176-8
- 19
-
20
How much does intellectual disability really cost? first estimates for AustraliaJournal of intellectual & developmental disability 37:42–49.https://doi.org/10.3109/13668250.2011.648609
-
21
Whole-Exome sequencing reanalysis at 12 months boosts diagnosis and is cost-effective when applied early in Mendelian disordersGenetics in Medicine 20:1564–1574.https://doi.org/10.1038/gim.2018.39
-
22
Whole-Exome sequencing reanalysis at 12 months boosts diagnosis and is cost-effective when applied early in Mendelian disordersGenetics in medicine: official journal of the American College of Medical Genetics 20:1564–1574.https://doi.org/10.1038/gim.2018.39
-
23
Costs of caring for children with an intellectual developmental disorderDisability and health journal 8:646–651.https://doi.org/10.1016/j.dhjo.2015.03.011
-
24
Comprehensive health assessments for adults with intellectual disability living in the community - weighing up the costs and benefitsAustralian family physician 41:969–972.
-
25
Low physical fitness levels in older adults with Id: results of the HA-ID studyResearch in developmental disabilities 33:1048-–11058.https://doi.org/10.1016/j.ridd.2012.01.013
-
26
National Hospital Cost Data Collection, Public Hospitals Cost Report, Round 20 (Financial year 2015-16). IHPANational Hospital Cost Data Collection, Public Hospitals Cost Report, Round 20 (Financial year 2015-16). IHPA.
-
27
Caring for older people with an intellectual disability: a systematic reviewMaturitas 72:286–295.https://doi.org/10.1016/j.maturitas.2012.05.008
-
28
Accommodation for people with disabilities and the NDISAccommodation for people with disabilities and the NDIS.
-
29
Economic cost of autism in the UKAutism: the international journal of research and practice 13:317–336.https://doi.org/10.1177/1362361309104246
-
30
An introduction to STINMOD: a static microsimulation modelAn introduction to STINMOD: a static microsimulation model.
-
31
Supporting primary healthcare professionals to care for people with intellectual disability: a research agendaJournal of applied research in intellectual disabilities: JARID 28:33–42.https://doi.org/10.1111/jar.12132
-
32
Manual for the depression anxiety stress scales: Psychology Foundation of AustraliaManual for the depression anxiety stress scales: Psychology Foundation of Australia.
-
33
Fragile X and X-linked intellectual disability: four decades of discoveryAmerican journal of human genetics 90:579–590.https://doi.org/10.1016/j.ajhg.2012.02.018
-
34
High health care costs among adults with intellectual and developmental disabilities: a population-based studyJournal of intellectual disability research: JIDR 63:124–137.https://doi.org/10.1111/jir.12554
-
35
Family impact in intellectual disability, severe mental health disorders and mental health disorders in ID. A comparisonResearch in developmental disabilities 32:2847–2852.https://doi.org/10.1016/j.ridd.2011.05.021
-
36
Identifying feeding problems in mentally retarded persons: development and reliability of the screening tool of feeding problems (step)Research in developmental disabilities 22:165–172.https://doi.org/10.1016/s0891-4222(01)00065-8
-
37
Prevalence of intellectual disability: a meta-analysis of population-based studiesResearch in Developmental Disabilities 32:419–436.https://doi.org/10.1016/j.ridd.2010.12.018
-
38
NDIS Price Guide Victoria, New South Wales, Queensland, Tasmania, Version release date: 11 July 2016NDIS Price Guide Victoria, New South Wales, Queensland, Tasmania, Version release date: 11 July 2016.
-
39
NDIS Price Guide Specialist Disability AccommodationNDIS Price Guide Specialist Disability Accommodation.
-
40
NDIS Price Guide Victoria, New South Wales, Queensland, TasmaniaNDIS Price Guide Victoria, New South Wales, Queensland, Tasmania.
-
41
Trends and variations in per capita expenditure on adult intellectual disabilities health and social care across Scotland, and by urban/rural classJournal of applied research in intellectual disabilities: JARID 32:121–130.https://doi.org/10.1111/jar.12514
-
42
Resource use and cost of annual health checks in primary care for people with intellectual disabilitiesJournal of intellectual disability research : JIDR 63:233–243.https://doi.org/10.1111/jir.12569
-
43
Diagnostic yield of various genetic approaches in patients with unexplained developmental delay or mental retardationAmerican Journal of Medical Genetics Part A 140A:2063–2074.https://doi.org/10.1002/ajmg.a.31416
-
44
Efficient strategy for the molecular diagnosis of intellectual disability using targeted high-throughput sequencingJournal of medical genetics 51:724–736.https://doi.org/10.1136/jmedgenet-2014-102554
-
45
Validity and reliability of the Assessment of Quality of Life (AQoL)-8D multi-attribute utility instrumentThe patient 7:85–96.https://doi.org/10.1007/s40271-013-0036-x
-
46
Financial and employment impact of intellectual disability on families of children with autismFamilies, systems & health: the journal of collaborative family healthcare 33:36–45.https://doi.org/10.1037/fsh0000102
-
47
Why rare diseases are an important medical and social issueLancet 371:2039–22041.https://doi.org/10.1016/S0140-6736(08)60872-7
-
48
Health&WealthMOD: a microsimulation model of the economic impacts of diseases on older workersInternational Journal of Microsimulation 2:58–63.
-
49
Long-Term economic impacts of exome sequencing for suspected monogenic disorders: diagnosis, management, and reproductive outcomesGenetics in Medicine 21:2586–2593.https://doi.org/10.1038/s41436-019-0534-x
-
50
Health&WealthMOD2030: A microsimulation model of the long term economic impacts of disease leading to premature retirements of Australians aged 45–64 years OldInternational Journal of Microsimulation 7:94–118.
-
51
Economic costs of informal care for people with chronic diseases in the community: lost income, extra welfare payments, and reduced taxes in Australia in 2015-2030Health & social care in the community 27:493–501.https://doi.org/10.1111/hsc.12670
-
52
Intellectual disability and autism: socioeconomic impacts of informal caring, projected to 2030The British journal of psychiatry: the journal of mental science pp. 1–7.https://doi.org/10.1192/bjp.2019.204
-
53
Care&WorkMOD: an Australian microsimulation model projecting the economic impacts of early retirement in informal carersInt J Microsimulation 11:78–99.
-
54
Prospective comparison of the cost-effectiveness of clinical whole-exome sequencing with that of usual care overwhelmingly supports early use and reimbursementGenetics in medicine: official journal of the American College of Medical Genetics 19:867–874.https://doi.org/10.1038/gim.2016.221
-
55
Correction: does genomic sequencing early in the diagnostic trajectory make a difference? A follow-up study of clinical outcomes and cost-effectivenessGenetics in medicine: official journal of the American College of Medical Genetics 21:516–516.https://doi.org/10.1038/s41436-018-0078-5
-
56
Health issues for adults with developmental disabilityResearch in developmental disabilities 23:422–445.https://doi.org/10.1016/s0891-4222(02)00143-9
-
57
Diagnostic impact and cost-effectiveness of whole-exome sequencing for ambulant children with suspected monogenic conditionsJAMA pediatrics 171:855–862.https://doi.org/10.1001/jamapediatrics.2017.1755
-
58
SHUT OUT: The Experience of People with Disabilities and their Families in Australia. In National People with Disabilities and Carer Council (Ed.), National Disability Strategy Consultation Report prepared by the National People with Disabilities and Carer CouncilSHUT OUT: The Experience of People with Disabilities and their Families in Australia. In National People with Disabilities and Carer Council (Ed.), National Disability Strategy Consultation Report prepared by the National People with Disabilities and Carer Council.
-
59
Multiattribute utility function for a comprehensive health status classification system. health Utilities index mark 2Medical care 34:702–722.https://doi.org/10.1097/00005650-199607000-00004
-
60
Informal caregivers of people with an intellectual disability in England: health, quality of life and impact of caringHealth & social care in the community 25:951–961.https://doi.org/10.1111/hsc.12393
-
61
Genetic and epigenetic networks in intellectual disabilitiesAnnual review of genetics 45:81–104.https://doi.org/10.1146/annurev-genet-110410-132512
-
62
Genetic diagnosis of developmental disorders in the DDD study: a scalable analysis of genome-wide research dataThe Lancet 385:1305–1314.https://doi.org/10.1016/S0140-6736(14)61705-0
-
63
Making new genetic diagnoses with old data: iterative reanalysis and reporting from genome-wide data in 1,133 families with developmental disordersGenetics in Medicine 20:1216–1223.https://doi.org/10.1038/gim.2017.246
-
64
The impact of caring for adults with intellectual disability on the quality of life of parentsJournal of intellectual disability research: JIDR 56:609–619.https://doi.org/10.1111/j.1365-2788.2011.01501.x
Article and author information
Author details
Deborah J Schofield

Rupendra N Shrestha
Funding
No specific funding for this article is reported.
Acknowledgements
Not applicable.
Publication history
- Version of Record published: April 30, 2020 (version 1)
Copyright
© 2020, Schofield et al.
This article is distributed under the terms of the Creative Commons Attribution License, which permits unrestricted use and redistribution provided that the original author and source are credited.