
This article contains 2 figures and 3 tables.
Figures
Tables
| Category | Item | Cost (annual unless specified otherwisea) | Perspective | Data source | Note |
|---|---|---|---|---|---|
| Health system | |||||
| Inpatient | AR-DRG | Government | NSW Admitted Patient Data Collection | ||
| Emergency department | URG | Government | NSW Emergency Department Data Collection | ||
| Outpatient consultation | Government | Medicare Benefits Schedule data | |||
| Naturopatha | $107 per session | OOP | (Cancer Council Australia, 2018) | ||
| Prescription medication | Government | Pharmaceutical Benefits Scheme data | |||
| Supplements and OTC medication | Self-reported | OOP | |||
| Supported accommodation & respite | |||||
| Residential care | $16,973 Income and assets mean tested (no more than $$27,754 per year) | Government | (Australian Government Department of Health, 2017) | ||
| Residential care-basic daily fee | $18,038 | Government | (Australian Government Department of Health, 2017) | Basic daily fee is paid out of pocket for over 65 residents. Fee for under 65 disabled residents is covered by the NDIS. | |
| Specialist Disability Accommodationa | $4,452-$59,375 | Government | (National Disability Insurance Agency, 2017) | Cost of accommodation is subject to patients’ needs (accessibility, on-site overnight assistance, or high level of physical access provision with high support need) and number of people sharing the accommodation. | |
| Supported Independent Livinga | $1,727-$4,951 per week | Government | (National Disability Insurance Agency, 2016) | Cost of supported independent living depends on support needed to undertake household tasks and/or self-care activities. | |
| Respite care | $13,024 | Government | (Australian Institute of Health and Welfare, 2017) | ||
| Rent subsidy | Market rent less 25%–30% of household income | Government | (Department of Communities and Justice NSW, 2019) | Eligibility for government subsidy is income tested. | |
| Welfare | |||||
| Disability support pension (under 20 years and living independent) | $13,335 | Government | (Australian Government Social Security Guide, 2018a) | ||
| Disability support pension (under 18 years and living at home) | $8,104 | Government | (Australian Government Social Security Guide, 2018a) | ||
| Disability support pension (18–20 years and living at home) | $9,393 | Government | (Australian Government Social Security Guide, 2018a) | ||
| Disability support pension (above 20 years old) | $23,254 | Government | (Australian Government Social Security Guide, 2018a) | ||
| Mobility allowance standard rate | $2,493 | Government | (Australian Government Social Security Guide, 2018b) | ||
| Mobility allowance higher rate | $3,487 | Government | (Australian Government Social Security Guide, 2018b) | ||
| Supported employment | $5,031 | Government | (Australian Institute of Health and Welfare, 2017) | ||
| Education | |||||
| Primary student-Supplementary level support | $16,107 | Government | (Department of Education, 2019) | ||
| Primary student-Substantial level support | $27,903 | Government | (Department of Education, 2019) | ||
| Primary student-Extensive level support | $46,733 | Government | (Department of Education, 2019) | ||
| Secondary student-Supplementary level support | $18,958 | Government | (Department of Education, 2019) | ||
| Secondary student-Substantial level support | $30,789 | Government | (Department of Education, 2019) | ||
| Secondary student-Extensive level support | $49,604 | Government | (Department of Education, 2019) | ||
| Early intervention classa | $185 per hour | Government | (National Disability Insurance Agency, 2018) | ||
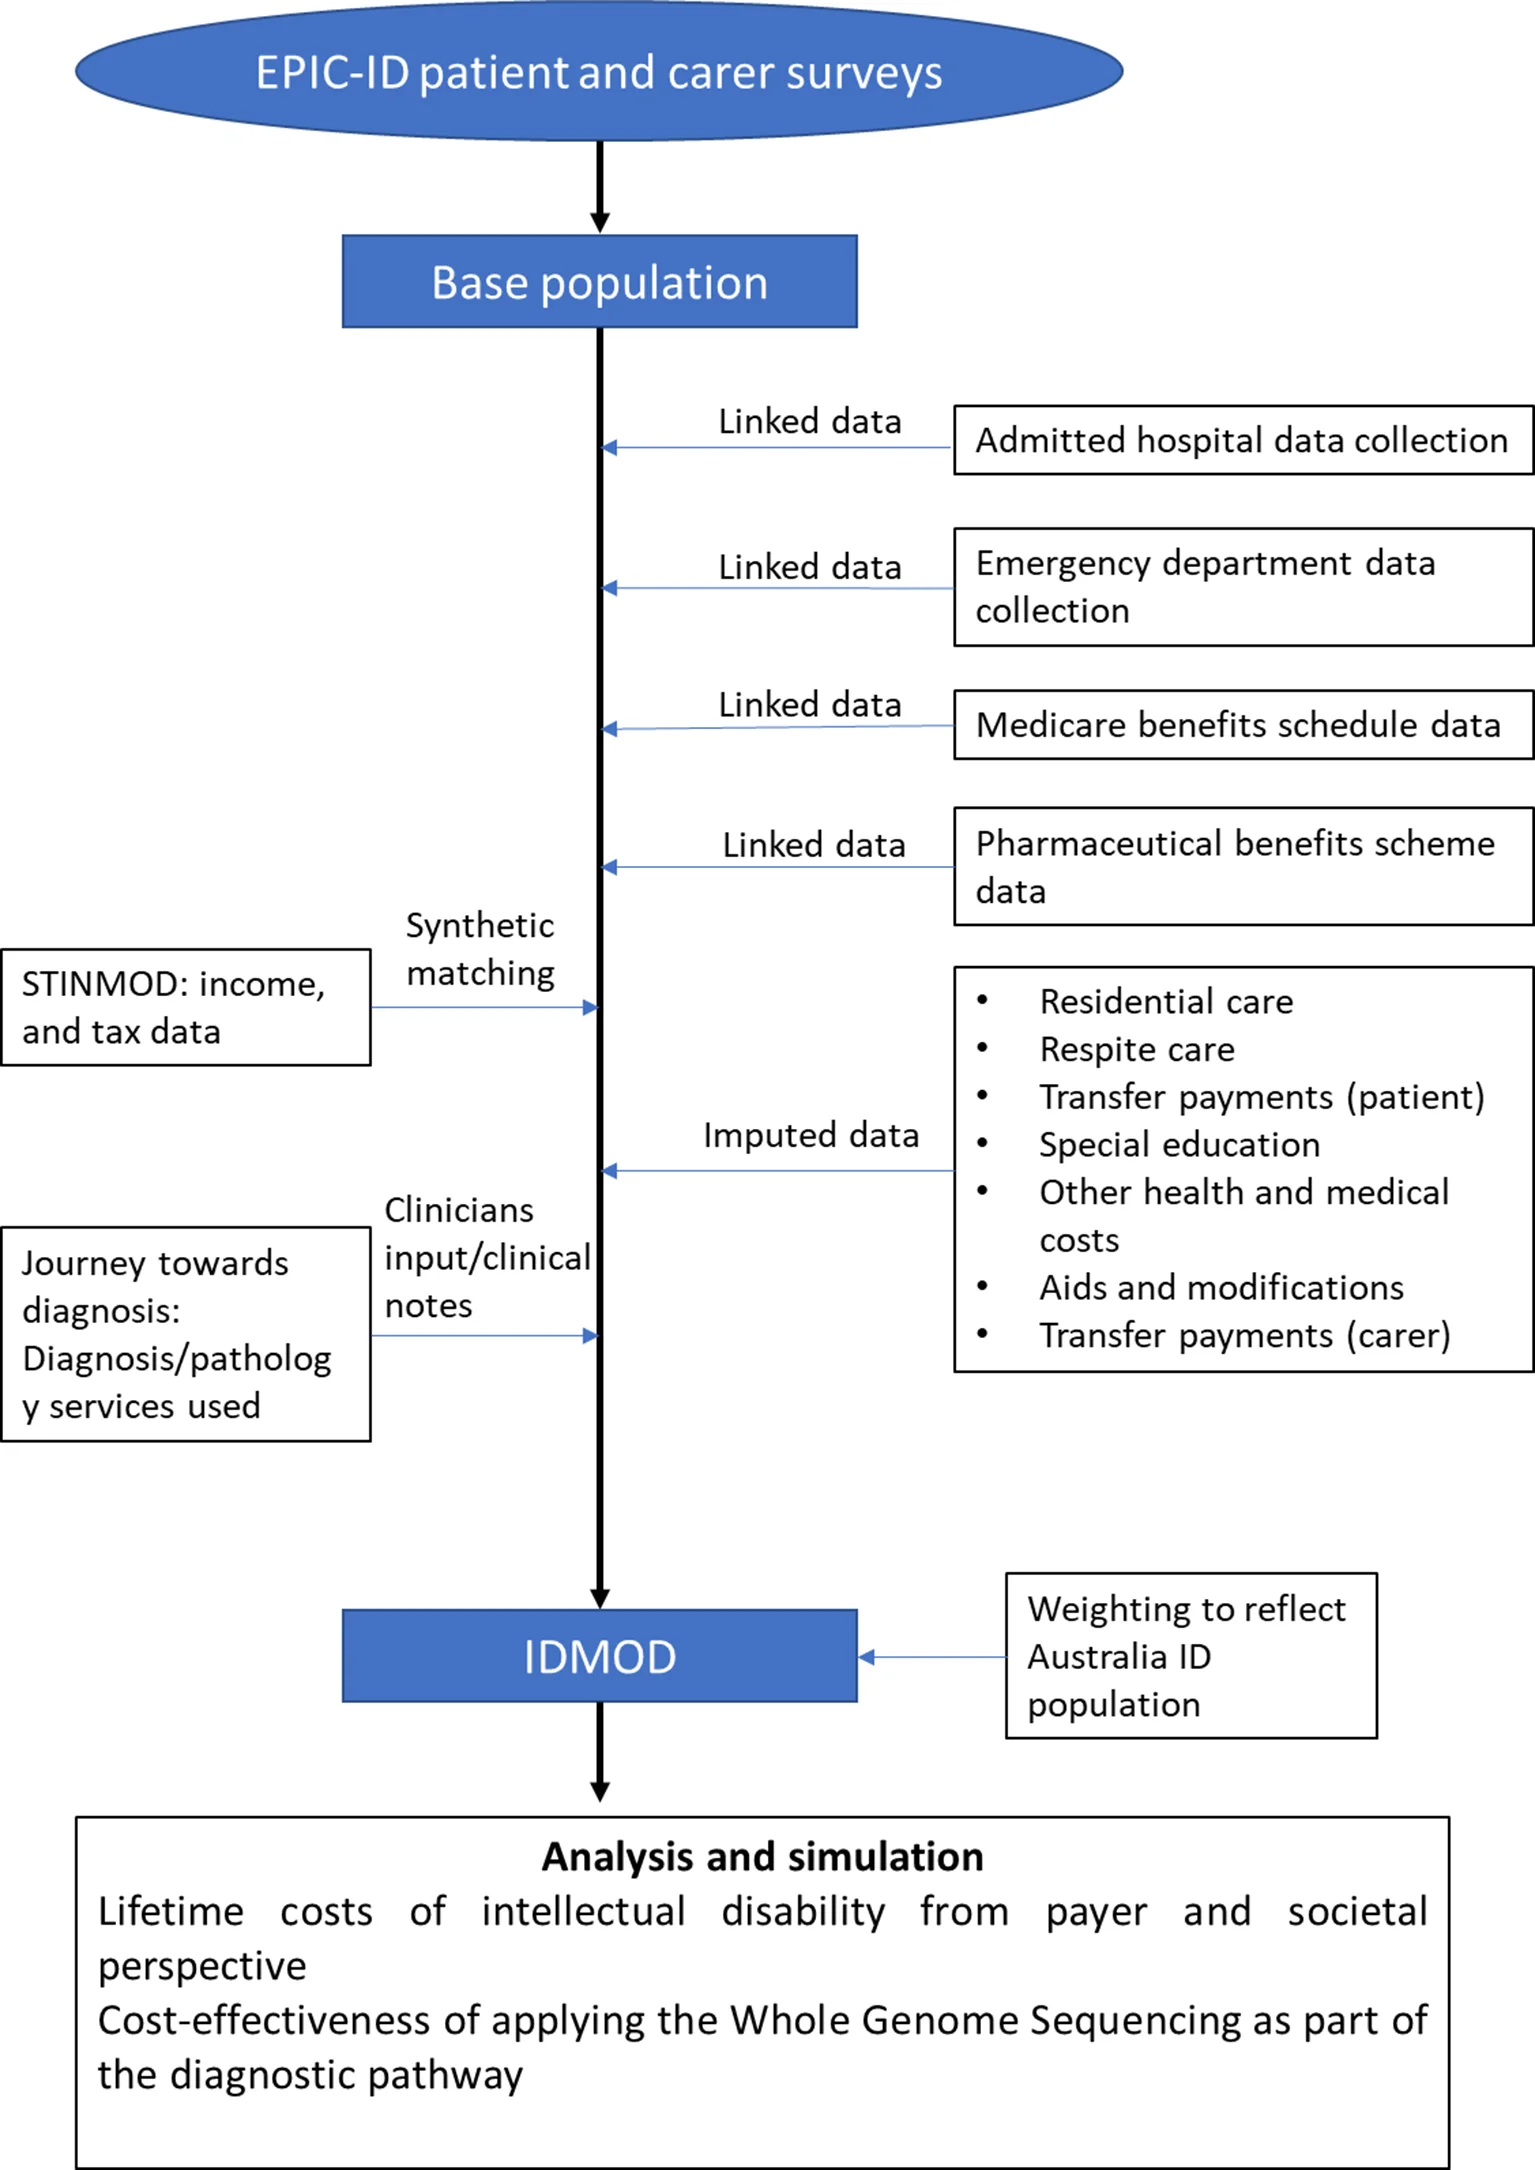
| Aids and modifications | Self-reported | OOP/Government | EPIC-ID questionnaire recorded costs and subsidies received for aids and modifications, including nappies, special diet, mobility aids (eg, wheelchair), lifting/hoisting apparatus, peg feeding equipment, visual, hearing and communication aids, orthotics, home modifications (eg, stairs, bedroom), and vehicle modifications. | ||
| Carer’s costs | |||||
| Welfare (eg, carer payment, and carer allowance) | Self-reported | Government | Carer payment and carer allowance are obtained from EPIC-ID questionnaire response. | ||
AR-DRG = Australian Refined-Diagnosis Related Group; OOP = Out-of-pocket; OTC = Over-the-counter; URG = Urgency Related Group;
Costs that were not reported in the year of 2017 were adjusted at an inflation rate of 3% per annum.
| Age | Sex | State/Territory | Highest qualification attained | Proportion | Upper bound | Lower bound |
|---|---|---|---|---|---|---|
| 25–29 years | Male | New South Wales | Postgraduate degree, graduate diploma/graduate certificate | 0.074 | 0.000 | 0.074 |
| 25–29 years | Male | New South Wales | Bachelor degree | 0.234 | 0.074 | 0.308 |
| 25–29 years | Male | New South Wales | Advanced diploma/diploma | 0.212 | 0.308 | 0.520 |
| 25–29 years | Male | New South Wales | Certificate III / IV | 0.079 | 0.520 | 0.598 |
| 25–29 years | Male | New South Wales | Certificate I / II | 0.001 | 0.598 | 0.599 |
| 25–29 years | Male | New South Wales | Certificate not further defined | 0.022 | 0.599 | 0.621 |
| 25–29 years | Male | New South Wales | No non-school qualification | 0.282 | 0.621 | 0.903 |
| 25–29 years | Male | New South Wales | Level not determined | 0.097 | 0.903 | 1.000 |
| Age group | Number of people with ID recruited to date | Number of moderate to severe ID in Australia (low estimate) | Number of moderate to severe ID in Australia (high estimate) | Number of mild ID in Australia (low estimate | Number of mild ID in Australia (high estimate) | Number of familial ID in Australia (low estimate) | Number of familial ID in Australia (high estimate) | Number of moderate to severe ID with familial cause (low estimate) | Number of moderate to severe ID with familial cause (high estimate) | Number of mild ID with familial cause (low estimate) | Number of mild ID with familial cause (high estimate) |
|---|---|---|---|---|---|---|---|---|---|---|---|
| 0–4 | 7 | 1,700 | 2,500 | 14,100 | 15,000 | 1,700 | 3,800 | 200 | 600 | 1,500 | 3,300 |
| 5–19 | 92 | 23,500 | 35,200 | 199,700 | 211,400 | 23,500 | 54,000 | 2,300 | 8,100 | 21,100 | 45,900 |
| 20–29 | 30 | 8,800 | 13,200 | 74,800 | 79,200 | 8,800 | 20,200 | 900 | 3,000 | 7,900 | 17,200 |
| 30–39 | 15 | 5,300 | 8,000 | 45,200 | 47,800 | 5,300 | 12,200 | 500 | 1,800 | 4,800 | 10,400 |
| 40–49 | 17 | 5,100 | 7,700 | 43,700 | 46,300 | 5,100 | 11,800 | 500 | 1,800 | 4,600 | 10,100 |
| 50–59 | 1 | 5,300 | 8,000 | 45,200 | 47,900 | 5,100 | 12,800 | 500 | 1,800 | 4,500 | 11,000 |
| 60–69 | 1 | 5,000 | 7,500 | 42,500 | 44,900 | 4,700 | 12,100 | 500 | 1,700 | 4,200 | 10,300 |