The dynamic cross-sectional microsimulation model MOSART
- Statistics Norway, Norway
- Article
- Figures and data
-
Jump to
- Abstract
- 1. Introduction
- 2. Simulation
- 3. Database
- 4. Demographic events
- 5. Education
- 6. Labour supply and income
- 7. Simulation of pension expenditures
- 8. Distributional effects in the pension system
- 9. Accrued-to-date pension wealth
- 10. Summary
- Footnotes
- Appendix
- References
- Article and author information
Abstract
Based on a cross-section of the Norwegian population and a comprehensive set of characteristics MOSART is one of the longest running and actively used models in the family of dynamic microsimulation models. The first version was operative in 1990, and its main use has been projections and policy analyses regarding the design and evaluation of the Norwegian pension system. The aim of the paper is to provide an updated overview of the model with technical platform, comparison with other dynamic microsimulation models, the main events included and its main use.
1. Introduction
MOSART is a dynamic microsimulation model for education, labour supply and pensions. The core idea is to draw a sample of the population, and then simulate the further life course for each person. According to Orcutt (1957) and Orcutt et al. (1986) microsimulation is a useful method when behaviour is more easily modelled at the individual level, and then aggregated to totals, rather than modelling relations between aggregated variables. This is often the case when behaviour is non-linear and the population heterogenous, blurring the relation between micro and macro. Analyses of tax- and pension-systems are good examples.
MOSART is based on administrative data for the entire Norwegian population back to the 1960s and simulates the further life course for each person. The simulation is carried out by drawing if each person each year makes certain transitions from one state to another with transition probabilities depending on each person’s characteristics. These probabilities are estimated from observed transitions in a recent period. For years with actual observations simulation and transition probabilities are aligned to these. As common in several other dynamic microsimulation models (cf. O’Donoghue and Dekkers, 2018), events like births, deaths, migration, marriages, divorces, educational activities, labour force participation, retirement, income and wealth are included in the simulation. New-borns and new immigrants are added to the initial population each year. The earlier, but also the most fundamental, parts of the model are documented by Fredriksen (1998).
Securing the necessary financing to develop and maintain large scale microsimulation models such as MOSART can be a challenge in the long run. Like models in France, Canada and US, MOSART is situated in a statistical office and thus benefits from easy access to microdata. In addition, the MOSART project is fortunate to be embedded within a strong tradition of model-based policy analysis. Laying the groundwork for policymaking in Norway has for more than half a century been a collaboration between The Ministry of Finance (and other ministries) and Statistics Norway, with theoretical support from the academic sector, especially the University of Oslo.1 It is still the case today that Statistics Norway operates a wide selection of planning models actively used by the government, including both static and dynamic microsimulation models, macro models and environmental models.
The main purpose of MOSART is thus to facilitate government planning. This has resulted in emphasis being given to developing and maintaining a large, detailed and up to date database, and to doing simulations where current behaviour (often in the form of constant transition probabilities) continues indefinitely into the future. This constant behaviour assumption is unrealistic, but uncontroversial and easy, at least in principle, to understand. This facilitates planning because it precludes difficult discussions of how to model future behaviour (and governments might have their own thoughts on behaviour), while providing a consistent framework within which to discuss policy. Since MOSART has a central place in policy discussions it is also occasionally used by other public institutions, private organisations and the media. Even though policy analysis has priority, academic work is important in maintaining the quality of the model. An example of this is the work on mortality and life expectancy documented in Brinch et al. (2018).
Since the end of the 1990s MOSART has been used extensively in analysing the need for a pension reform, in planning the reform enacted in 2011, and in the evaluation of its effects. Based on similar ideas found in Dekkers et al. (2018) in their analyses for Belgium, Sweden and Italy, MOSART has been used for both (i) assessing the budgetary impact of ageing and different designs of the reform and (ii) assessing pension adequacy/distributional questions. While budgetary impacts from ageing have been analysed by microsimulation models in several countries, see Dekkers and Van den Bosch (2016), MOSART has also been extensively used in distributional analysis. In contrast to most other countries, MOSART was also extensively used in developing the pension reform.
In a dynamic microsimulation model, pension benefits are calculated from labour market earnings and other relevant characteristics according to an accurate description of the pension system. At present the pensions covered by MOSART include old-age pensions, disability pensions and surviving spouse pensions in the National Insurance Scheme (NIS), early retirement benefits in both the private and the public sector, and occupational pensions in the public sector. In addition to the analyses of effects from the pension reform, the model has also been used regularly for projecting the labour force by level and field of education.
In the next sections we will present and discuss simulation techniques, technical platform and data used. The main data input is based on administrative registers and contain information about the entire population. Thereafter we describe and discuss the design of the main blocks of the model regarding demographics, education, retirement, labour market, earnings, pensions and fiscal effects. In addition to giving an account of how MOSART is used in analysing fiscal effects of the Norwegian pension reform we discuss different approaches used by the model to analyse distributional effects. Finally, we present how we use the model to calculate accrued to date entitlements.
2. Simulation
Dynamic microsimulation covers a large variety of life cycle models. Further development after the pioneering work by Orcutt (1957) is discussed in among others O’Donoghue (2001), Wolfson (2009), Li and O’Donoghue (2013), O’Donoghue (2014), Dekkers and Van den Bosch (2016) and O’Donoghue and Dekkers (2018). Dynamic microsimulation models can be grouped in two different types: (i) the longitudinal type, and (ii) the cross-sectional type. The difference between the two groups depends on the order in which individuals are simulated over time. Simulation in MOSART may be characterized as cross-sectional because all aspects of the population in one year are simulated before the model starts simulating the next year. By contrast, longitudinal simulation models simulate one individual for all years between one and T before simulating the next individual.
A cross-sectional model is advantageous when simulating the distributional effects of a change in the pension system because it allows for interaction between individuals. Dekkers and Van den Bosch (2016) conclude that cross-sectional models are therefore more suitable than longitudinal for the simulation of household income, inequality, poverty risks and adequacy of social security and pension benefits. Longitudinal models are more suited to analysing the budgetary impacts of ageing.
Dekkers and Van den Bosch (2016) also point out that cross-sectional microsimulation models are more common than longitudinal. The models used in France, Sweden, Belgium and Luxembourg, Hungary, UK and US are of the cross-sectional type. In most of these countries the models are also used to simulate budgetary costs of ageing, but in Belgium and Luxembourg these costs are simulated by a semi-aggregate model. In Norway budgetary costs connected to pensions are simulated using the MOSART-model, while budgetary costs related to an increasing amount of health and care services, due to an ageing population, are simulated by a semi-aggregate model.
A further common characteristic for MOSART and the cross-sectional models used in the other countries mentioned above is the fact that they are based on discrete time, cf. Li et al. (2014). The combination of discrete time and cross-sectional simulation has the advantage that it allows to use exogenous constraints on the number of events or objects within each time unit. External constraints may either be based on actual data for historical years, or on time series from e.g. a macroeconomic model. The demographic projections in MOSART are aligned to the results from Statistics Norway’s official population projections. The system for adjustments in the model is based on a (hypothetical) logistic representation of each probability pi for a person ‘i’ (or a specific group):
Here Xi is the vector of covariates for person (group) i, and β denotes the corresponding coefficients. The adjustment term δ is common to all (or a specific group) and is adjusted so that the sum of the probabilities gets (close enough) to its constraint.
An obvious weakness, however, is that this method does not allow for competing risks. A significant weakness in MOSART is that the year was chosen as the basic time unit. Most pension benefits do not follow the calendar year but occur within a year. With todays’ access to data and far larger computer capacity compared to the beginning of the 1990s, when MOSART was established, we probably would have chosen month instead of year as the basic time unit. With this choice, several of the existing weakness in aggregating over the year would have been eliminated.
A discrete-time model requires that each event is simulated sequentially. As pointed out by Klevmarken (2008) it is unavoidable that the modeller therefore must choose an order by which these various characteristics can be changed within each period. The order of the processes in recursive simulation is important since earlier events may affect later events in the same period. The modelling in MOSART also follows the classical structure of such models with ‘recursive blocks’ that simplified may be presented as (i) the demographic block, (ii) the education block, (iii) the retirement block, (iv) the labour market block, (v) the earnings and income block, (vi) the pension benefits block and (vii) the fiscal block.
Like the cross-sectional dynamic microsimulation models in the other countries mentioned above the key methodology used in MOSART is stochastic simulation. As common in the other models, simulations are based on the confrontation of the deterministic part of a logistic regression model with a logistic random variable. The simulation will normally also use variance reduction methods. The simplest (and most common) variant is binomial events, where the expected number of events is equal to the sum of transition probabilities. By adding up these probabilities as each individual is handled, an event occurs every time the sum passes an integer value. The number of events will be constrained to its expectation value, and each individual will with some precautionary steps have a probability of experiencing an event that is equal to its transition probability. Variance reduction methods have a decisive effect on clarity, particularly that even small deviations cannot be explained away as mere simulation noise.
Simulation in MOSART starts in 1966, the year prior to the foundation of the National Insurance Scheme, including the start of most of the data and the earning of pension entitlements. The model runs through all historical years exactly as the simulation does, including the recursive part, except that the drawing of each characteristic is replaced with an imputation of the actual historical value. The reason for this apparent complication is the pension reform. Old age pension benefits will by this procedure depend on time of withdrawal and possible earning of pension entitlements after withdrawal. Full access to all modules for historical years is also an upside. We will for this reason have a close to seamless transition from history to simulation, with access to data and tables for historical years and improved possibilities for testing the model. As mentioned above, alignment methods using binary techniques to constrain model output to conform closely to externally derived macro-data are used to a large extent in MOSART.
In analyses of the pension system, pension benefits may be calculated with different set of rules within one simulation, and this aspect is generalised to all pension and tax rules. The simulation has a ‘pension system one’ that interacts with the simulation. An additional pension system may be requested and will calculate pension benefits from the same life courses with one or several changes in pension rules, but without any effect on the simulation. Different ‘rules’ may include withdrawal of pension at other ages and exclusion/increase of pension entitling income at specified ages. Multiple calculations of pension benefits remove almost all remaining simulation noise from the effect of changing a pension rule, making even small changes appear clear in magnitude and timing.
2.1 Programming
An important technical advance took place in the years 2006–2007 when MOSART was translated from Simula to C#, making it possible to run the model on any modern hardware. By transferring the simulations to a powerful computer, we were able to use the entire Norwegian population and to reduce running time by exploiting the benefits of multi-threading. At present MOSART is run on a Linux server with 1 Tb RAM and 64 (virtual) cores.
In addition to the need for more computational capacity, the transition from simulating a sample to simulating the entire population also requires techniques to make the simulations more efficient. The runtime for some calculations grows more than proportionally to the population size, and when the amount of information increases, the garbage-collector in C# runs into problems, both with respect to runtimes and stability. Beyond maximising all system parameters handling memory, this includes avoiding spending memory in the first place and recycling of objects. We have developed routines to simulate in parallel any parts of the calculations for each person that can be separated without any influence on other persons (multithreading). Division of calculations are normally carried out by each thread requesting a list of persons defined by gender, age and residency, as soon as the former list is calculated. Multithreading reduces overall runtimes with a factor of roughly 5–15 and is a necessary part of the model. The operative use of MOSART is described in more detail in Appendix A.1.
3. Database
MOSART utilizes administrative data registers available in Statistics Norway, covering the entire population back to the 1960s and 1970s. These data form the initial population of the model, but they are also used to estimate parameters and for testing. Maintenance and development of data have two distinctive steps. The first step is collecting new data and organizing them into what we refer to as the adapted source data, maintaining the original information and including variables that may come into use in the near future. The second step produces the initial population, a version where missing and/or inconsistent data are corrected, with a format streamlined for reading by the simulation model.
3.1 Adapted source data
Population statistics in Norway are based on the National Population Register (NPR). Following the population census in 1960, NPR was established in 1964, where everyone resident in Norway is assigned a unique identification number used by all administrative registers since. Persons not formally resident in Norway may also be assigned a temporary identification number (eg, asylum seekers and non-residents with taxable income in Norway).
The population in MOSART includes all permanent and temporary identification numbers allotted by NPR since 1964. All formal identification numbers are anonymized, and information for persons with multiple identification numbers are organized into one observation. The formal identification number includes sex and birth year. From NPR we have included the identity of parents, covering almost everyone born in Norway after 1948. For persons born prior to 1948, information on parents is available if the child lived on the same address as its parents in the 1960 census. We have also included place of birth, ie, municipality in Norway and country elsewhere.
Most of the data described below are time series, organized with separate files for each of them, with one record per person per year. Information will be either a state at the end of the year, or a sum over the year (eg, income variables). Each file is updated as new data become available.
The population file includes annual data for each year from 1964 (plus 1960) for every person resident in Norway (or deceased), municipality/zip-code, marital status, marital spouse, children, co-parent, and identities for all persons living on the same address. At present the population file is updated to 2018.
The education file includes annual information on highest completed education, year of completion and ongoing educational activity at October 1th. The education file starts in 1974, and at present it ends in 2018.
The pension file includes annual information on pension schemes in the National Insurance Scheme (NIS), including old age, disability and surviving spouse pension schemes. This information extends back to 1967, the year NIS was founded. A special early retirement scheme (AFP) was established in 1989 and is also included. In 1993 pension statistics were improved, and from this year and forward MOSART will also include information on work assessment allowances (WAA). Focus in MOSART is on long-term benefits, but WAA is included as a period on WAA is almost mandatory before disability pension may be granted. At present the pension file ends in 2018.
The income file starts in 1967 with annual information on pension entitling income. This income variable consisted originally of wages and labour income among the self-employed. Over the years, other labour related incomes have been included, such as paid sick leave, unemployment benefits, parental leave benefits. At present the file ends in 2017.
The employment file starts in 1995 and includes information at December 1th, with employment, working hours (grouped), wage income, employer and sector affiliation. Sector is divided into the State, remainder of public sector, private sector with early retirement scheme, and rest of private sector. Non-employed with pension entitling income will include both self-employed, persons with WAA and unemployed. At present the employment file ends in 2018, with monthly data from 2015. Before 1995 less reliable data back to 1983 are also included.
Both the data on pensions and labour supply are supplemented by annual data from the two major suppliers of public occupational pensions (SPK and KLP), covering most public employees with their pension schemes.
Information on dates is restricted to year and month, where month is the smallest time unit we believe will be relevant for a long-term model as MOSART (at least for a very long time). Removing day and dates removes the easiest routes to reverse identification of anonymized data.
3.2 Initial population
The adapted source data lacks a few characteristics necessary for the simulation and have a format that is cumbersome for reading by the simulation model. Any such data set will be specific to each version (generation) of the simulation model, and subject to recurring revisions. A separate programme modifies the adapted source data into what we refer to as the initial population. The files are split by gender and birth year, facilitating parallel reading. Combined with efficient use of C#, the entire population (10 million persons, 50 Gb data) is read into the simulation model in two minutes.
Missing/inconsistent characteristics are imputed/corrected. The initial population is available by different sample sizes, from the entire population (standard) down to 0,01 percent. In samples less than the entire population, relatives may not enter the sample, and relatives are replaced through simulation. Earlier versions of the initial population had a base year, with all data included. In the present version all data go as far ahead as possible for each characteristic, and the simulation of each characteristic starts where the data ends (or earlier if requested).
The same programme that delivers the initial population, can also create an ‘event’ file with one record per person per year with selected variables, suitable for estimation of transition probabilities. This way, we are guaranteed consistency in data definition between estimation and simulation and may also return parameters for unobserved heterogeneity.
4. Demographic events
The modelling of demographic events and the underlying demographic assumptions in MOSART are to a large degree based on the official population projections from Statistics Norway, see Leknes et al. (2018). The aggregate development in the main demographic components like fertility, mortality, in- and outmigration and domestic migration is thus aligned to fit the observed development combined with results that derived from the official population projections. However, it is quite easy to align the simulations to other aggregate assumptions, eg, population projections from Eurostat. More detailed fertility and mortality simulations in MOSART are used to decompose the aligned aggregates. Most importantly, MOSART also includes cohabitation and marriage as covariates, because fertility and other events depend on cohabitation/marital status, and this is also the case for some of the rules in the pension system.
4.1 Fertility
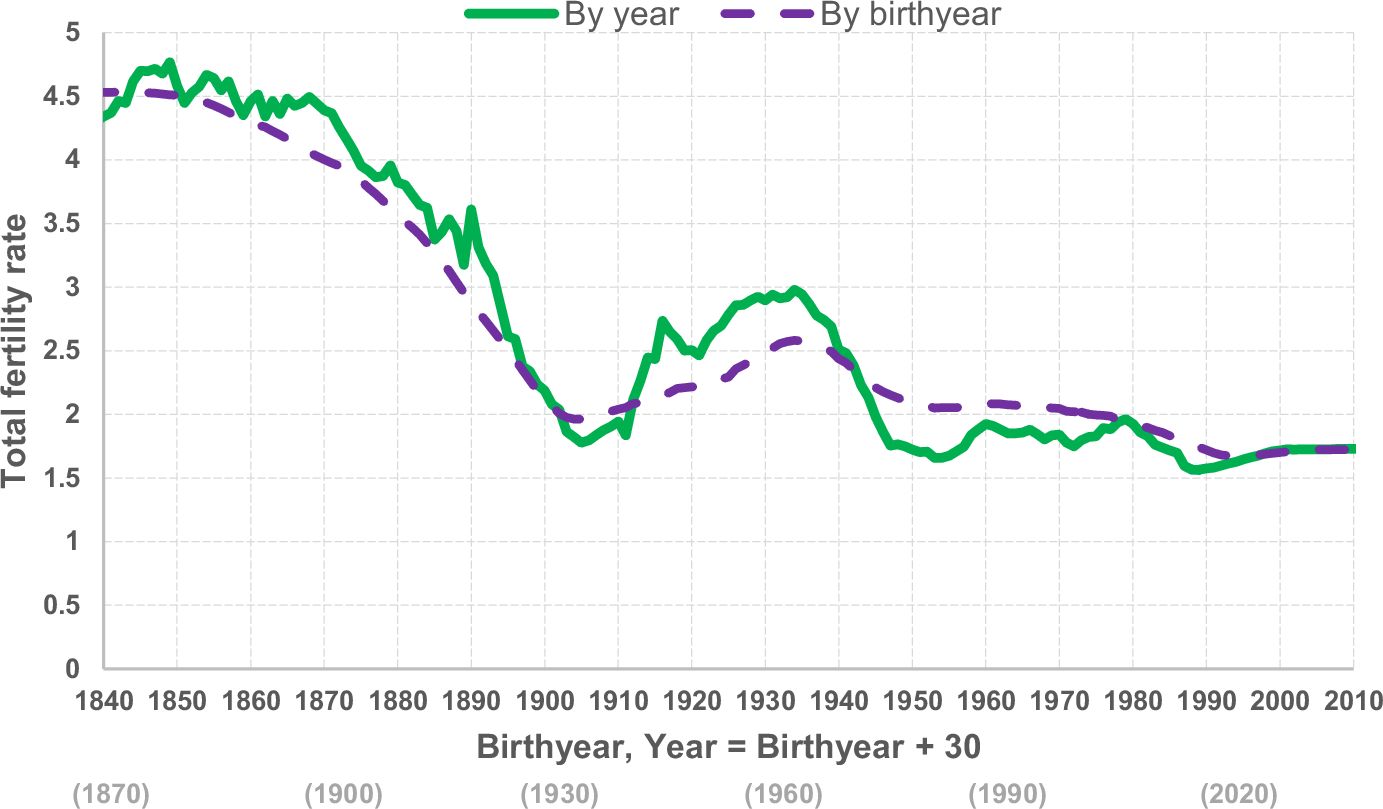
Births are estimated for women depending on age, number of children, age of the youngest child, cohabitation and educational activity. Each time a birth occurs, a child is added to the model population. Adjustments to make the simulated total number of births equal to observed levels or projected levels from the population projections, is roughly the same as adjusting individual fertility rates against the periodic total fertility rate (TFR). For each cohort TFR can be estimated as the average number of children per female in the cohort at an age of 49 years. Periodic TFRs are estimated as the sum of each period’s age-specific fertility rates.
The development in TFRs over the last 100 years is earlier documented by Brunborg and Mamelund (1994). Observations from the following years are added in Figure 1. Large variations in the annual number of births and thereby TFRs during the first half of the 1900s are still important for understanding the dynamics of the number of elderlies and projections of pension expenditures with the MOSART-model. The most important aspect is the low number of births between the two World Wars due to the economic depression. An increase in fertility from 1935–1946 measured by periodic TFR can probably be explained by postponing births until the economic depression and the following war was over. The large birth cohorts from 1946 until about 1970 replacing the small cohorts born between the wars is in combination with higher life-expectancy the main reason behind the expected large increase in Norwegian old-age pension expenditures from 2015–2040.

Total fertility rate by birthyear and year. Source: Statistics Norway.
The long-term falling trend in the cohort specific fertility rates since the peak of 2.6 for women born in 1935 is mainly caused by fewer women giving birth to three children or more. Falling fertility is a part of the so-called demographic transition most developed countries have experienced with first lower mortality and then lower fertility. Therefore, the periodic TFR dropped significantly up to 1977. After staying rather constant from 1977–2009 periodic TFR has dropped further in the last years and reached 1.62 in 2018, the lowest periodic TFR observed ever. In the medium alternative of Statistics Norway’s population projection from 2018 TFR is assumed to increase in the coming years to a long-term level of 1.76 from about 2030.
4.2 Mortality
Many studies have shown a remarkably strong association between mortality and socio-economic status. A study by Chetty et al. (2016) found that the gaps in life expectancy between the 1% richest and the 1% poorest individuals were 14.6 years for men and 10.1 years for women from 2000–2014 in the US. A recent Norwegian study shows that comparable magnitudes apply also to Norway in the same period, i.e. the difference in life expectancy between the richest and poorest 1% was 8.4 years for women and 13.8 years for men, see Kinge et al. (2019). Huisman et al. (2004) reports substantial differences in mortality by education among older individuals also for other European countries.
Building on this regularity, the estimated mortality in the MOSART model accounts for the relationship between socioeconomic differences and mortality. The mortality probabilities are based on observed mortality for the entire Norwegian population over the years 2001–2010. The basis for expected longevity is a logit model for the mortality probability of age group a in time t and county g, which is estimated separately for men and women. The explanatory variables are a set of individual background characteristics: educational attainment, disability history, and family status (single, married/cohabiting, with or without children). These enter as three groups of dummies, each interacted with functions of age to produce explanatory variable specific age-profiles. Also included in the set of explanatory variables is information on the longevity of parents. For individuals whose parents are still alive in a given year we impute parental longevities based on expected longevities, as a function of gender, year and cohort, taken from official mortality tables. See Brinch et al. (2018) for more details.
The base line mortality is adjusted to ensure that the covariates do not influence the average mortality by gender and age, and the overall increase in life expectancy is adjusted to match the main alternative in the population projections reported in https://www.ssb.no/en/befolkning/statistikker/folkfram. In 2017, life expectancy at birth was 84.3 years for women and 80.9 years for men. The gender gap has been decreasing steadily since 1987. Thirty years ago, the disparity was 6.8 years, while last year it fell to 3.4 years. In the projections, life expectancy increases additionally by more than seven years for men and six years for women by 2060, thus closing the gender gap to about 2 years.2
Stochastic drawing of events requires that the simulation comprises a fairly large number of units or replications before the expectation value is found with enough precision. In most cases, MOSART is simulated using either the entire population or a large enough sample of the population to ensure that expectation values are obtained. However, Brinch et al. (2018) and in the pension wealth project (see the last Section) the model was simulated with repeated draws for each individual to obtain expectation values at the individual level.
4.3 Migration
In- and outmigration by age, gender and three regions of origin from the population projections are used as exogenous input to the MOSART-model. In the model for migration in the population projections documented in Cappelen et al. (2015) in-migration depends on incomes per habitant in Norway compared to the three regions of origin, difference in the rate unemployment, the number of persons from each region of origin who have immigrated before and growth in population in the three regions:
Western Europe, Canada, US, Australia and New Zealand
Countries from Eastern Europe members in the European Union
Rest of the World
Out-migration is modelled by probabilities from the past ten years dependent on region of origin (Norway for non-immigrants), gender, age and period of residence.
In MOSART education is an important covariate for labour-market participation and incomes. Poor registration of level and field of education for immigrants has been a major weakness in projecting immigrants’ performance in the labour market. Several of them get the characteristics ‘unknown education’ implying lower labour market participation rates and higher risk of disability than for the average population. A large survey on immigrants’ educational background was conducted in 2011/2012, decreasing the share with unknown educational background substantially (Steinkellner and Holseter, 2013).
Immigration to Norway reached a peak in 2011 and 2012. In the following years immigration has decreased while out-migration has increased. Thus, net-immigration in 2017 was only one half of net-immigration in 2012. The fall in immigration in this period applies to almost every country of origin except Syria. By the three regions of origin the decrease in immigration is significant for both group 1 and 2, while the sharp increase in the number of immigrants from Syria has caused higher immigration from group three as a total.
According to the assumptions from Statistics Norway’s population projections from 2018, immigration from region one is expected to increase slightly in the first years due to positive business cycles in Norway. From 2021 and onwards immigration from this region is expected to be slightly reduced in the medium alternative due to lower growth in incomes in Norway than in the other countries of region 1. By the same reason immigration from region two is also expected to decrease. Because a large part of the immigrants from region three are refugees, there is lot of uncertainty in projecting future immigration for this group. With the medium alternative of the projections we assume immigration for this group to increase slightly Figure 2.
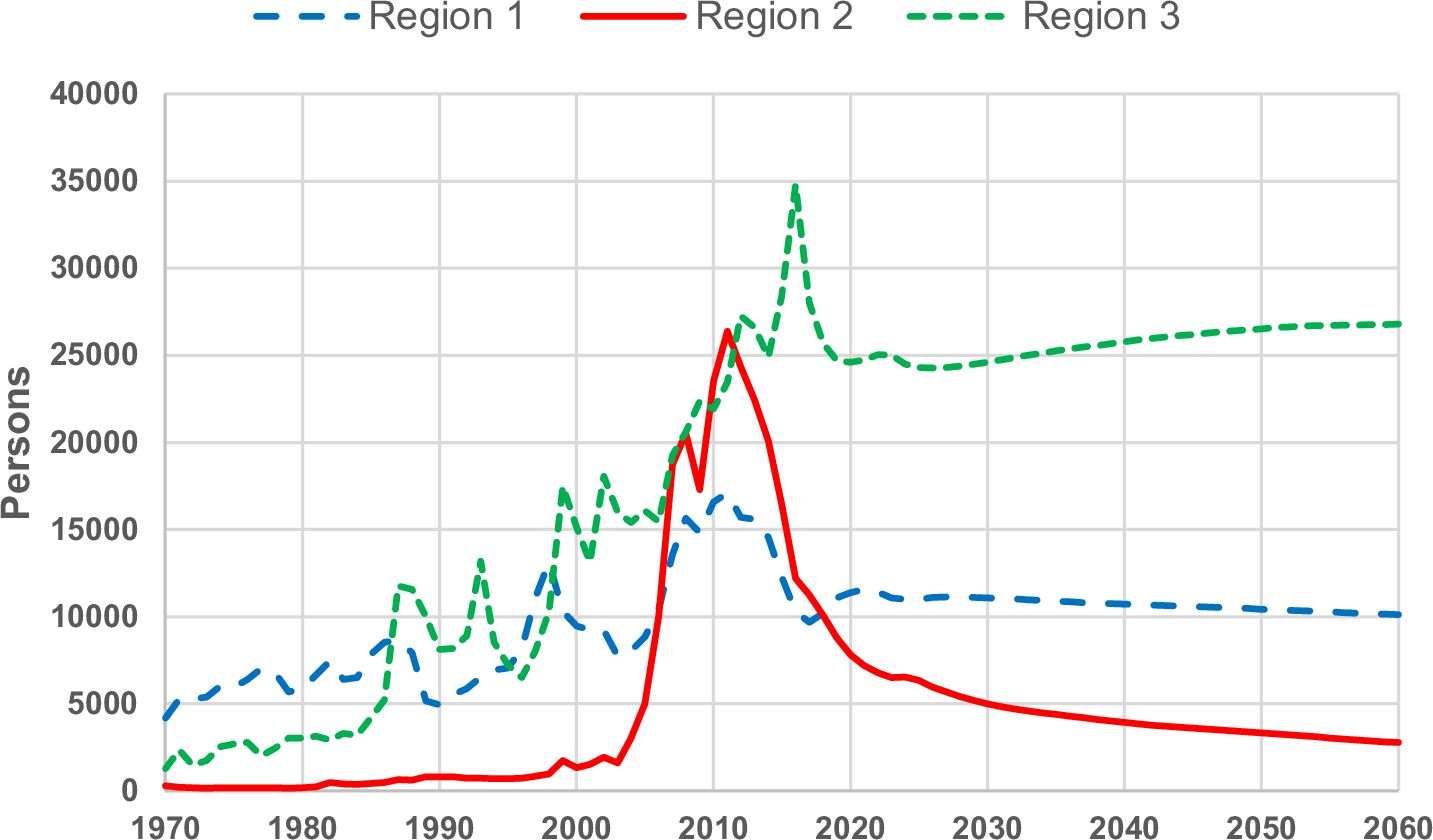
Observed and projected annual immigration by region of origin 1970–2060. Source: Statistics Norway.
Projections of population by main age groups based on the main alternative from Statistics Norway’s population for selected years are presented in Table 1. Total population is projected to increase by about 600 thousand from 2018–2035 and by 1.2 million from 2018–2060. Because of increasing life-expectancy and large cohorts born after Wold War II, the number of persons in age 80+ is expected to almost double from 2018–2035 and triple to 2060. A rather strong growth is also projected for persons in age 67–79 while population growth in age groups 0–19 and 20–66 is rather modest.
Total population by main age groups based on the main alternative from Statistics Norway’s population projections 2018. 1000 persons per January 1
| Total | 2018 | 2035 | 2060 |
|---|---|---|---|
| 5332 | 5938 | 6530 | |
| 0–19 years | 1 258 | 1 277 | 1 344 |
| 20–66 years | 3269 | 3455 | 3600 |
| 67–79 years | 580 | 755 | 885 |
| 80+ years | 226 | 425 | 702 |
-
Source, Statistics Norway.
4.4 Cohabitation and marriages
Cohabitation and marriages are decisive for fertility, and are also of importance for labour market participation, other events and some pension rules. The simulation of entering and dissolution of cohabitation and marriages in MOSART are made taking women as the point of departure. Single women entering cohabitation is simulated depending on her age and status (single, earlier cohabitant, widow, divorced). For marriage, cohabitation is in addition an important cofactor. If a cohabitation or a marriage occurs, the age of her coming partner/husband is drawn depending on her own age, and a random single man with proper age is drawn. It is an obvious weakness of the model that correlations in education and income between spouses are not taken into consideration. Divorces or dissolutions of cohabitation are simulated for cohabiting/married women depending on age and time spent in cohabitation/marriage. If a relation dissolves, her husband also becomes single. If a spouse dies, the survivor becomes widow (or widower). The block for cohabitation and marriages is based on Keilman and Brunborg (1995).
5. Education
Education is a characteristic that is important for a series of outcomes, such as attachment to the labor market, pensions and mortality. Educational background is not always implemented in microsimulation models, but some exceptions exist. Most commonly known are the Danish microsimulation project DREAM (Rasmussen and Stephensen, 2014) and CEPAM-mic used for EU-28 (Marois et al., 2017), although the disaggregation of education is less detailed than in MOSART. In MOSART, we define levels and fields of education, and project 28 different educational categories. The levels used are consistent with the definitions denoted ISCED 2011 from Unesco Institute for statistics, 2012.
Lower secondary education is comprised of compulsory education in Norway, and currently it lasts from age 6–16. Upper secondary education includes all who have completed three or four subsequent years in schooling, granting a degree at upper secondary level. Post-secondary, non-tertiary education is also included in this category. Bachelor level education includes education in universities or university colleges, and requires having completed two subsequent years, and most often three. Education at master’s level consists of two more years in advanced programs, and education at Ph.D.-level is also included.
Assigning educational characteristics to those in the future population who have not yet completed their education is done by simulating educational transitions. Assigning educational characteristics is an integrated part of the simulation model in MOSART, as opposed to e.g., in the Danish microsimulation model DREAM (Rasmussen and Stephensen, 2014). Start, level and field of education, completion of ongoing educational activity and, conditional on not completing, continue in education the next year are the main events used to assign educational background to the future population. For each year, all individuals have the possibility to make this series of transitions and their educational characteristics are updated upon completion.
The probabilities of the events described above are estimated using a series of Logit estimations, controlling for individual characteristics and educational history. All event probabilities are estimated separately according to gender allowing for individual characteristics to affect events differently for men and women.
Many of the migrants in the data are not registered with any educational attainment during the first years after arrival. Migrants who have education at upper secondary or tertiary level from their home country can choose to report their education, and if being approved by the Norwegian Agency for Quality Assurance in Education (NOKUT), it is registered in the educational register. To improve the data for migrants with unreported education, there was a survey in 2011, which has succeeded in improving the data quality substantially. However, 24% of the immigrant population were still registered without any educational attainment after the survey.
In the recent simulation, educational transition probabilities have been assumed to remain at the same level as the mean between 2009 and 2014, conditional on the educational and individual characteristics in the population. Over the last decades, there have been strong trends in favor of starting in higher education. However, when conditioning on individual characteristics and earlier educational attributes, there are no indications of such trends. Moreover, realized educational transitions are a combination of the behavior of individuals making choices and institutions offering places in education. To disentangle the two is challenging. Any trends in observed educational transitions could therefore not be interpreted as trends in behavior. Moreover, educational enrolment varies over the business cycle, and using an average over several years makes it possible to make projections that are neutral to business cycle conditions.
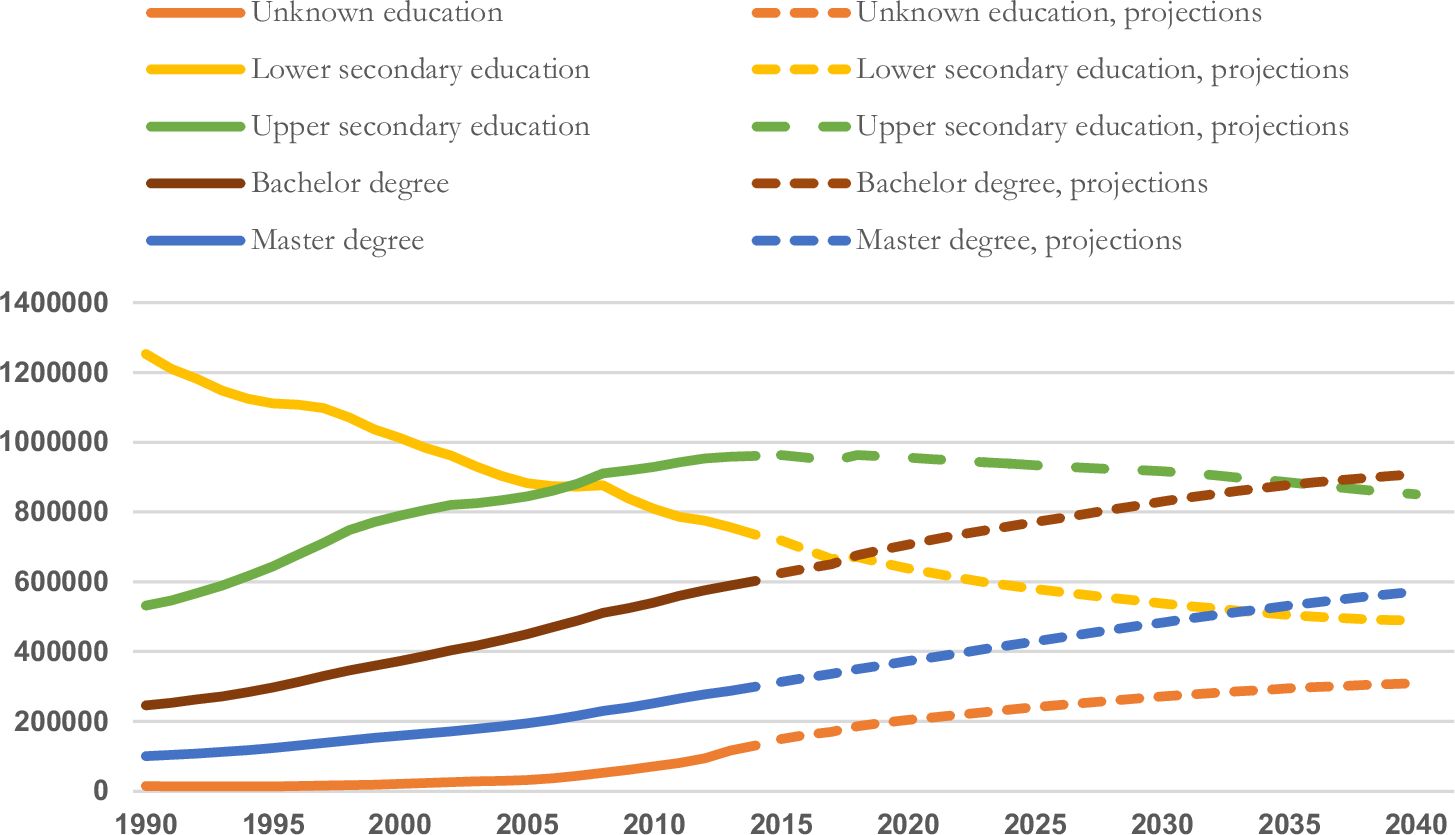
Figure 3 shows the development in education level from 1990–2040. High enrolment to tertiary education during the 1990s led to a substantial increase in the share of the population with higher education. The number of those with upper secondary education has also increased during the last 20 years, but with high propensities to study longer, the group is in fact diminishing over the next years. From around 2035, the group with education at bachelor level will become the largest group instead of upper secondary education. Persons with lower secondary education has decreased, and with constant educational propensities, they will continue to do so.

Labour force by educational level. Historic development and projections. 1990–2040. Source: Statistics Norway.
6. Labour supply and income
6.1 Retirement
In the Norwegian pension system individuals can lose pension entitlements if they stop working before they start withdrawing their pension. It is therefore important that decisions on stopping to work and the withdrawal of pensions must be linked together. In MOSART we therefore have found it convenient to model retirement before the other elements of labour supply. This also helps model the new system for old-age pensions which gives individuals great flexibility in combining withdrawal of pensions when still working. The model includes three different types of retirement; old-age retirement (including early retirement), disability and work assessment allowances (WAA). It is most convenient to model all these decisions in the same block of the model. Although the focus in MOSART is on long-term benefits, WAA is included because a period with this allowance is almost mandatory before disability pension may be granted. For those receiving a disability pension, MOSART simulates the degree of disability (between 50% and 100%).
Transitions to receiving work assessment allowance or a disability pension are simulated together based on three multinomial probabilities for transitions between three states:
not receiving work assessment allowance or disability benefits,
receiving assistance to return to work, and
receiving a disability pension.
Most transitions into disability come from individuals who have received assistance to return to work (state 2). There are few transitions out of disability, except transfers to old-age pension at the age of 67. The probability of transitioning from 1) not receiving benefits to either 2) receiving a work assessment allowance or 3) a disability pension depends on age, gender, cohabitation (marital) status, ongoing and achieved education, if one is working, if one has had a stable career path up until now, and whether one has previously been disabled.
The probability of transitioning from state 2) to either state 1) or state 3) has fewer explanatory variables, depending on age, gender, ongoing and achieved education, if one is working, and whether one has previously been disabled, while the probability of transitioning from state 3) only depends on age, gender and the degree of disability. In MOSART transitions to receiving either a work assessment allowance or a disability pension are not assumed to depend on the generosity of the different pension schemes.
Norwegians can start drawing an old-age retirement pensions from NIS from the age of 62, but in the public sector the existing early retirement scheme is most common for retirement between 62 and 67. In general the probabilities for retirement into old-age or early retirement from the age of 62 and onwards depend on age, gender, achieved education level, and which sector one works in. In the private sector the probabilities for retirement shifted because of the reform in 2011. After the reform probabilities are mainly adjusted so that the desired average age of retirement neutralizes changes in life expectancy (the desired age of retirement increases just enough so that the present value of the pension is unchanged). In the public sector probabilities for early retirement are calibrated to reflect the proportion retiring at different ages observed in the past years. With the present system persons on early-retirement in the public sector will be transferred to old-age pensions at the age of 67. Those in the public sector born in 1963 will be the first cohort embraced by the new system built on the same principles as in the private sector when they reach the age of 62 in 2025. We model changes in sector for individuals until they reach the age of 61. Persons on WAA or disability pensions are also transferred to old-age pensions at the age of 67.
6.2 Labour supply
Labour supply and yearly income are important for analysing the sustainability of the Norwegian pension system and effects from reforms. In addition, labour supply is important for projecting the availability of different types of labour in the future. The labour supply concepts used in MOSART are linked to the basic amount in the National Insurance scheme, BPU, which in 2019 was set equal to NOK 98 866 (approximately 10 100 euro). The main labour force participation measure used in the model is the probability of working in a given year; defined as earning 1 BPU or more (with BPU indexed each year by average wage growth).
Labour force participation depends on several variables simulated earlier in the model: age, gender, cohabitation (marital) status, children, ongoing and achieved education, if one is a pensioner (along with type of pension), if one has had a stable career path up until now, and length of time outside the labour force until now. A stable career path is a characteristic derived from an individual’s working history. We hope, at a later point in time, to incorporate information on immigrant background and the sector in which a person is working. A stable career path is given by a dichotomous variable which is one if a person, for every year from the age of 23, has lived in Norway and had an income of 1 BPU or more or been under education. This variable has a strong positive effect on the probability of working and a strong negative effect on becoming disabled during the following year. The probabilities are adjusted, by changing the constant term in the probability equations, so that the aggregate number of individuals working (as defined above) for historical years is consistent with observations from Statistics Norway’s Labour Force Surveys. This consistency increases the usefulness of the model, making it easier for users to combine different models in a single analysis.
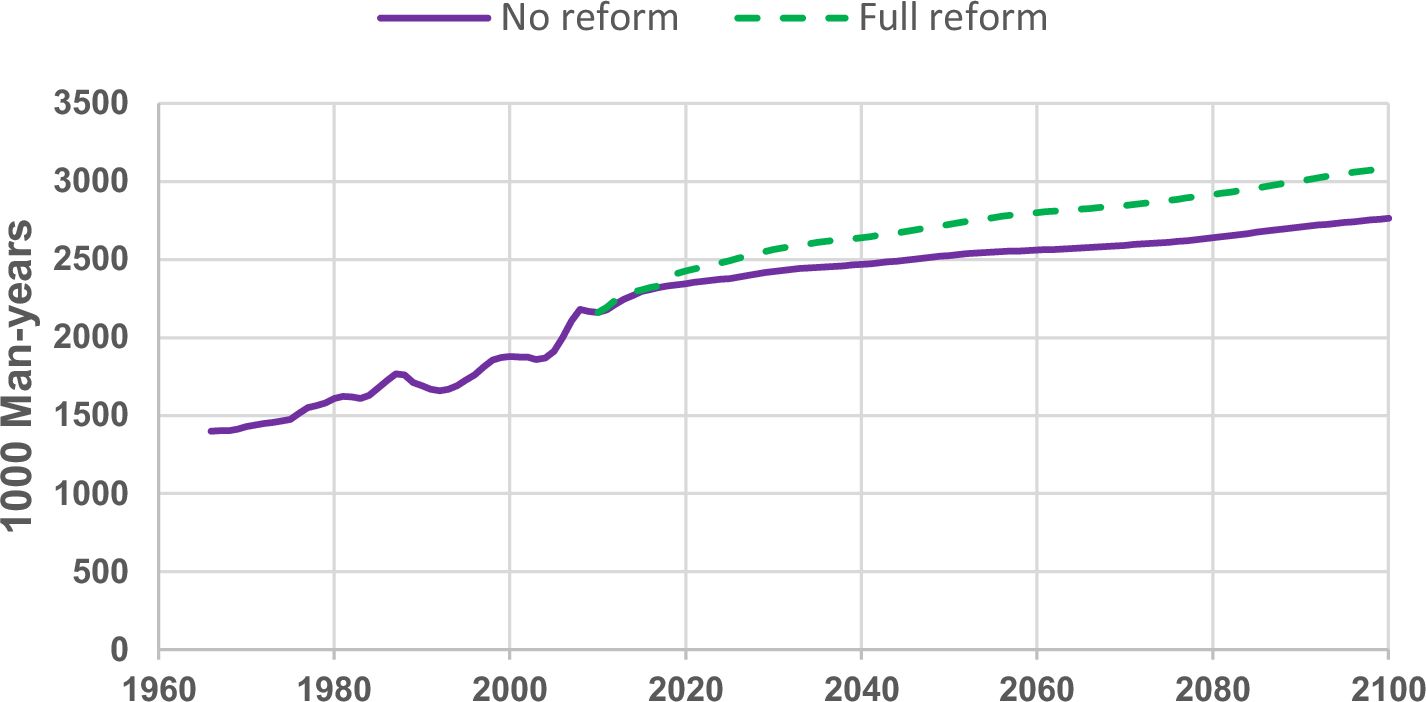
Figure 4 below shows the observed labour force from 1966–2017 and the simulated towards 2100 comparing the no reform alternative with the reform. As discussed in more detail in Fredriksen et al. (2017) the pension reform in 2011 is expected to stimulate labour supply in three ways: i) Positive effects on participation rates and working hours before retirement because of a closer connection between accumulation of pension entitlements and former earnings with the new system. ii) A rather immediate effect postponing retirement. iii) Further postponement of retirement for new cohorts if life-expectancy increases.

Actual and projected labour force. 1,000 man-years Source: Statistics Norway.
Analyses of the first effect indicate that it is of minor importance. The effect is also hard to validate. On the other hand, econometric analyses by Hernæs et al. (2016) show that the second effect is significant. The main reason is a change in the means-tested early retirement scheme for age 62–66 without any consequences for the level of old-age pensions from age 67 with the old system towards a life-long supplement incorporated in the new actuarial system.
It is still too early to validate the third effect. Because accumulation of entitlements also increases when retirement/withdrawal is postponed, it is enough to postpone retirement by 2/3 of the increase in life-expectancy to maintain the level of benefits. A postponement of 2/3 of the growth in life expectancy is therefore chosen as the main assumption in the projections. The estimated and the assumed effects implicate that supply of man-years in 2020 is close to 80 000, or 3.4 percent higher in 2020 than without the reform. In 2060 the effect on labour supply is projected to be 240,000 or 9.4 percent. With the new system labour supply is projected to increase by 30 per cent from 2018 towards 2100.
6.3 Yearly labour incomes
Simulations of yearly income are mainly used to assess the sustainability of the National Insurance System and to analyse the distributional consequences of different policy options regarding pensions, but have wider applicability. They lead to completed income histories, so that one can look, for example, at the returns to different education types for different groups. The main challenge in simulating income is to capture the great heterogeneity in earnings, both over the life cycle and between individuals. Estimated relationships will invariably smooth the income trajectories compared with the data, but the income relationships used in MOSART attempt to capture as much of the variation as possible. This can be important when analysing different pension systems, since the variation in income can influence one’s accumulated pension rights.
Income is defined to the concept that earns pension rights in NIS, consisting mainly of labour income. To control for changes in yearly income levels, we detrend everyone’s income by the nominal salary in a year relative to the nominal salary in a base year. This nominal salary is an average across all individuals for a given year. At present the model has only a very simple simulation of capital income.
The income relationship is based on log income being a linear function of a set of explanatory variables together with residuals which consider individual heterogeneity, income persistence from one period to another and changes over time in the variance of income across individuals.
The explanatory variables used in the present version of the model are age, gender, cohabitation (marital) status, children, ongoing and achieved education, seniority, if one is a pensioner (along with type of pension), if one has had a stable career path up until now, and length of time outside the labour force until now. In addition, since the income relationship is estimated on a panel data set, the year of an observation is included as an explanatory variable. In an ongoing update of the income relationship, we estimate separate income relationships for different cohorts. The explanatory variable seniority and stable career path will be replaced with an experience variable that reflects both years of work and the stability of ones work history.
There are two residuals in the present version, one is a permanent individual residual reflecting unobserved characteristics and the other a transitory residual with zero mean which is simulated for each individual each year. The permanent and transitory residuals are based on the observed residuals from the estimated income relationship. The permanent residual is calculated as the mean of the observed residuals from each individual’s earnings history (given that there are at least two observations). For individuals without an earnings history, the permanent residual is drawn from a non-parametric empirical distribution of the calculated permanent residuals. The variance of the transitory residual can vary across individuals. It is calculated in the same way as the permanent residual.
Our income simulations lead to earnings profiles that are sufficient for pension analysis. This is partly due to the quality of the simulations, but also because in most distributional analysis observed earnings play at least as large a role as simulated earnings. The model is anchored by a deep historical dataset with observed earnings going back to 1967. Fredriksen (1998) contains an analysis of how well simulated earnings fit historical data.
In the ongoing update, the effect of the permanent individual specific residual will change over time and the transitory residual will be assumed to follow an autocorrelated (AR-1) process. The new income relationships will have a clearer theoretical basis and be less ad hoc than the present relationship. They will be explicitly based on cohort histories instead of combining cohort and yearly effects, and the estimation will be closer to that found in the literature on Mincer equations and in the literature looking at the different effects of permanent and transitory income shocks. Guvenen (2009) and Heckman et al. (2006).
7. Simulation of pension expenditures
Based on former labour market participation and incomes, a set of transition rules and information about other individual characteristics MOSART uses a detailed set of pension rules for pension arrangements included to calculate pension benefits for every individual in the population. This information may thereafter be used to calculate consequences for pension expenditures and distribution of income from different designs of the system. Since the end of the 1990s the main use of the MOSART-model has been to analyse direct fiscal effects as well as distributional effects from different alternative designs of main components in the Norwegian pension system.
Projections with the model are naturally dependent on the assumptions used, and sensitivity for some of the most important ones is briefly discussed by Fredriksen et al. (2017). Under the old pension system both expenditures and the distribution of benefits were highly affected by assumptions regarding mortality. Under the new system effects on expenditures from different assumptions regarding mortality and withdrawal behaviour are highly neutralized. For special groups like the disabled, those receiving widow/widower benefits and migrants, relatively large uncertainty regarding labour market participation and incomes causes a large uncertainty in projections of their pension benefits.
Figure 5 compares two simulations of pension benefits, ‘Mosart’ and ‘Sim1980’, with the observed benefits reported by the Tax Authorities, labelled as ‘Reported’. The figure shows the level of pension benefits sorted by increasing values. The simulation ‘Mosart’ simulates benefits keeping other variables equal to their observed values. It shows how well the pension module works in isolation. As can be seen from the figure it tracks very well the observed data. The simulation ‘Sim1980’ shows the simulated benefit in 2017 resulting from an historical simulation starting with the observed population in 1980. For each year the model is calibrated against observed aggregate statistics. We thereby focus on the quality of modelling the distribution of labour incomes and pension benefits. This simulation also tracks fairly well, even though, as the figure shows, too many men receive low benefits (and thereby too few receive high benefits). This may be caused by problems simulating the benefits of immigrants with a short period in Norway, because their labour incomes (which determine pension benefits) are simulated at too low a level.

NIS old-age pension benefits in 2017 sorted by percentile. NOK Source: Statistics Norway.
The main emphasis in the analysis of the Norwegian pension reform has been on the old-age part of the National Insurance System (NIS) that was established in 1967. NIS constitutes the first pillar of the Norwegian pension system and is by far the most important component for old-age pensions in Norway. As discussed by Christensen et al. (2012), and not influenced by the reform of the system in 2011, NIS is an integrated part of the Central Government budget and financed PAYG. Yearly expenditures do not have to be balanced by specific contributions, and pension expenditures are financed by general tax revenues. From 1973 until the reform in 2011, old-age pensions in NIS could be claimed with defined benefits (DB) from age 67 and were earnings-tested until age 70, until a stepwise repeal of this test was imposed between 2008 and 2010. Because of the early retirement schemes introduced in 1989 covering about 60 per cent of the employees in the private sector and all employees in the public sector, it was possible for employees belonging to these schemes to retire from the age of 62 without any consequences for benefits from NIS after the age of 67. Towards the end of the 1990s it was evident that growing longevity and large cohorts born after World War II would cause expenditures in this DB-system to increase substantially in the coming decades.
The work on reforming the system started by appointing a Pension Commission in 2001. In its report from 2004 (NOU, 2004/1) the Commission’s main suggestion was to reform the Norwegian old-age pension system including the early retirement schemes toward a nonfinancial defined contribution (NDC) scheme like the one already implemented in Sweden. Two agreements in the Norwegian Parliament in 2005 and 2007 indicated that a broad political majority supported a reform along the suggested lines, with some adjustments. Based on a tripartite agreement between the Government, the trade unions and the Employers’ Confederation the early retirement scheme in the private sector was incorporated in the new system from 2011. No corresponding agreement was reached between the Government and the trade unions in the public sector. The early retirement scheme and occupational old-age pensions in the Government sector were therefore only partly adapted to the new system leaving the early retirement scheme unaffected. However, by new negotiations an agreement to change these schemes corresponding to the system in the private sector was reached in 2018 with major effect from 2025 when those born in 1963 reach the age of 62.
Under the new system, old-age pensions may be drawn partly or completely between the age of 62 and 75, with actuarial adjustment and without any earnings test. From accumulated entitlements at retirement age, annual pension benefits for a cohort retiring are calculated by divisors reflecting remaining life expectancy at that age. Early retirement leads to lower annual benefits because accumulated entitlements must be divided by more years. This is also the case when life expectancy increases for a given retirement age. Lower benefits when life expectancy increases may be counteracted by postponing retirement. The connection between pension entitlements and lifetime labour incomes is also closer in the new system than in the old.
The MOSART model has been used to analyse effects on labour supply and old-age pension expenditures from the pension reform during the whole reform process as well as in post reform evaluations. Given the pre-reform uncertainty regarding labour-supply effects, assumptions were made based on the incentive structure in combination with possible effects from these changes discussed in the economic literature. In the post reform evaluation direct effects on participation rates for different groups according to analyses by Hernæs et al. (2016) are considered.
The full effect measured in bill. NOK in fixed 2017 wage amounts from the reform of the system for old-age expenditures in NIS compared to continuing the old system is shown in Figure 6. Counteracting further growth in life-expectancy through life-expectancy adjustment is the main tightening component in the new system. In 2050 old-age pension expenditures in NIS are simulated to be reduced by almost 20 per cent because of the reform while the expenditures in 2100 is estimated to have declined by more than 30 per cent. However, the reform does not counteract the effect from relatively large cohorts born after World War II replacing small cohort born in the former decades. Even with the pension reform old-age pension expenditures are estimated to more than double from 2010–2050. The increase beyond 2050 is weaker because of more stable sized cohorts of pensioners.
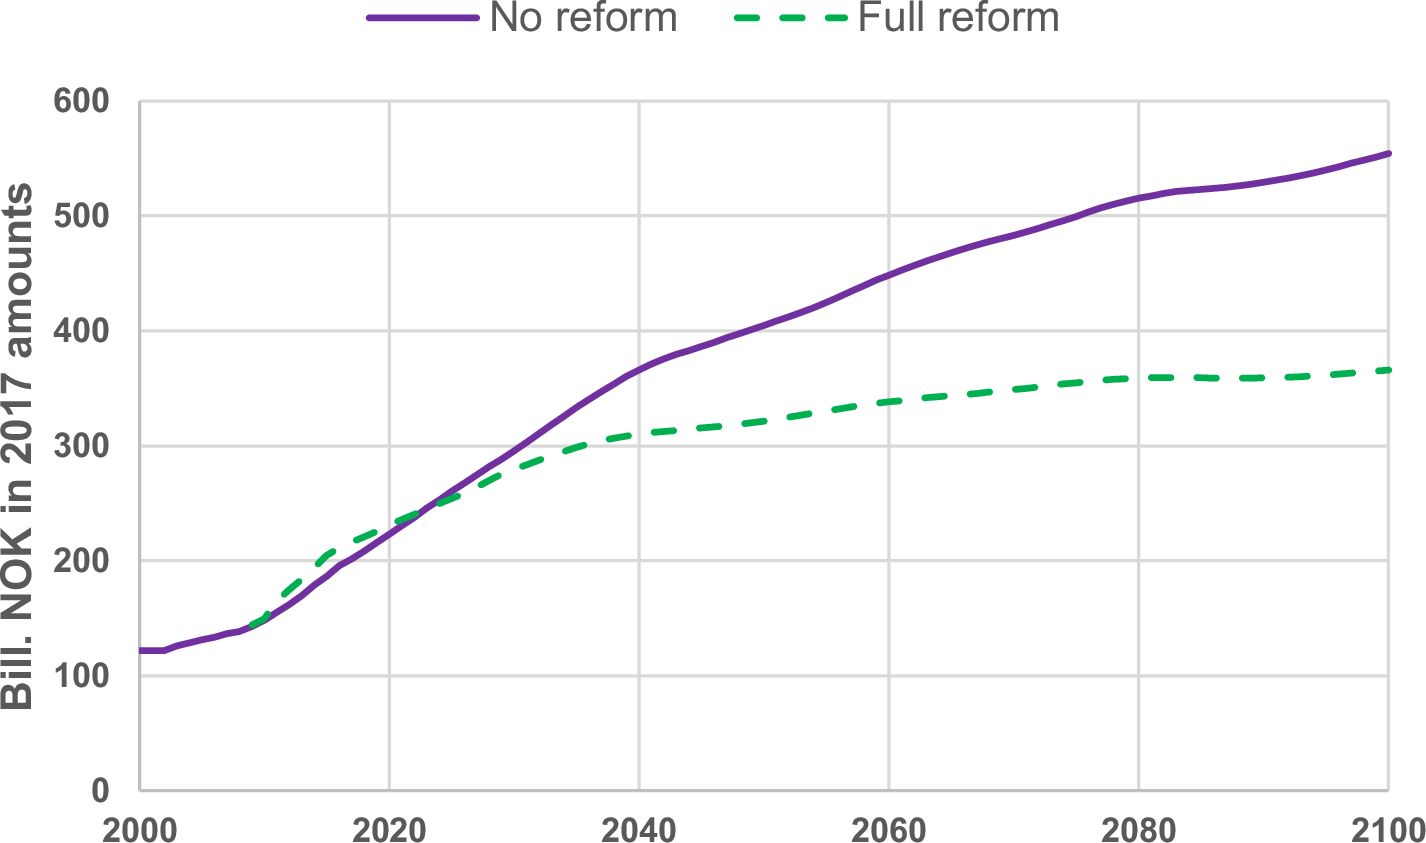
Projected old-age pension expenditures in the National Insurance Scheme. Bill. NOK measured in fixed 2017 wage amounts. Source: Statistics Norway.
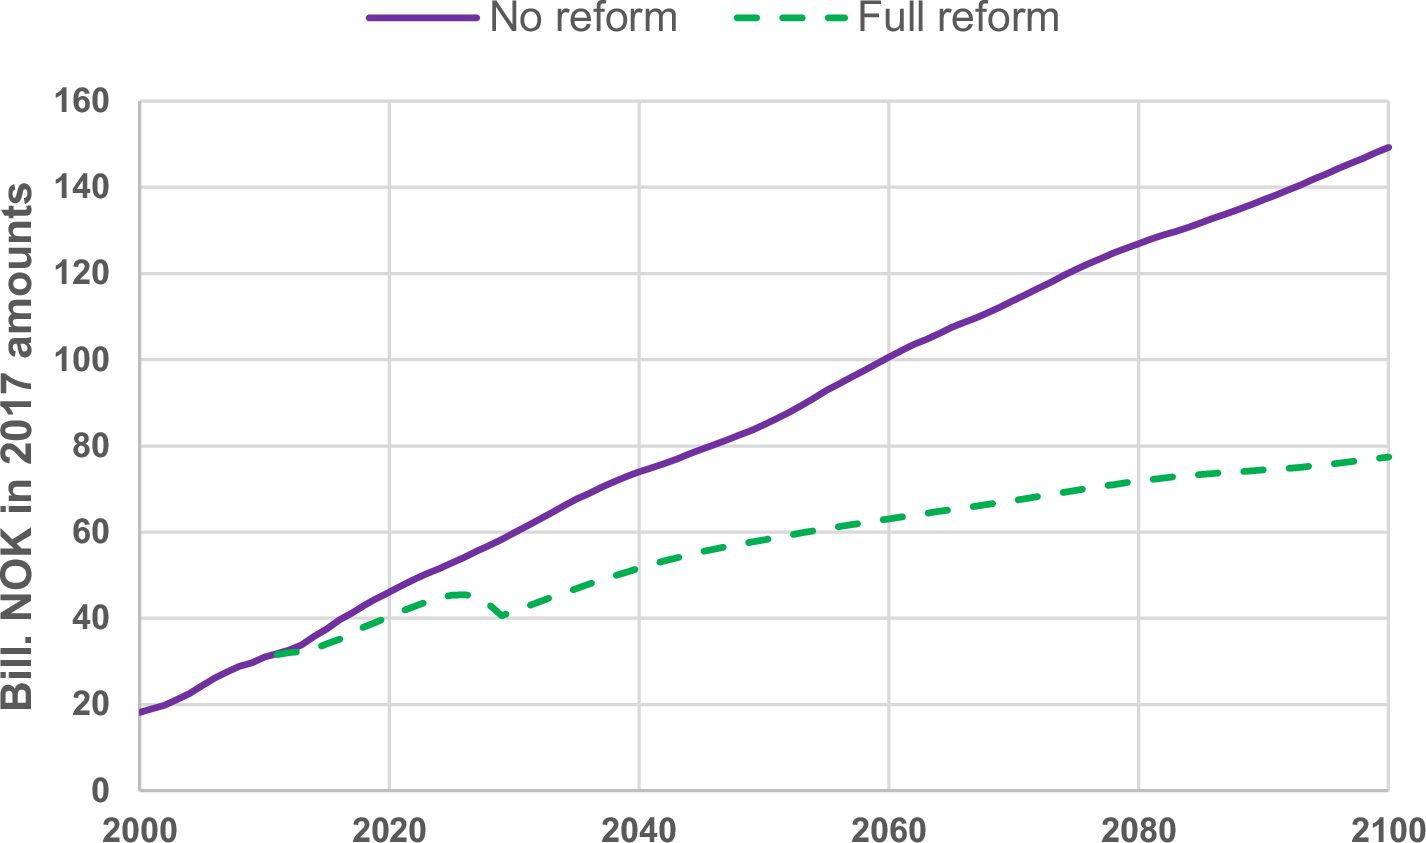
Figure 7 shows the effects on pension expenditures from alternative designs of the old-age occupational pension system in the public sector. The full reform effect based on the agreement from 2018 is compared with a prolonging of the old system existing before 2011. The main tightening of occupational old-age pension expenditures in the public sector compared to the no-reform scenario took place by the general pension reform in 2011. The tightening was caused by lower indexing of pensions in payments than general wage growth as well as life-expectancy adjustments. The first effect from the 2018-agreement starting to work in 2025 will be a postponement of expenditures for early retirement benefits as this component is converted into a life-long supplement.

Projected old-age pension expenditures for occupational pensions in the public sector. Bill. NOK measured in fixed 2017 wage amounts. Source: Statistics Norway.
The tightening of the old-age occupational pension system in the public sector will be relatively stronger than the tightening of NIS. In NIS some of the tightening caused by life-expectancy adjustment is somewhat compensated by more generous rules for accumulation of entitlements. In 2050 expenditures for old-age occupational pensions in the public sector are projected to be reduced by 31 per cent compared to a 21 per cent tightening of the expenditures from NIS. A significant increase in the number of employees in the public sector during the past decades will even with the full-reform system cause expenditures for old-age occupational pensions in the public sector to almost double from 2010–2050.
8. Distributional effects in the pension system
Adequacy and distributional effects played a prominent role in discussions prior to the Norwegian pension reform in 2011. As pointed out by Dekkers and Van den Bosch (2016), a model like MOSART, belonging to dynamic-ageing microsimulation models of the cross-sectional type, is well suited for these kinds of analyses. By using MOSART it is possible with a far more accurate description of distributional consequences of the 2011 reform than a traditional simplified approach restricted to the calculation of replacement rates given assumptions such as fixed level of income for 40 years. Simplified calculations of replacement rates presented in Christensen et al. (2012), show that persons with somewhat above-average income will gain from the change in accumulation of entitlements because of the Norwegian pension reform before taking life expectancy adjustment and lower indexation of benefits in payments into account.
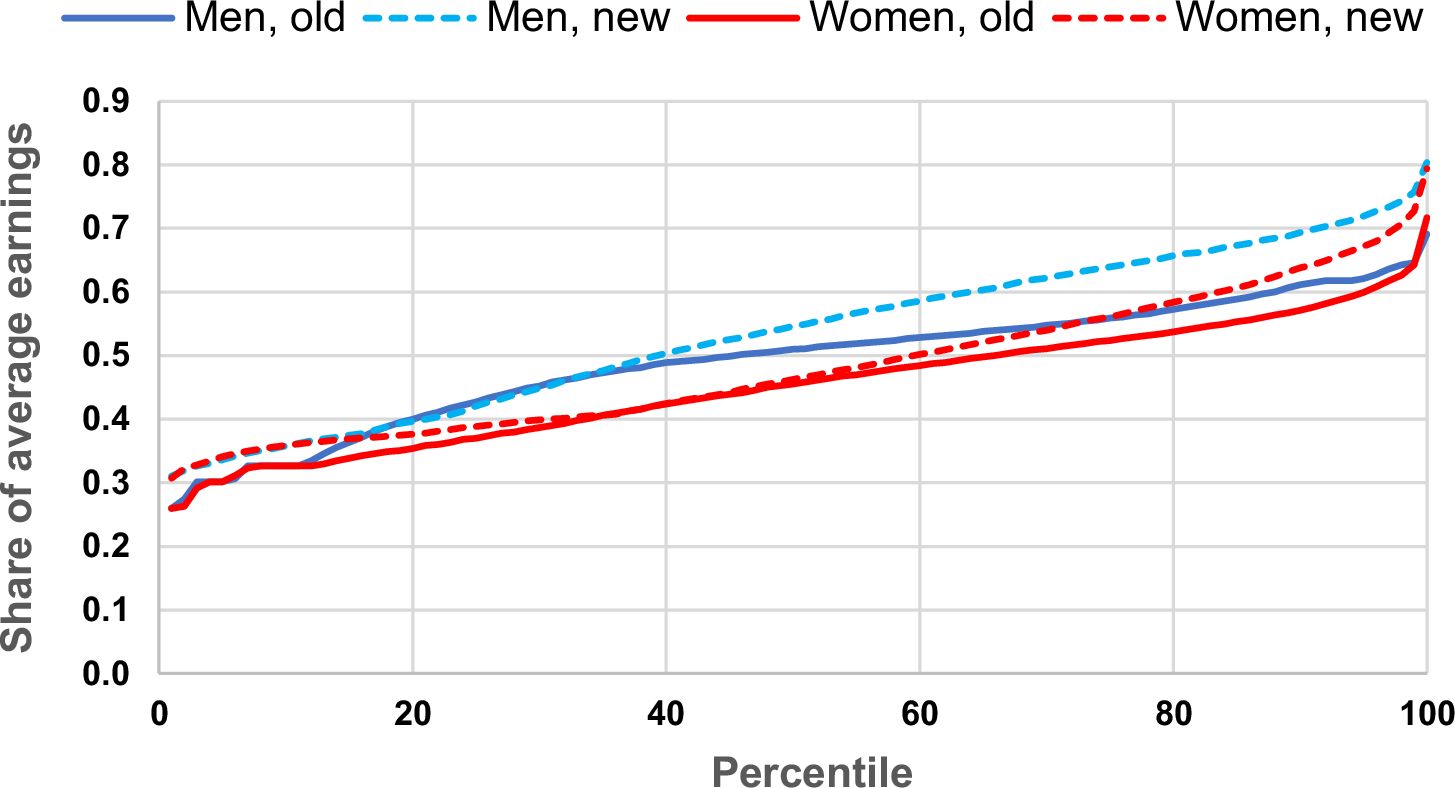
In a first round of analyses of distributional effects from the Norwegian pension reform using the MOSART model also presented in Christensen et al. (2012) and Fredriksen and Stølen (2014), the calculations were restricted to horizontal distribution of old-age benefits from the new model for accrual of entitlements in 2050. By this simplification one can conveniently ignore indexation and actuarial adjustment through the flexible pension scheme. These elements of the reform have only small effects on the horizontal distribution of pension benefits. If distributional analyses are made after behavioural effects are included, these analyses will be a poor approximation for changes in welfare because they also reflect a voluntary shift in retirement ages Figure 8.

Estimated distribution of pension benefits in 2050 by income percentile and gender (share of average earnings). Source: Fredriksen and Stølen (2014). Note: Benefits are shown before indexation and exposure to the life expectancy adjustment divisor.
A more favourable model for accrual of entitlements, before considering lower indexing of benefits than wage growth and adjustments for increasing life expectancy, means that no one seems to be worse off. While the figure gives a good indication of horizontal distributional consequences, it is misleading regarding the level of entitlements. Limited by the simplifications in these horizontal analyses the lower deciles will gain from the reform while accrual of benefits for old-age pensioners between the second and the fifth deciles is almost unaffected. The top five pension income deciles will experience an increase in entitlements, reflecting a somewhat increased accrual coefficient, and full accumulation of entitlements between 6 and 7.1 BPU with the new system, against only one-third with the old. The improvement for these deciles is larger for men than for women.
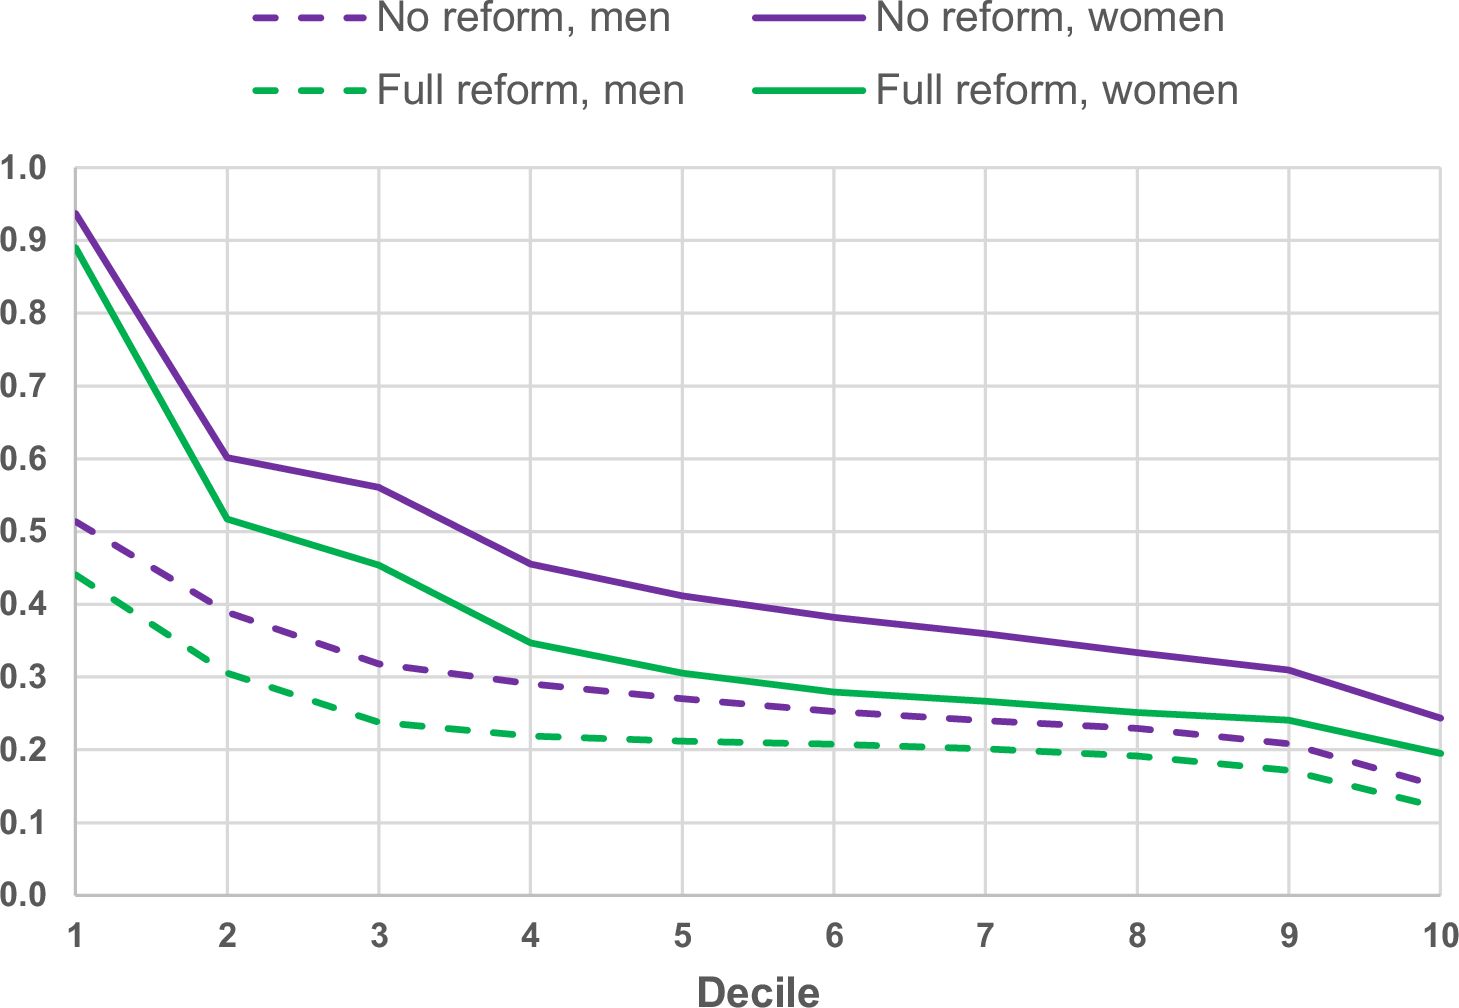
Christensen et al. (2012) also present overall distributional effects including tightening elements for the reform of old-age pensions in NIS by calculating total old-age pension benefits over the period as pensioner relative to total lifetime earnings, by income group and gender. An updated version for the 1963-cohort, which is the first cohort entirely encompassed by the new system, is presented in Figure 9. When the components for life expectancy adjustment and lower indexation of benefits in payment are included, everyone receives lower total benefits relative to total lifetime earnings. But because life-expectancy adjustments are more lenient for minimum pensions, persons in the first decile are less hurt by the reform than others. Although persons with high labour market incomes also seem to lose less from the reform than persons with medium incomes, NIS for old-age pensions is still highly redistributive over the lifecycle. Because of longer life expectancy for women and elements in the system for accumulation of entitlements favouring women, NIS also redistributes incomes from men to women. After the reform total lifetime pensions are only around 20 percent of total lifetime earnings for men from the third decile and above.

Total life-time benefits from old-age pensions in NIS relative to total life-time earnings for persons in the 1963-cohort by income decile and gender. Source: Statistics Norway.
Gender issues were a key feature in the debate to reform the Norwegian pension system prior to 2011. As a result, the reformed National Insurance System has several redistributive mechanisms that aim to compensate women directly for caring obligations or indirectly though redistribution from high to low lifetime earners: a gender neutral annuity divisor, a ceiling on annual earnings, generous child credits, a possibility for widows/widowers to inherit pension rights from a deceased spouse, a targeted guarantee pensions with higher benefit rates to single pensioners compared to married/cohabitating pensioners, and finally the tax system that is particularly progressive in its treatment of pensioners and pension income.
Halvorsen and Pedersen (2019) study in more detail the distributional components built into the reformed system aimed at achieving greater gender equality. The analysis deviates from previous studies using MOSART by analyzing the outcomes of a stepwise introduction of redistributive elements under stylized assumptions for a given cohort. Table 2 shows each of the redistributive elements’ quantitative effect on (individual) average pension income over retirement for men and women respectively.
Individual pension benefits. Average over the retirement phase
| Average amount at each step in NOK | Gender gap | Change compared to previous step in NOK | Change in gender gap | |||
|---|---|---|---|---|---|---|
| Men | Women | Men | Women | |||
| 0. Baseline | 268 164 | 154 176 | 43 % | – | – | – |
| 1. Gender neutral annuity divisor | 242 600 | 168 341 | 31 % | −25 564 | 14 166 | −12 % |
| 2. Social security ceiling | 206 926 | 158 741 | 23 % | −35 674 | −9 600 | −7 % |
| 3. Child credits | 209 087 | 174 748 | 16 % | 2 161 | 16 007 | −7 % |
| 4. Inherited benefits | 209 726 | 181 298 | 14 % | 639 | 6 549 | −3 % |
| 5. Guarantee pension undifferentiated | 214 718 | 191 563 | 11 % | 4 992 | 10 265 | −3 % |
| 6. Guarantee pension with higher benefits for singles | 215 891 | 193 815 | 10 % | 1 173 | 2 252 | −1 % |
| 7. Income taxes | 189 320 | 175 459 | 7 % | −26 571 | −18 356 | −3 % |
-
Source, Halvorsen and Pedersen (2019).
As shown by Table 2, a hypothetical actuarially fair pension system would produce a gender gap of 43%, while the actual reformed system produces a gender gap of only 7% after taking account of income taxation. The gender-neutral annuity divisor gives the single most important contribution to close the gender gap, and the effect would have been even larger if benefits had been fully indexed with wages over the retirement phase. Among those components that are classified as generally redistributive (from rich to poor) the income ceiling appears to be the most important for closing the gender gap followed by the guarantee pension and the tax system. An important caveat here is that the two latter components would have had a stronger impact without the other redistributive components in place.
9. Accrued-to-date pension wealth
The concept of pension wealth has been extensively used by economists in theoretical and applied research since Feldstein (1974), but in recent decades, due to population ageing, it has attracted the attention from a wider scientific community and from policy makers. Pension wealth constitutes a significant proportion of total household wealth, but few countries have a comprehensive measure of pension wealth at the individual level.
However, National Accounts practices are evolving, and statistical offices are now required to report on the value of all pension entitlements in a supplementary table. The collected information must be comparable between countries whether pension schemes are funded or not. While pension obligations for entitlements under the third pillar and for funded schemes earlier had been included in standard National Accounts, the new system especially introduces compiling statistics on accrued-to-date liabilities in unfunded schemes. The production of statistics on accrued pension wealth in schemes for which no actuarial estimations have previously been estimated has spurred new use of microsimulation models.
Accrued-to-date liabilities are currently being calculated by using microsimulation models in France, Estonia and Belgium. However, none of these countries use the microsimulation model to make individual estimates of pension wealth. In a new project we use MOSART to calculate accrued to date liabilities -- or accrued pension wealth -- at the individual level. The goal is to use the data for household pension wealth statistics, and to analyze the distribution of individual pension wealth data and how it relates to the distribution of other personal wealth (both financial and real wealth).
Wealth data has been collected that covers all three pillars; National insurance, occupational pensions (both public and private) and personal pension saving. The actual value is used for members of defined contribution (DC) plans, but MOSART is used for calculating the discounted sum of benefits from defined benefit (DB) plans. Using a microsimulation model, pension wealth may be calculated under realistic and detailed assumptions about job market behavior, choices of retirement age and individual expected longevity (based on socio-demographic characteristics). As pointed out by Blanchet et al. (2017) the complexity of the pension system implies that an approach using dynamic micro-simulation seems to be far more efficient in projecting pension entitlements than an aggregate approximation. Micro-simulation allows a detailed account of the pension legislation at the individual level, applied to a heterogeneous population. An additional strength of the MOSART model is that the individual work histories are quite accurately embedded in the model due to long panels of register data. Furthermore, due to the Norwegian pension reform introduced from 2011, accumulation of entitlements from both the old and the new system can be considered.
Since pension wealth in defined benefit and non-funded defined contribution plans is the present value of expected pension streams, this involves making assumptions about discount rates and survival probabilities. To compute individual survival probabilities, most previous studies are generally based on official life tables. As described before, MOSART has a more sophisticated modelling of survival probabilities that also account for socioeconomic differences. Furthermore, the project involves using the model in a slightly different way. To get an unbiased estimator of longevity (and subsequently pension wealth) at the individual level we need to simulate many lifetimes for each individual.3 Given a full population this is computationally demanding. Therefore, we simulate the model 100 times using stratified, conditional and proportional sampling to increase efficiency. The result is as if we ran 2,000–10,000 ordinary simulations per person. Results from the project are reported in Smogeli and Halvorsen (2019) and Fredriksen and Halvorsen (2019).
10. Summary
MOSART is one of the longest running and actively used models in the family of dynamic microsimulation models. Its main use has been projections and policy analyses regarding the design and evaluation of the Norwegian pension system, but the model is also used for projecting labour force by educational level and for construction of pension wealth statistics. MOSART was important towards the end of the 1990s in illuminating the need for a reform and is still important in the evaluation and further adjustments of the pension system.
While similar models are used for analysing effects on pension expenditures from reforms of the system, a heavy weight in the Norwegian debate has been put on adequacy and distributional effects. This is also reflected in the design and the analyses made. By including relevant labour supply effects and incorporating these effects in a general equilibrium model it has been possible to show that positive effects on labour supply from the reform may be even more important for improving future fiscal sustainability than the tightening effects on pension expenditures.
Econometric analyses of labour supply show that there is a strong positive correlation between the level of education and performance in the labour market as well as the age of retirement. Modelling of educational behaviour is thus a main strength of MOSART compared with corresponding models in many other countries. Being situated in a statistical office with easy access to relevant micro data is also a great advantage, and simulations with the model are based on information from the entire Norwegian population. In addition, being situated in a Research Department with close connection to other research institutes as well as use of the results in important Ministries is of great value for securing quality and relevance.
Because of heavy use of the model in analysing the reform in combination with a limited staff, too few resources have been used in technical maintenance and updating of the transition probabilities. If re-estimation of the transition probabilities had been integrated into the running of the model, this would have made maintenance more efficient and significantly improved the quality of the parameters. If we have had the possibility to start over with today’s access to data and computer capacity, we would probably have chosen month as time-unit instead of year. With this choice, several of the existing weakness in aggregating over the year would have been eliminated
Footnotes
1.
The three institutions The Ministry of Finance, Statistics Norway and the University were for a long time colloquially known as the Iron Triangle.
2.
The model replicates differences in life expectancy over the period 2001–2010, and therefore does not include any increases in social difference in mortality that might have occurred since then, or that may become more important in the future.
3.
In other words, when MOSART is used for analyses of the whole population (or large fractions of the population) the population mean is sufficient to ensure unbiased estimators, but in order to obtain the individual mean expected longevity the lifetimes need to be simulated many times for each individual.
Appendix
A.1 Operative use
The user interface in MOSART consists of a handful text files, making it easy to maintain and extend, and is easy to use with a little training. A simulation is a directory with its copy of the text files, and the directory is established with a separate script. Each line in these text files will consist of an intuitive name. The simulation is executed by another accompanying script. Running the model requires no experience with C# if the content of the simulations is restricted to changing predefined parameters. The result of the simulation is stored in its directory, and comprises by request self-documentation, aggregated tables and a file with the model population.
MOSART is an extensive model, both regarding content and computer resources. Automatic self-documentation is necessary, and this includes preservation of error messages, and a stepwise report on consumption of computer resources related to runtime, cpu-time, internal memory and activity in garbage-collector.
All aggregated tables are text files which can easily be imported into e.g. Excel, and will typically have either year, birth year or age in its front row, and thus be a time series. Production of aggregated tables are managed through a separate set of text files and have a high degree of flexibility. The downside is that creation of entirely new tables requires substantial training, and we have prioritized flexibility at the user interface over runtimes.
Writing the model population to file is managed through its own (similar) text file and will by specification be one record per person per year, with selected variables, comprising selected persons and/or years. We have also prioritized flexibility over runtimes for this aspect.
Further adaptations in a simulation require programming in C# and extensive knowledge of MOSART. The intention is still that such changes should be easy to accomplish, by splitting the model into many separate files with an intuitive architecture, small modules, and intuitive names in full text for all variables and methods.
References
-
1
Building and interpreting Macro/Micro estimates of Accrued-to-Date pension liabilities: French reforms as a case studyReview of Income and Wealth 63:70–94.https://doi.org/10.1111/roiw.12207
-
2
Life expectancy and claiming behavior in a flexible pension systemThe Scandinavian Journal of Economics 120:979–1010.https://doi.org/10.1111/sjoe.12271
- 3
-
4
Forecasting immigration in official population projections using an econometric modelThe International migration review 49:945–980.
-
5
The association between income and life expectancy in the United States, 2001-2014JAMA 315:1750–1766.https://doi.org/10.1001/jama.2016.4226
-
6
Pension Reform in Norway: Combining NDC and Distributional GoalsIn: R Holzmann, E Palmer, D Robalino, editors. Nonfinancial Defined Contribution Pension Schemes in a Changing Pension World: Progress, Lessons, and Implementation. © Washington, DC: World Bank. pp. 129–154.
-
7
What are the consequences of the AWG projections and hypotheses on pension adequacy?Brussels: Federal Planning Bureau.
-
8
Applications of microsimulation modelling, Budapest, Társadalombiztositási Könyvtár13–33, Prospective microsimulation of pensions in European Member States, Applications of microsimulation modelling, Budapest, Társadalombiztositási Könyvtár.
-
9
Social security, induced retirement, and aggregate capital accumulationJournal of Political Economy 82:905–926.https://doi.org/10.1086/260246
-
10
Projections of Population, Education, Labour Supply and Public Pension Benefits. Analyses with the Dynamic Microsimulation Model MOSART. Social and Economic Studies 101Statistics Norway.
-
11
The distribution of pension wealth in NorwayThe distribution of pension wealth in Norway, Working paper.
-
12
Fiscal effects of the Norwegian pension reform – a micro-macro assessmentJournal of Pension Economics and Finance pp. 1–36.
-
13
93–108, Gender Aspects of the Norwegian Pension System, Ashgate, New Pathways in Microsimulation93–108, Gender Aspects of the Norwegian Pension System, Ashgate, New Pathways in Microsimulation.
-
14
An empirical investigation of labor income processesReview of Economic Dynamics 12:58–79.https://doi.org/10.1016/j.red.2008.06.004
-
15
Closing the gender gap in pensions: a microsimulation analysis of the Norwegian NDC pension systemJournal of European Social Policy 29:130–143.https://doi.org/10.1177/0958928717754296
-
16
Chapter 7: Earnings equations and rates of return: The Mincer equation and beyondIn: EA Hanushek, F Welch, editors. Handbook of the Economics of Education. Amsterdam: Elsevir. pp. 307–458.
-
17
Pension reform and labor supplyJournal of Public Economics 142:39–55.https://doi.org/10.1016/j.jpubeco.2016.08.009
-
18
Socioeconomic inequalities in mortality among elderly people in 11 European populationsJournal of Epidemiology & Community Health 58:468–475.https://doi.org/10.1136/jech.2003.010496
-
19
Household Projections for Norway 1990-2020, Part 1: Macrosimulations. Reports 1995/21Statistics Norway.
-
20
Association of household income with life expectancy and cause-specific mortality in Norway, 2005-2015JAMA 321:1916–1925.https://doi.org/10.1001/jama.2019.4329
-
21
Simulating an Ageing Population: A Microsimulation Approach Applied to Sweden31–54, Dynamic Microsimulation for Policy Analysis: Problems and Solutions, Simulating an Ageing Population: A Microsimulation Approach Applied to Sweden, Emerald: Series Contributions to Economic Analysis, Bingley.
-
22
Befolkningsframskrivingene 2018. Modeller, forutsetninger OG resultaterReports 2018/21, Statistics Norway.
-
23
A survey of dynamic microsimulation models: uses, model structure and methodologyInternational Journal of Microsimulation 6:3–55.https://doi.org/10.34196/ijm.00082
-
24
Handbook of Microsimulation Modelling305–343, Dynamic Microsimulation, Handbook of Microsimulation Modelling, 293 edn.
-
25
A Microsimulation Approach for Modelling the Future Human Capital of EU28 Member Countries. WP-17-017, IIASAA Microsimulation Approach for Modelling the Future Human Capital of EU28 Member Countries. WP-17-017, IIASA.
-
26
Modernisert folketrygdBærekraftig pensjon for framtida. The Ministry of finance and Ministry of social Affairs, Oslo (in Norwegian).
-
27
A new type of socio-economic systemThe Review of Economics and Statistics 39:116–123.https://doi.org/10.2307/1928528
-
28
Microanalytic Simulation Models to Support Social and Financial PolicyNew York: North Holland.
-
29
Dynamic Microsimulation: a methodological surveyBrazilian Electronic Journal of Economics 4:77.
- 30
-
31
Increasing the impact of dynamic Microsimulation modellingInternational Journal of Microsimulation 11:61–96.https://doi.org/10.34196/ijm.00174
-
32
A Microsimulation Model for Educational ForecastingA Microsimulation Model for Educational Forecasting, DREAM Working Paper Series 201402.
- 33
-
34
Befolkningens utdanningsnivå, etter spørreundersøkelsen om utdanning fullført i utlandet. Reports 2013/24Statistics Norway.
-
35
International Standard Classification of Education ISCED 2011Montreal: Unesco Institute for Statistics.
-
36
Preface – Orcutt’s vision 50 years onIn: A Zaidi, A Harding, P Williamson, editors. New Frontiers in Microsimulation Modelling. Farnham: Ashgate. pp. 21–30.
Article and author information
Author details
Funding
No specific funding for this article is reported.
Acknowledgements
Not applicable.
Publication history
- Version of Record published: April 30, 2020 (version 1)
Copyright
© 2020, Andreassen et al.
This article is distributed under the terms of the Creative Commons Attribution License, which permits unrestricted use and redistribution provided that the original author and source are credited.