The dynamic cross-sectional microsimulation model MOSART
- Statistics Norway, Norway
Cite this article
as: L. Andreassen, D. Fredriksen, H. M Gjefsen, E. Halvorsen, N. M Stølen; 2020; The dynamic cross-sectional microsimulation model MOSART; International Journal of Microsimulation; 13(1); 92-113.
doi: 10.34196/ijm.00214
Figures
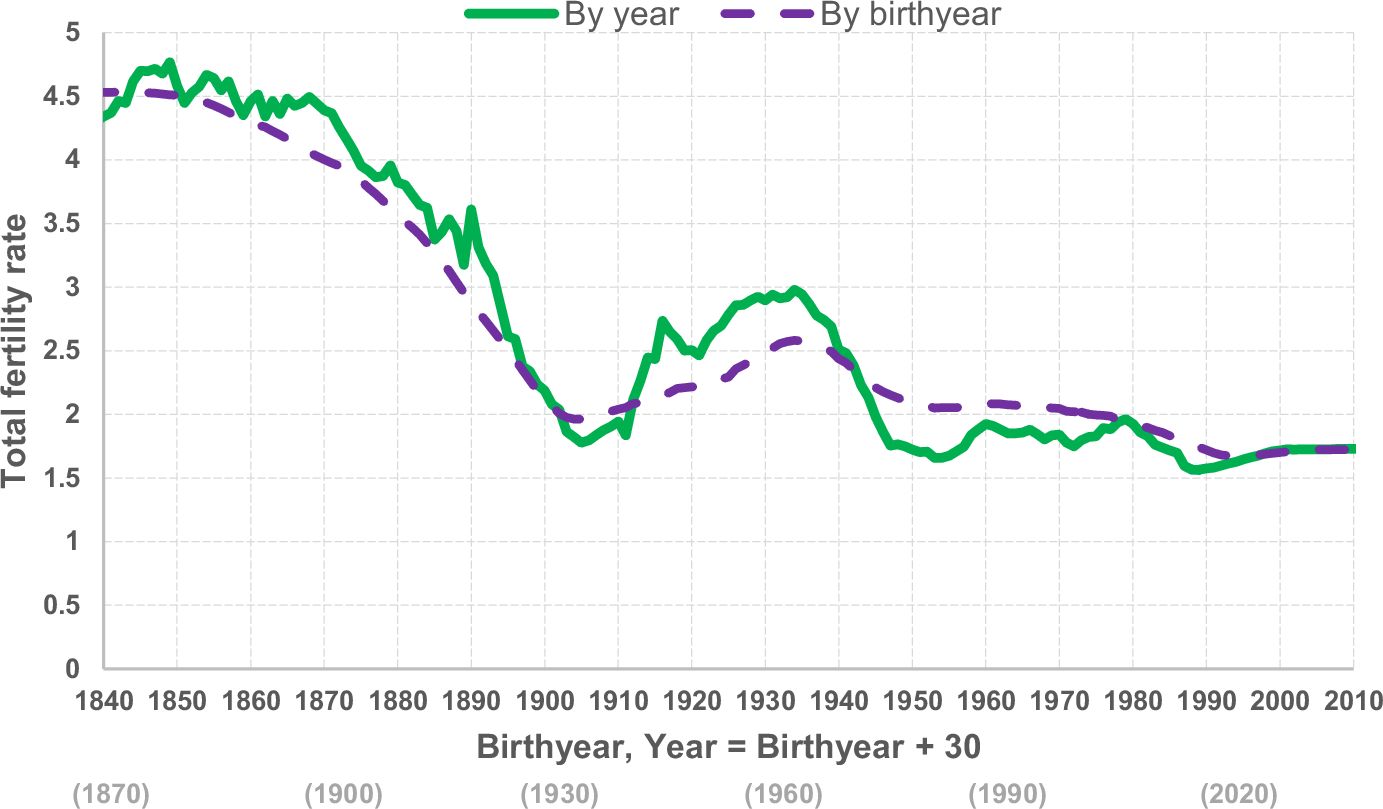
Figure 1

Total fertility rate by birthyear and year. Source: Statistics Norway.
Figure 2
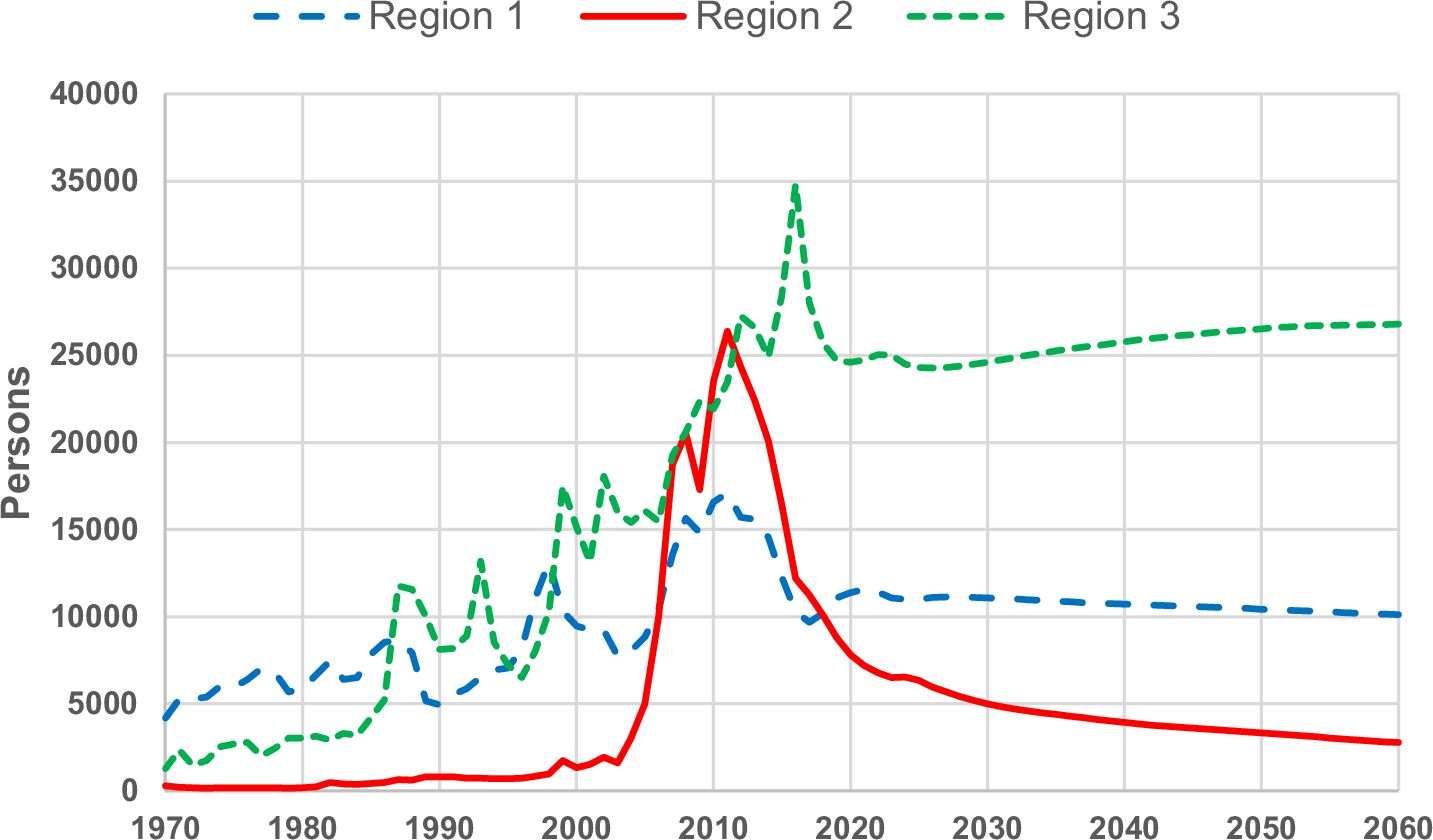
Observed and projected annual immigration by region of origin 1970–2060. Source: Statistics Norway.
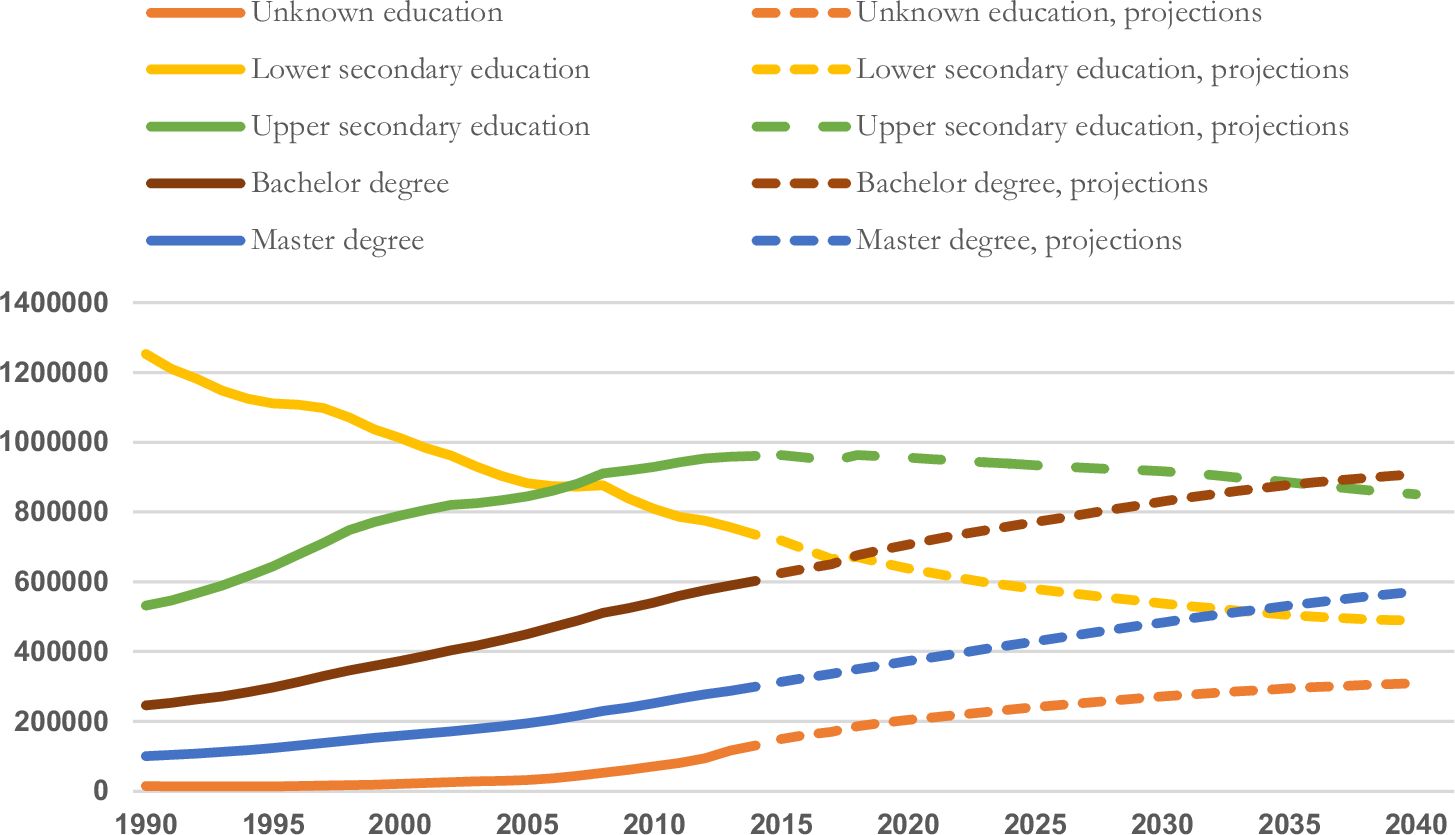
Figure 3

Labour force by educational level. Historic development and projections. 1990–2040. Source: Statistics Norway.
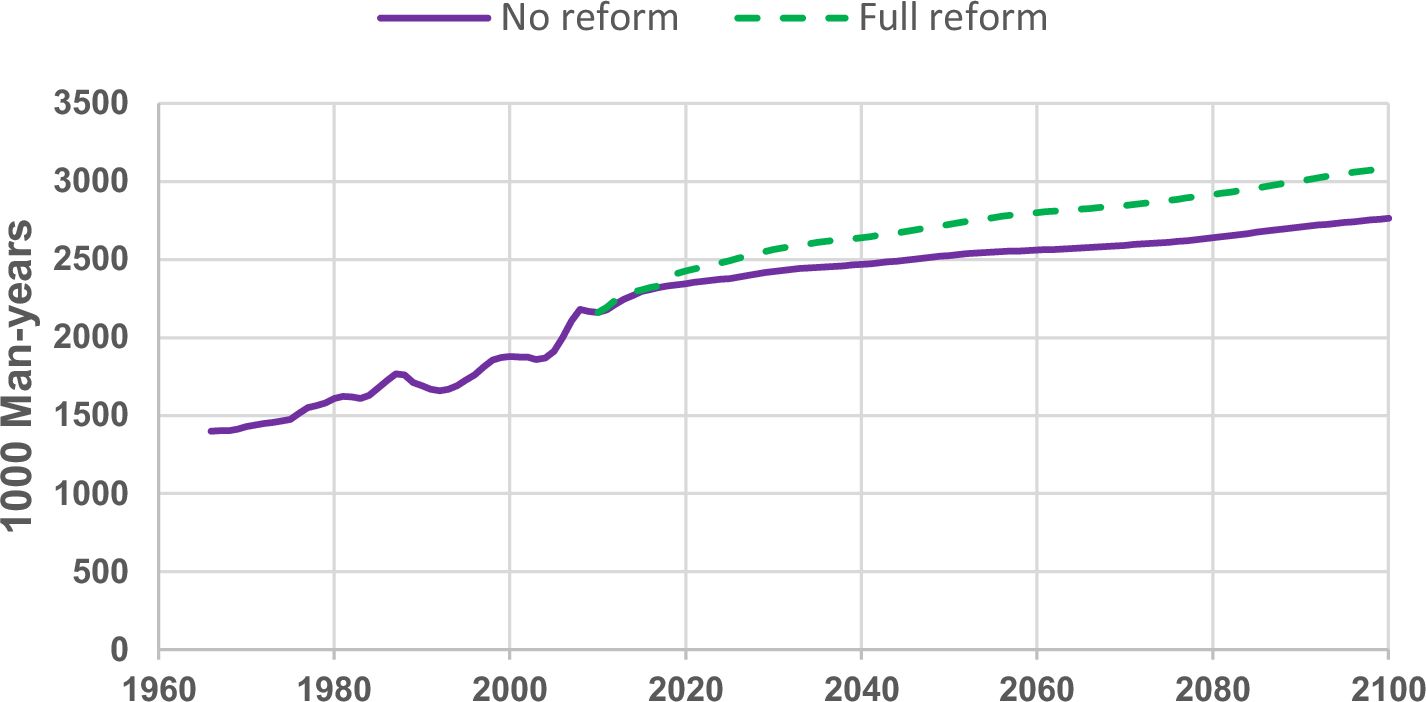
Figure 4

Actual and projected labour force. 1,000 man-years Source: Statistics Norway.
Figure 5

NIS old-age pension benefits in 2017 sorted by percentile. NOK Source: Statistics Norway.
Figure 6
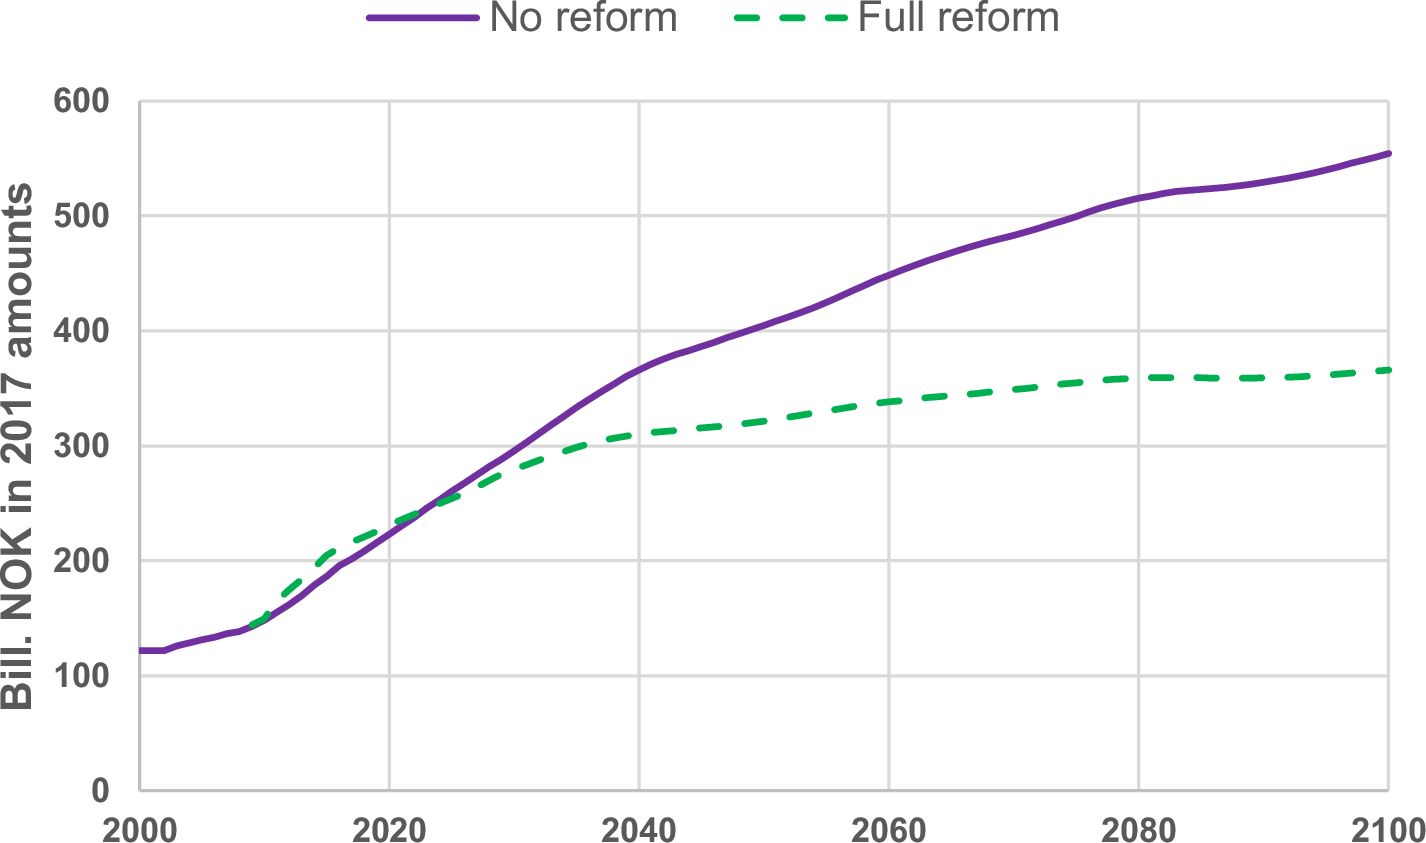
Projected old-age pension expenditures in the National Insurance Scheme. Bill. NOK measured in fixed 2017 wage amounts. Source: Statistics Norway.
Figure 7
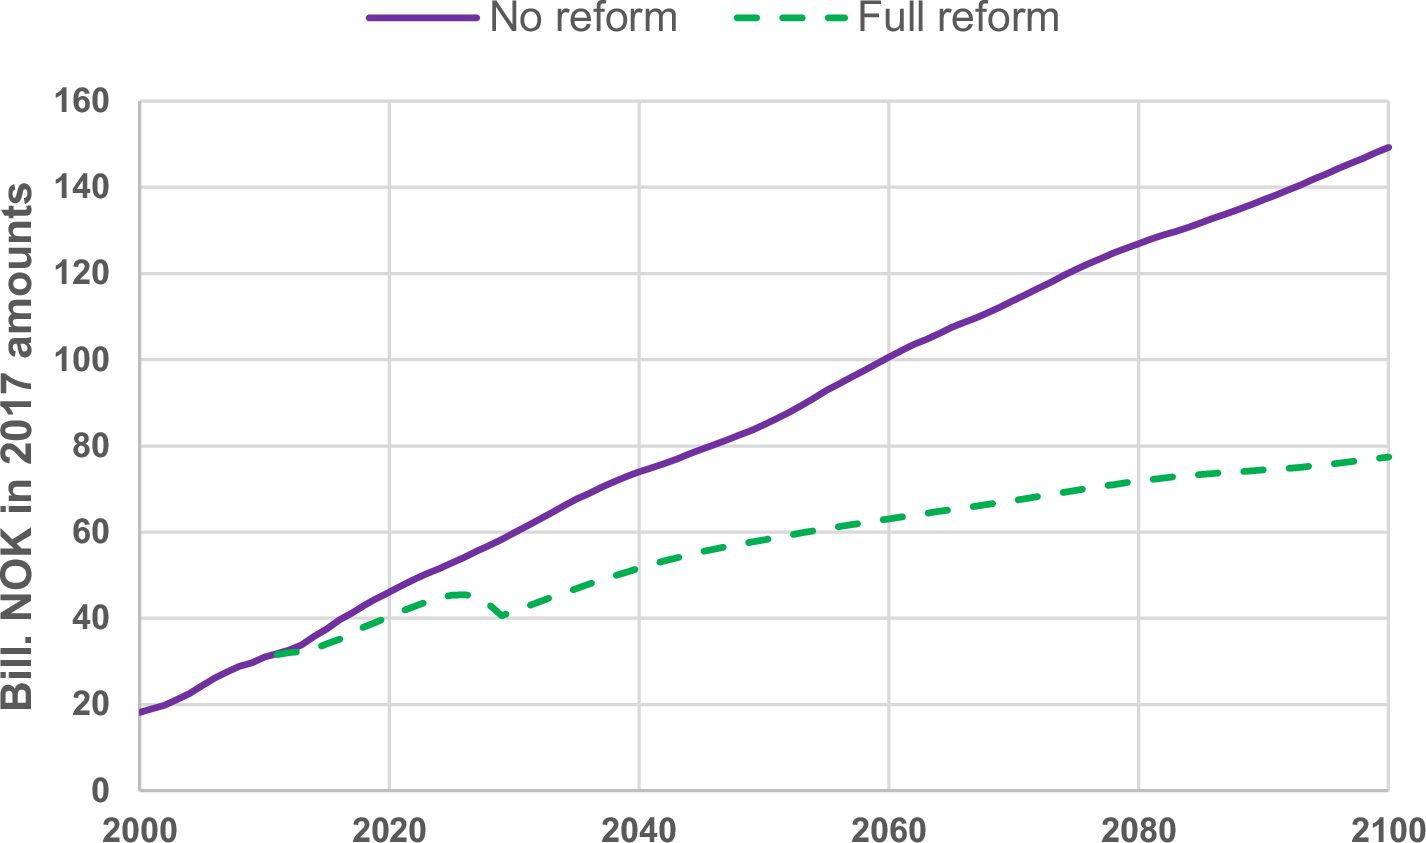

Projected old-age pension expenditures for occupational pensions in the public sector. Bill. NOK measured in fixed 2017 wage amounts. Source: Statistics Norway.
Figure 8
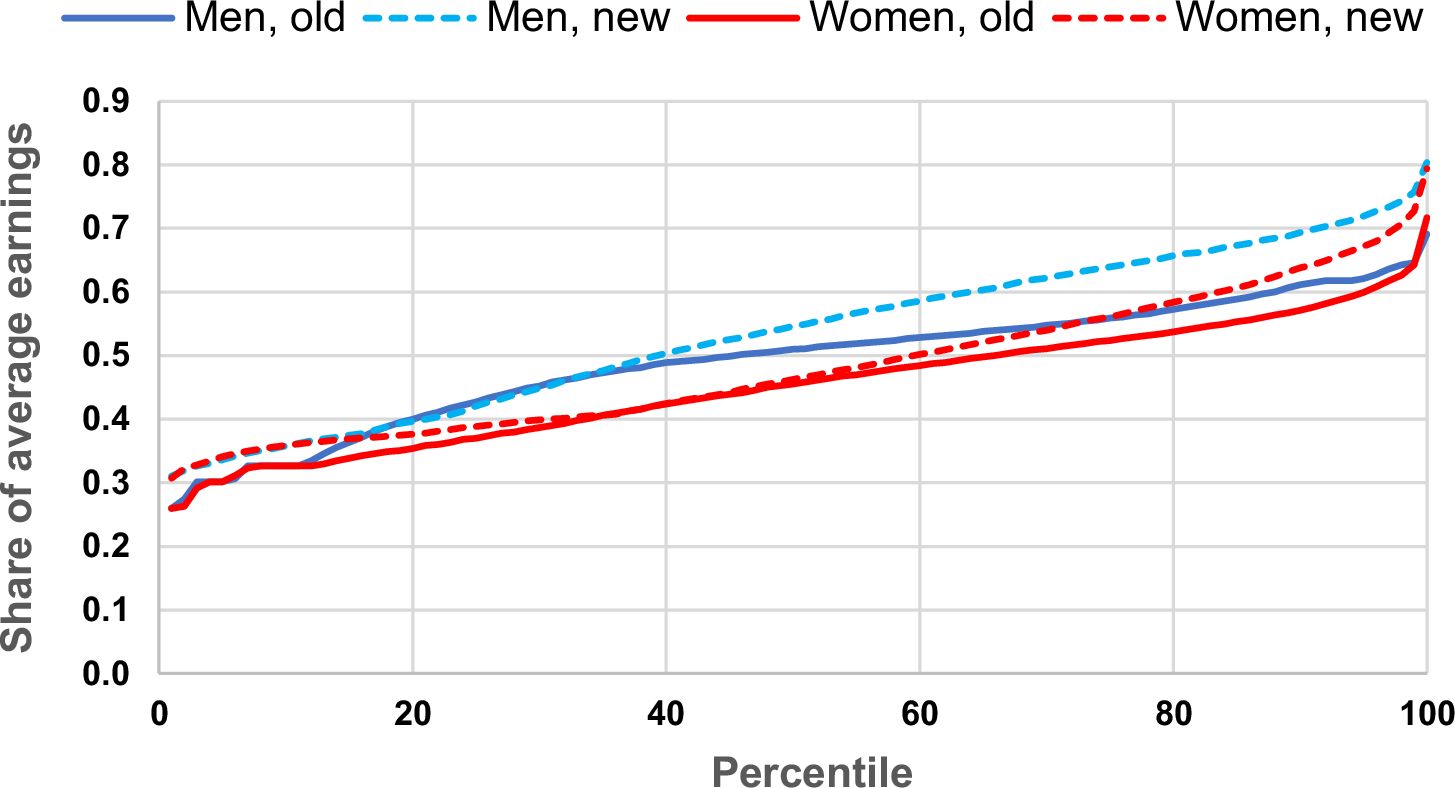

Estimated distribution of pension benefits in 2050 by income percentile and gender (share of average earnings). Source: Fredriksen and Stølen (2014). Note: Benefits are shown before indexation and exposure to the life expectancy adjustment divisor.
Figure 9
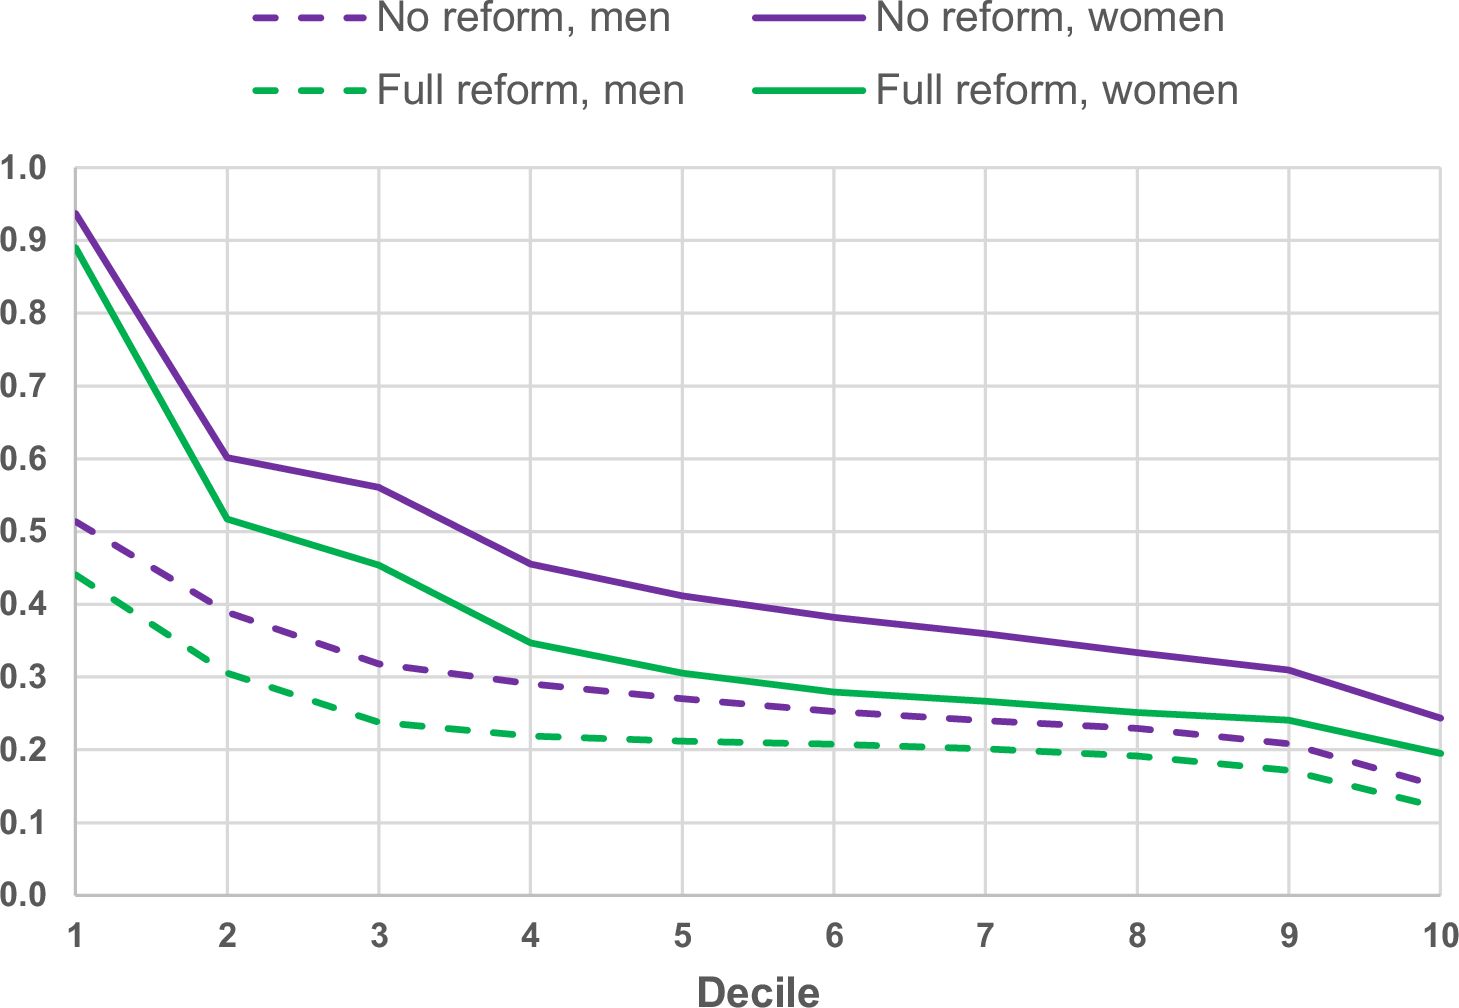

Total life-time benefits from old-age pensions in NIS relative to total life-time earnings for persons in the 1963-cohort by income decile and gender. Source: Statistics Norway.
Tables
Table 1
Total population by main age groups based on the main alternative from Statistics Norway’s population projections 2018. 1000 persons per January 1
| Total | 2018 | 2035 | 2060 |
|---|---|---|---|
| 5332 | 5938 | 6530 | |
| 0–19 years | 1 258 | 1 277 | 1 344 |
| 20–66 years | 3269 | 3455 | 3600 |
| 67–79 years | 580 | 755 | 885 |
| 80+ years | 226 | 425 | 702 |
-
Source, Statistics Norway.
Table 2
Individual pension benefits. Average over the retirement phase
| Average amount at each step in NOK | Gender gap | Change compared to previous step in NOK | Change in gender gap | |||
|---|---|---|---|---|---|---|
| Men | Women | Men | Women | |||
| 0. Baseline | 268 164 | 154 176 | 43 % | – | – | – |
| 1. Gender neutral annuity divisor | 242 600 | 168 341 | 31 % | −25 564 | 14 166 | −12 % |
| 2. Social security ceiling | 206 926 | 158 741 | 23 % | −35 674 | −9 600 | −7 % |
| 3. Child credits | 209 087 | 174 748 | 16 % | 2 161 | 16 007 | −7 % |
| 4. Inherited benefits | 209 726 | 181 298 | 14 % | 639 | 6 549 | −3 % |
| 5. Guarantee pension undifferentiated | 214 718 | 191 563 | 11 % | 4 992 | 10 265 | −3 % |
| 6. Guarantee pension with higher benefits for singles | 215 891 | 193 815 | 10 % | 1 173 | 2 252 | −1 % |
| 7. Income taxes | 189 320 | 175 459 | 7 % | −26 571 | −18 356 | −3 % |
-
Source, Halvorsen and Pedersen (2019).
Data and code availability
Data used for the model may be avaiable for scientific research only by application if certain conditions are fulfilled. The entire intial population will not be available both because of General Data Protection Rules (GDPR) and because it is proprietary to Statistics Norway.
The code for the model is proprietary to Statistics Norway with executeable available on request addressed to Dennis Fredriksen.
Download links
A two-part list of links to download the article, or parts of the article, in various formats.