Calibration of Vehicle and Driver Characteristics in VISSIM and ANN-based Sensitivity Analysis
- National Institute of Technology Karnataka, India
Figures

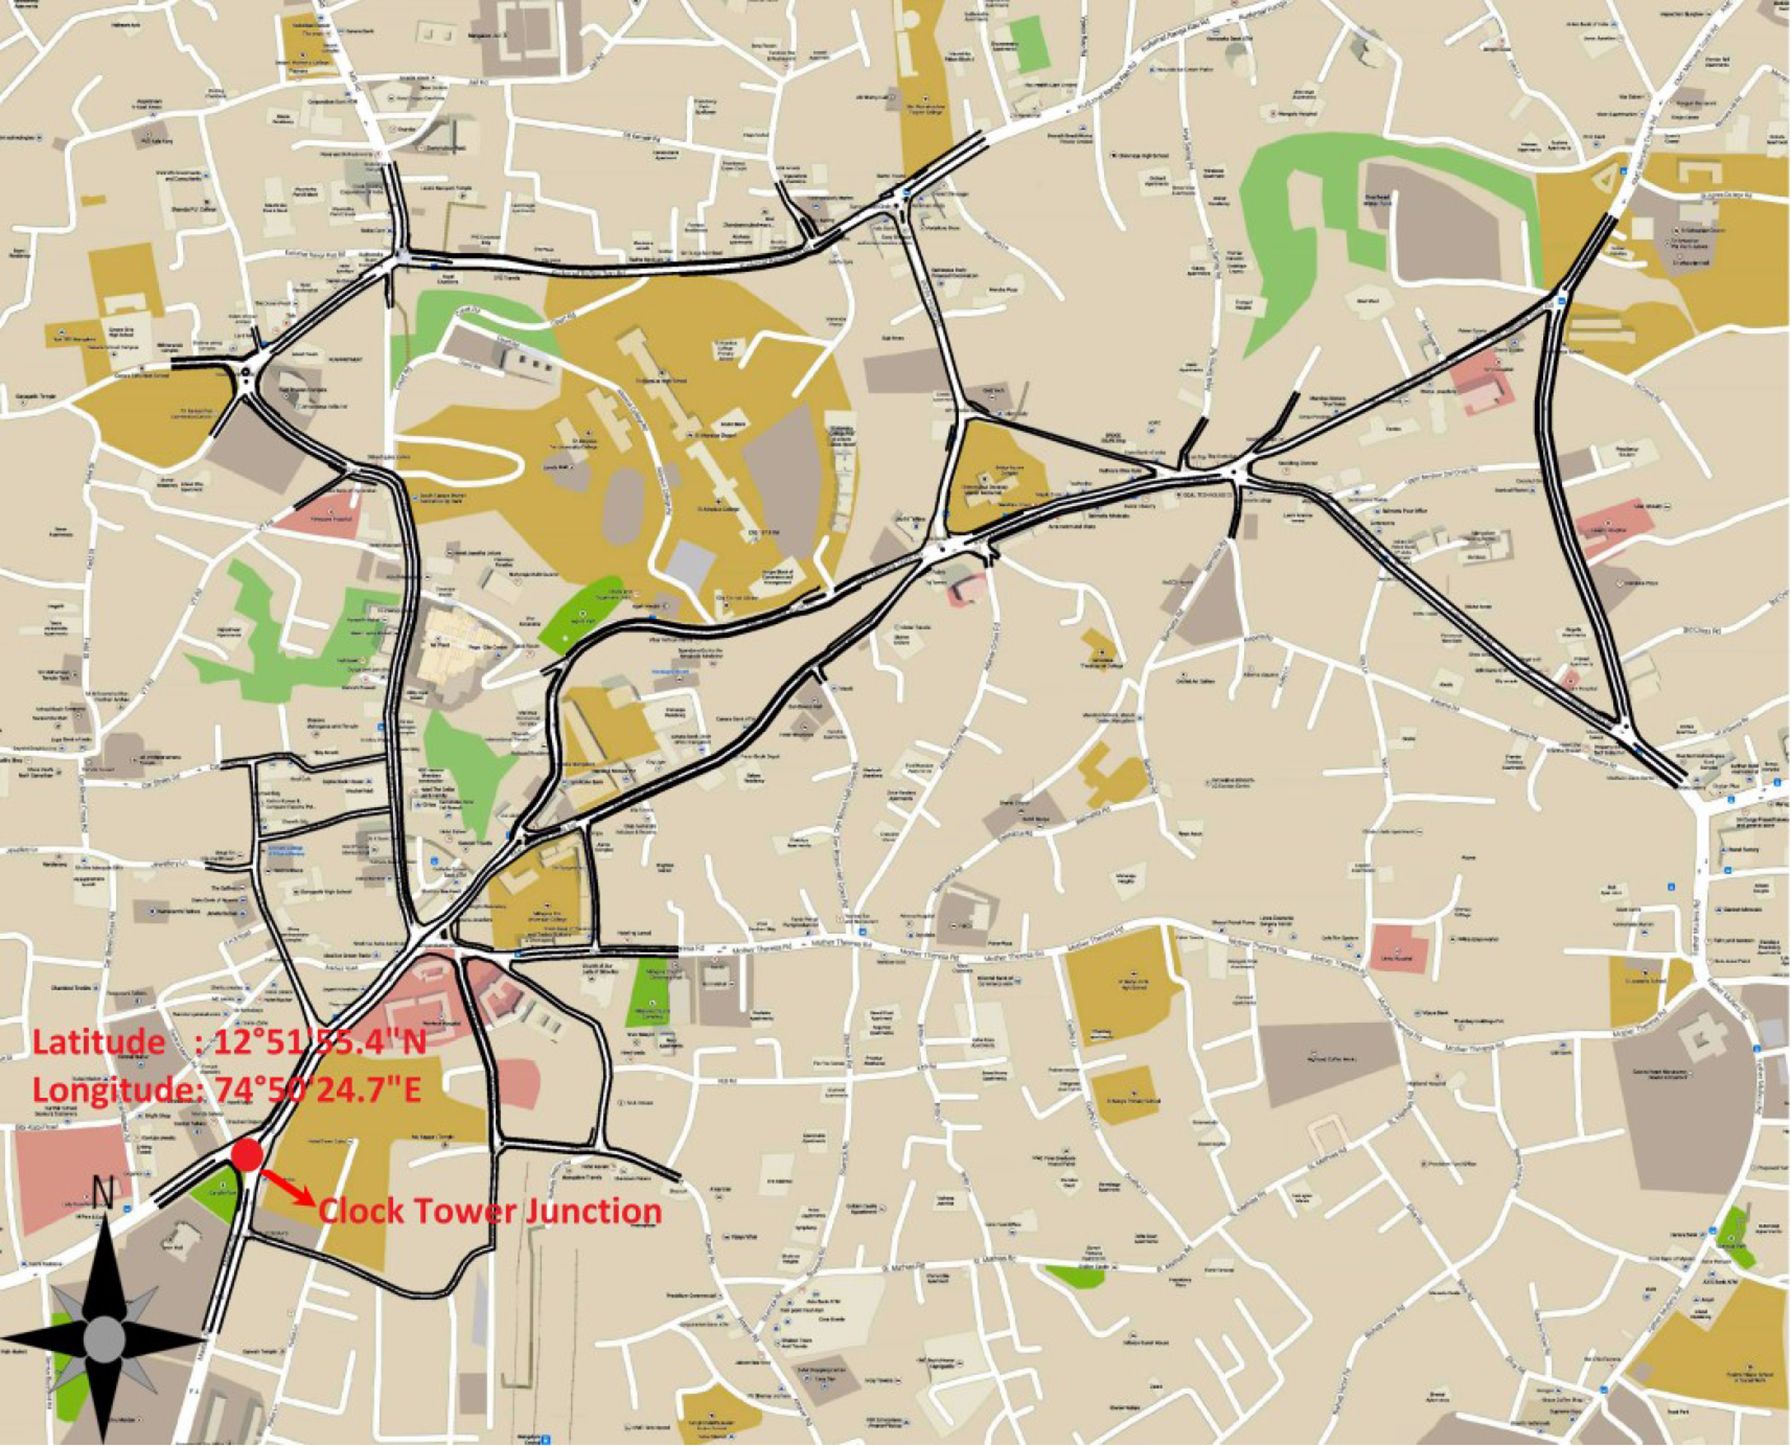
AutoCAD Drawing Interfaced with High-Resolution Map of Mangalore City.
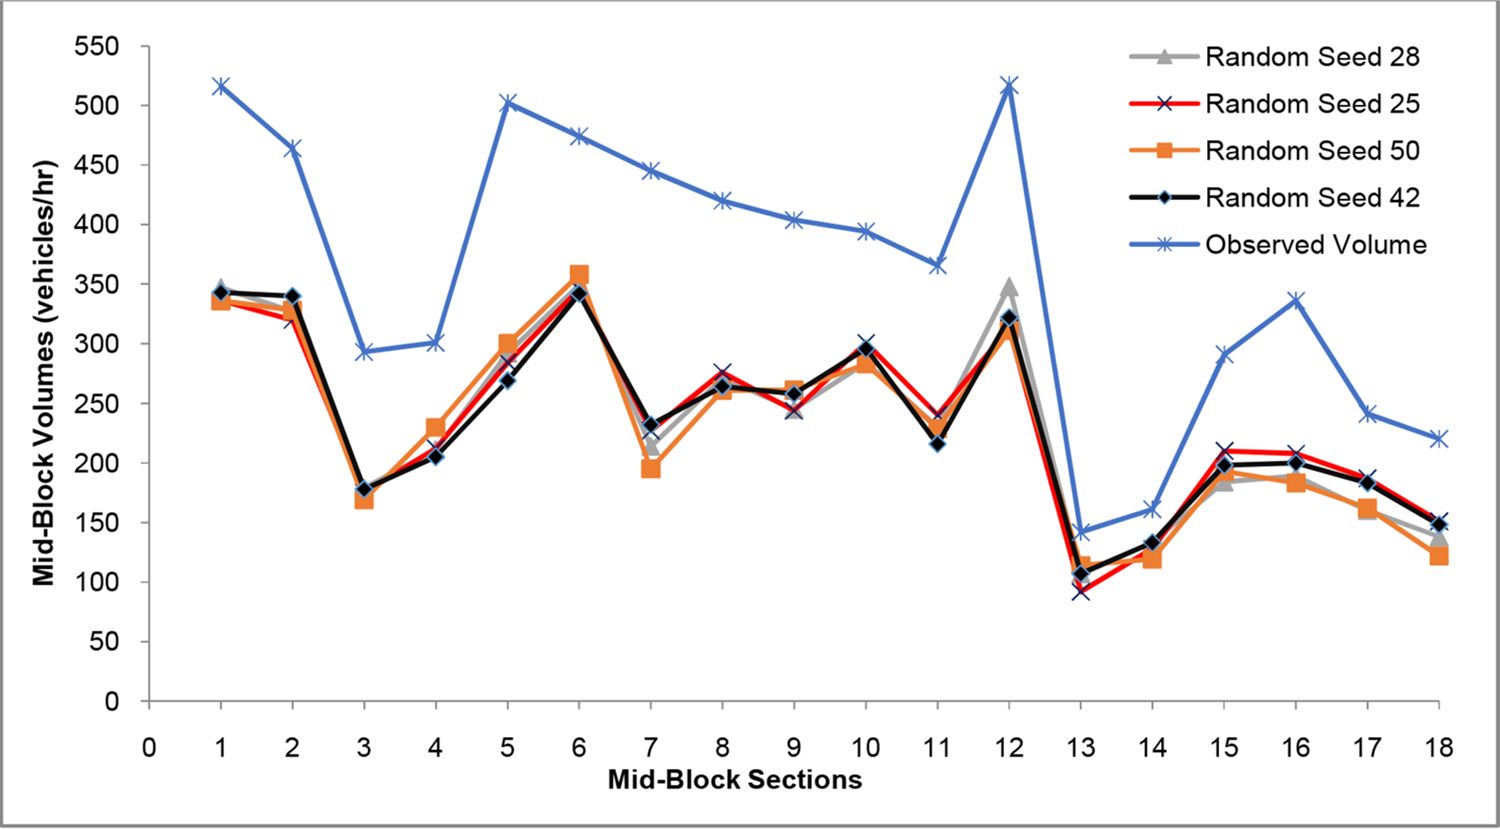
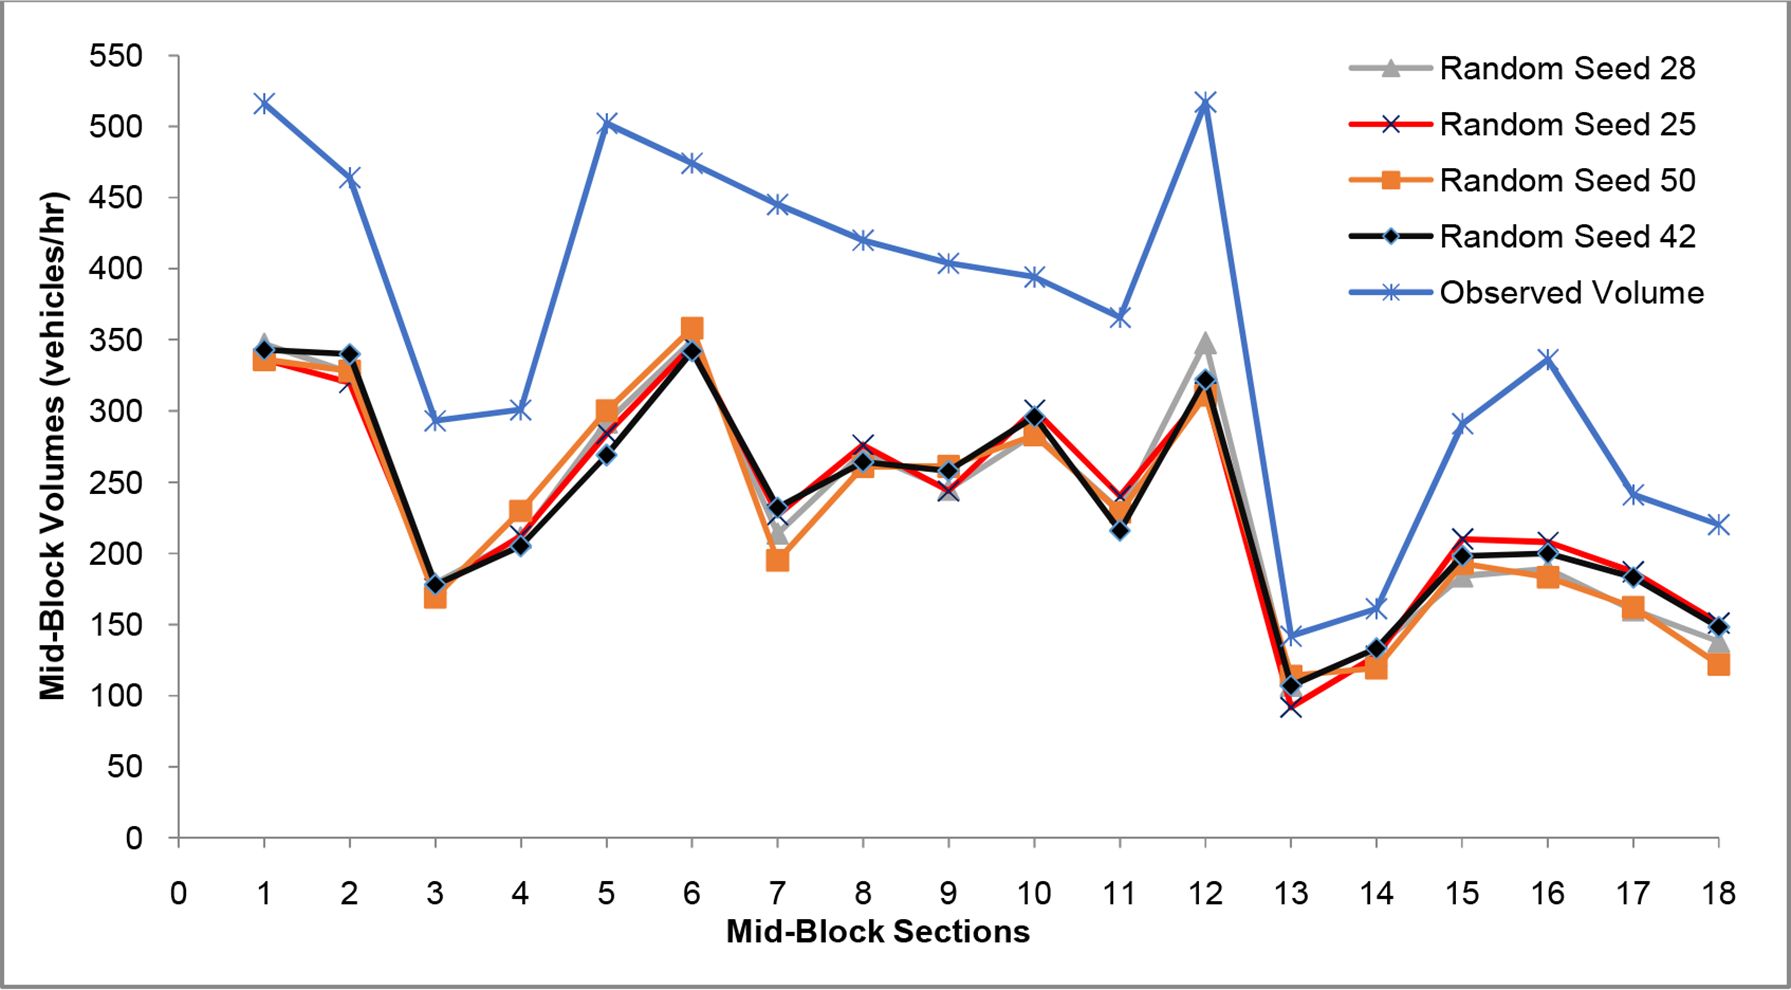
A Pictorial Representation of Observed and Predicted Volumes at 18 mid-block Sections Using Random Seeds 25, 28, 42, and 50.

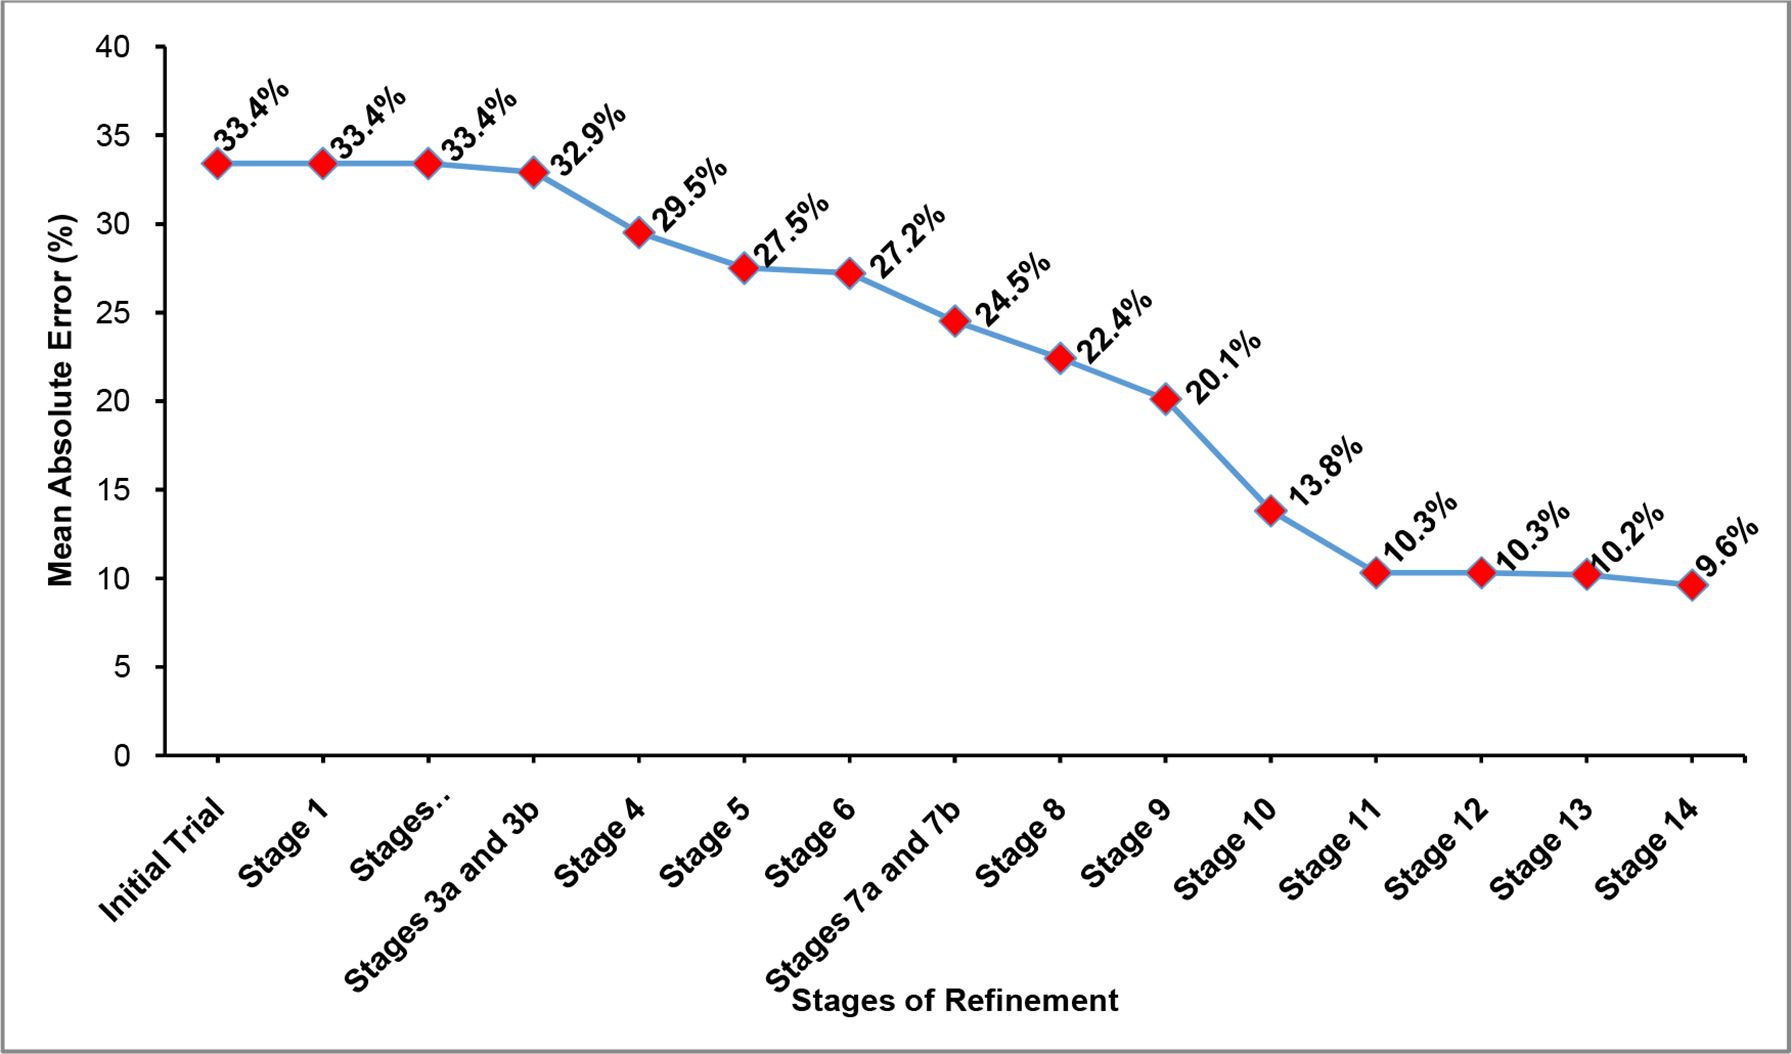
A Pictorial Representation of the Reduction in MAEs for Various Stages of Calibration Using Random Seed 42.
Tables
Suggested Lower and Upper Bound Values for Vehicle and Driver Characteristics Used in Performing Simulation Trials in VISSIM.
| Sl. No. | Vehicle and Driver Characteristics | Operating Value Range | Best performing simulation runs |
|---|---|---|---|
| 1 | Minimum Lateral Clearance (m) | 0.25 - 1.0 | 5 |
| 2a | Distributions for Desired Acceleration (m/s2) | 0.5 - 4.4 | 5 |
| 2b | Distributions for Maximum Acceleration (m/s2) | 1.0 - 4.4 | 5 |
| 2c | Distributions for Deceleration (m/s2) | 2.5 - 8.0 | 5 |
| 3a | Distributions for Desired Acceleration (m/s2) | 0.5 - 4.4 | 5 |
| 3b | Distributions for Maximum Acceleration (m/s2) | 1.0 - 4.4 | 5 |
| 4 | Minimum Look-ahead Distance (m) | 10 - 50 | 5 |
| 5 | Distributions for Maximum Acceleration (m/s2) | 1.0 - 4.4 | 5 |
| 6 | Distributions for Desired Acceleration (m/s2) | 0.5 - 4.4 | 5 |
| 7a | Distributions for Desired Speed (kmph) - Lower Bound | 21.9 - 72.3 | 5 |
| 7b | Distributions for Desired Speed (kmph) - Upper Bound | 21.9 - 72.3 | 5 |
| 8 | Minimum Look-back Distance (m) for car-following | 10.0 - 50.0 | 5 |
| 9 | Average Standstill Distance (m) for car-following | 0.5 - 2.5 | 5 |
| 10 | Additive Part of Desired Safety Distance (m) for car-following | 0.2 - 2.0 | 5 |
| 11 | Multiplicative Part of Desired Safety Distance (m) for car-following | 0.2 - 3.0 | 5 |
| 12 | Time-between Direction Changes (s) for overtaking | 1.0 - 10.0 | 5 |
| 13 | Minimum Longitudinal Speed (kmph) for lane change | 1.1 - 3.6 | 5 |
| 14 | Minimum Collision Time-gain for lateral driving behavior (s) | 0.40 - 2.0 | 5 |
| Total simulation runs in the first-level calibrations | 90 |
-
Source: Authors own creation.
A Partial Listing of the Normalized Database Used for Training the ANN Model.
| Details on Data Set for Sensitivity Analysis for Vehicle and Driver Characteristics | |||||||||||||||
|---|---|---|---|---|---|---|---|---|---|---|---|---|---|---|---|
| First-level of Calibration Stage Sl. No. | Minimum Lateral Clearances (m) | Desired Accelerations at Desired Speed of 50 kmph (m/s2) | Maximum Accelerations at Desired Speed of 50 kmph (m/s2) | Deceleration Distribution (m/s2) | Weighted Average of Speed Distribution Lower-Bounds (kmph) | Weighted Average of Speed Distribution Upper-Bounds (kmph) | Minimum Look-ahead Distances (m) | Minimum Look-back Distances (m) | Average Standstill Distances (m) | Additive Part of Desired Safety Distances (m) | Multiplicative Part of Desired Safety Distances (m) | Time-Between Direction Changes (s) | Minimum Longitudinal Speeds (kmph) | Minimum Collision Time-gains (s) | Mean Absolute Errors (%) |
| (1) | (2) | (3) | (4) | (5) | (6) | (7) | (8) | (9) | (10) | (11) | (12) | (13) | (14) | (15) | (16) |
| Ini--tial | 1.00 | 0.432 | 0.432 | 0.335 | 0.96 | 0.69 | 0.20 | 0.20 | 0.80 | 1.00 | 1.00 | 0.10 | 1.00 | 1.00 | 0.9653 |
| 1 | 0.50 | 0.432 | 0.432 | 0.335 | 0.96 | 0.69 | 0.20 | 0.20 | 0.80 | 1.00 | 1.00 | 0.10 | 1.00 | 1.00 | 0.9653 |
| 0.25 | 0.432 | 0.432 | 0.335 | 0.96 | 0.69 | 0.20 | 0.20 | 0.80 | 1.00 | 1.00 | 0.10 | 1.00 | 1.00 | 0.9653 | |
| 0.75 | 0.432 | 0.432 | 0.335 | 0.96 | 0.69 | 0.20 | 0.20 | 0.80 | 1.00 | 1.00 | 0.10 | 1.00 | 1.00 | 0.9653 | |
| 0.65 | 0.432 | 0.432 | 0.335 | 0.96 | 0.69 | 0.20 | 0.20 | 0.80 | 1.00 | 1.00 | 0.10 | 1.00 | 1.00 | 0.9653 | |
| 0.85 | 0.432 | 0.432 | 0.335 | 0.96 | 0.69 | 0.20 | 0.20 | 0.80 | 1.00 | 1.00 | 0.10 | 1.00 | 1.00 | 0.9653 | |
| 2a | 0.50 | 0.159 | 0.432 | 0.335 | 0.96 | 0.69 | 0.20 | 0.20 | 0.80 | 1.00 | 1.00 | 0.10 | 1.00 | 1.00 | 0.9653 |
| 0.50 | 0.295 | 0.432 | 0.335 | 0.96 | 0.69 | 0.20 | 0.20 | 0.80 | 1.00 | 1.00 | 0.10 | 1.00 | 1.00 | 0.9653 | |
| 0.50 | 0.409 | 0.432 | 0.335 | 0.96 | 0.69 | 0.20 | 0.20 | 0.80 | 1.00 | 1.00 | 0.10 | 1.00 | 1.00 | 0.9653 | |
| 0.50 | 0.455 | 0.432 | 0.335 | 0.96 | 0.69 | 0.20 | 0.20 | 0.80 | 1.00 | 1.00 | 0.10 | 1.00 | 1.00 | 0.9653 | |
| 0.50 | 0.114 | 0.432 | 0.335 | 0.96 | 0.69 | 0.20 | 0.20 | 0.80 | 1.00 | 1.00 | 0.10 | 1.00 | 1.00 | 0.9653 | |
| 2b | 0.50 | 0.159 | 0.295 | 0.335 | 0.96 | 0.69 | 0.20 | 0.20 | 0.80 | 1.00 | 1.00 | 0.10 | 1.00 | 1.00 | 0.9653 |
| 0.50 | 0.159 | 0.568 | 0.335 | 0.96 | 0.69 | 0.20 | 0.20 | 0.80 | 1.00 | 1.00 | 0.10 | 1.00 | 1.00 | 0.9653 | |
| 0.50 | 0.159 | 0.705 | 0.335 | 0.96 | 0.69 | 0.20 | 0.20 | 0.80 | 1.00 | 1.00 | 0.10 | 1.00 | 1.00 | 0.9653 | |
| 0.50 | 0.159 | 0.705 | 0.335 | 0.96 | 0.69 | 0.20 | 0.20 | 0.80 | 1.00 | 1.00 | 0.10 | 1.00 | 1.00 | 0.9653 | |
| 0.50 | 0.159 | 0.250 | 0.335 | 0.96 | 0.69 | 0.20 | 0.20 | 0.80 | 1.00 | 1.00 | 0.10 | 1.00 | 1.00 | 0.9653 | |
| 2c | 0.50 | 0.159 | 0.295 | 0.334 | 0.96 | 0.69 | 0.20 | 0.20 | 0.80 | 1.00 | 1.00 | 0.10 | 1.00 | 1.00 | 0.9653 |
| 0.50 | 0.159 | 0.295 | 0.675 | 0.96 | 0.69 | 0.20 | 0.20 | 0.80 | 1.00 | 1.00 | 0.10 | 1.00 | 1.00 | 0.9653 | |
| 0.50 | 0.159 | 0.295 | 0.738 | 0.96 | 0.69 | 0.20 | 0.20 | 0.80 | 1.00 | 1.00 | 0.10 | 1.00 | 1.00 | 0.9653 | |
| 0.50 | 0.159 | 0.295 | 1.000 | 0.96 | 0.69 | 0.20 | 0.20 | 0.80 | 1.00 | 1.00 | 0.10 | 1.00 | 1.00 | 0.9653 | |
| 0.50 | 0.159 | 0.295 | 0.313 | 0.96 | 0.69 | 0.20 | 0.20 | 0.80 | 1.00 | 1.00 | 0.10 | 1.00 | 1.00 | 0.9653 | |
| - | - | - | - | - | - | - | - | - | - | - | - | - | - | - | - |
| 13 | 0.50 | 0.341 | 0.341 | 0.334 | 0.61 | 0.86 | 0.80 | 0.60 | 0.40 | 0.20 | 0.17 | 0.50 | 0.53 | 1.00 | 0.2948 |
| 0.50 | 0.341 | 0.341 | 0.334 | 0.61 | 0.86 | 0.80 | 0.60 | 0.40 | 0.20 | 0.17 | 0.50 | 0.83 | 1.00 | 0.3295 | |
| 0.50 | 0.341 | 0.341 | 0.334 | 0.61 | 0.86 | 0.80 | 0.60 | 0.40 | 0.20 | 0.17 | 0.50 | 0.67 | 1.00 | 0.3295 | |
| 0.50 | 0.341 | 0.341 | 0.334 | 0.61 | 0.86 | 0.80 | 0.60 | 0.40 | 0.20 | 0.17 | 0.50 | 0.42 | 1.00 | 0.3035 | |
| 0.50 | 0.341 | 0.341 | 0.334 | 0.61 | 0.86 | 0.80 | 0.60 | 0.40 | 0.20 | 0.17 | 0.50 | 0.31 | 1.00 | 0.3064 | |
| 14 | 0.50 | 0.341 | 0.341 | 0.334 | 0.61 | 0.86 | 0.80 | 0.60 | 0.40 | 0.20 | 0.17 | 0.50 | 0.53 | 0.29 | 0.2775 |
| 0.50 | 0.341 | 0.341 | 0.334 | 0.61 | 0.86 | 0.80 | 0.60 | 0.40 | 0.20 | 0.17 | 0.50 | 0.53 | 0.20 | 0.2948 | |
| 0.50 | 0.341 | 0.341 | 0.334 | 0.61 | 0.86 | 0.80 | 0.60 | 0.40 | 0.20 | 0.17 | 0.50 | 0.53 | 0.40 | 0.3006 | |
| 0.50 | 0.341 | 0.341 | 0.334 | 0.61 | 0.86 | 0.80 | 0.60 | 0.40 | 0.20 | 0.17 | 0.50 | 0.53 | 0.75 | 0.3266 | |
| 0.50 | 0.341 | 0.341 | 0.334 | 0.61 | 0.86 | 0.80 | 0.60 | 0.40 | 0.20 | 0.17 | 0.50 | 0.53 | 0.55 | 0.2861 | |
-
Source: Authors own creation.
Details on Tests for Identifying the Ideal ANN Configuration.
| Test Serial No. | Number of Neurons in the Hidden Layers | Mean Absolute Error (MAE) in Prediction(%) | Number of training cycles for convergence | ||
|---|---|---|---|---|---|
| HiddenLayerNo: 1 | HiddenLayerNo: 2 | HiddenLayerNo: 3 | |||
| 1 | 15 | 0 | 0 | 3.8075 | 10751 |
| 2 | 14 | 0 | 0 | 3.7303 | 11407 |
| 3 | 13 | 0 | 0 | 3.9456 | 10276 |
| *4 | 12 | 0 | 0 | 3.0979 | 11184 |
| 5 | 11 | 0 | 0 | 3.7925 | 11265 |
| 6 | 10 | 0 | 0 | 3.4415 | 10138 |
| 7 | 9 | 0 | 0 | 3.2023 | 11312 |
| 8 | 8 | 0 | 0 | 3.7263 | 10015 |
| 9 | 7 | 0 | 0 | 3.4304 | 10864 |
| 10 | 6 | 0 | 0 | 3.7916 | 10319 |
| 11 | 5 | 0 | 0 | 3.7277 | 9677 |
| 12 | 4 | 0 | 0 | 3.7169 | 6234 |
| 13 | 12 | 12 | 0 | 3.6959 | 5407 |
| 14 | 12 | 11 | 0 | 3.4819 | 4803 |
| 15 | 12 | 10 | 0 | 3.8747 | 3468 |
| 16 | 12 | 9 | 0 | 3.8354 | 6072 |
| *17 | 12 | 8 | 0 | 3.4290 | 4021 |
| 18 | 12 | 7 | 0 | 3.4600 | 3548 |
| 19 | 12 | 6 | 0 | 3.6131 | 2984 |
| 20 | 12 | 5 | 0 | 4.3240 | 1353 |
| 21 | 12 | 4 | 0 | 3.9310 | 4506 |
| 22 | 12 | 3 | 0 | 5.4365 | 1231 |
| 23 | 12 | 2 | 0 | 5.3433 | 4619 |
| 24 | 12 | 8 | 8 | 3.5013 | 6229 |
| 25 | 12 | 8 | 7 | 3.0347 | 7672 |
| 26 | 12 | 8 | 6 | 3.5135 | 9181 |
| 27 | 12 | 8 | 5 | 4.2408 | 2670 |
| *28 | 12 | 8 | 4 | 2.9404 | 5261 |
| 29 | 12 | 8 | 3 | 4.0352 | 2314 |
| 30 | 12 | 8 | 2 | 3.0703 | 16403 |
| 31 | 12 | 8 | 1 | 4.4979 | 3347 |
-
Source: Authors own creation.
-
Note: *Optimum ANN configurations for neurons organized in 1, 2, or 3 hidden layers. Target error = 0.1; Learning rate = 0.7; Momentum rate = 0.8; Number of neurons in the input layer = 14; Number of neurons in the output layer = 1.
Details of MAE, GEH, and RNSE at 18 Mid-Block Sections after Stage 14 of First-Level of Calibrations.
| Direction of Traffic Flow | Simulated volume | Observed volume | Absolute Error (%) | GEH Statistic | RNSE Statistic | |
|---|---|---|---|---|---|---|
| From | To | |||||
| Jyothi | Hampankatta | 465 | 516 | 9.9 | 2.30 | 2.25 |
| Hampankatta | Jyothi | 431 | 464 | 7.1 | 1.56 | 1.53 |
| PVS | Bunts | 282 | 293 | 3.8 | 0.65 | 0.64 |
| Bunts | PVS | 239 | 301 | 20.6 | 3.77 | 3.57 |
| Navabharat | PVS | 441 | 502 | 12.2 | 2.81 | 2.72 |
| PVS | Navabharat | 464 | 474 | 2.1 | 0.46 | 0.46 |
| Hampankatta | Navabharat | 382 | 445 | 14.2 | 3.10 | 2.99 |
| Navabharat | Hampankatta | 357 | 420 | 15.0 | 3.20 | 3.07 |
| Jyothi | Bunts | 343 | 404 | 15.1 | 3.16 | 3.03 |
| Bunts | Jyothi | 378 | 394 | 4.1 | 0.81 | 0.81 |
| Jyothi | Balmatta | 315 | 366 | 13.9 | 2.76 | 2.67 |
| Balmatta | Jyothi | 476 | 517 | 7.9 | 1.84 | 1.80 |
| Balmatta | St. Theresa | 132 | 142 | 7.0 | 0.85 | 0.84 |
| St. Theresa | Balmatta | 174 | 161 | 8.1 | 1.00 | 1.02 |
| Bendoorwell | Balmatta | 270 | 291 | 7.2 | 1.25 | 1.23 |
| Balmatta | Bendoorwell | 275 | 336 | 18.2 | 3.49 | 3.33 |
| Bendoorwell | St. Theresa | 241 | 241 | 0.0 | 0.00 | 0.00 |
| St. Theresa | Bendoorwell | 205 | 220 | 6.8 | 1.03 | 1.01 |
| MAE | 9.6 | 1.89 | 1.83 | |||
-
Source: Authors own creation.
Summary of the MAE and the GEH at each Stage of Refinement in the First-Level of Calibrations.
| Stages of Refinement | Mean Absolute Errors at the end of the stages (%) | Mean GEH Statistic |
|---|---|---|
| Initial trial (default value) | 33.4 | 7.06 |
| Stage 1 | 33.4 | 7.06 |
| Stages 2a, 2b, and 2c | 33.4 | 7.06 |
| Stages 3a and 3b | 32.9 | 6.94 |
| Stage 4 | 29.5 | 6.14 |
| Stage 5 | 27.5 | 5.82 |
| Stage 6 | 27.2 | 5.63 |
| Stages 7a and 7b | 24.5 | 5.12 |
| Stage 8 | 22.4 | 4.65 |
| Stage 9 | 20.1 | 4.08 |
| Stage 10 | 13.8 | 2.74 |
| Stage 11 | 10.3 | 2.05 |
| Stage 12 | 10.3 | 2.01 |
| Stage 13 | 10.2 | 1.97 |
| Stage 14 | 9.6 | 1.89 |
-
Source: Authors own creation.
Summary of Values of Vehicle and Driver Characteristics at the End of First and Second-Levels of Calibrations.
| Sl. No. | Vehicle and Driver Characteristics | Calibrated Value | |||||
|---|---|---|---|---|---|---|---|
| Car | MTW | Auto-rickshaw | LCV | Bus | Truck | ||
| Vehicle and Driver Characteristics at the End of First Level of Calibrations | |||||||
| 1 | Minimum Lateral Clearances (m) | 0.5 | 0.5 | 0.5 | 0.5 | 0.5 | 0.5 |
| 2 | Desired Accelerations at 50kmph (m/s2) | 1.7 | 1.6 | 0.5 | 0.7 | 0.5 | 0.4 |
| 3 | Maximum Accelerations at 50kmph (m/s2) | 1.8 | 1.7 | 0.6 | 0.8 | 0.7 | 0.7 |
| 4 | Deceleration Distributions (m/s2) | 2.8 | 2.8 | 2.4 | 2.1 | 2.2 | 1.8 |
| 5 | Desired Speed: Lower Bounds (kmph) | 35 | 30 | 30 | 38 | 37 | 30 |
| 6 | Desired Speed: Upper Bounds (kmph) | 70 | 60 | 55 | 68 | 65 | 60 |
| 7 | Minimum Look-ahead distances (m) | 40 | 40 | 40 | 40 | 40 | 40 |
| 8 | Minimum Look-back distances (m) | 30 | 30 | 30 | 30 | 30 | 30 |
| 9 | Average Stand Still Distances (m) | 1.0 | 1.0 | 1.0 | 1.0 | 1.0 | 1.0 |
| 10 | Additive Part of Desired Safety Distances (m) | 0.4 | 0.4 | 0.4 | 0.4 | 0.4 | 0.4 |
| 11 | Multiplicative Part of Desired Safety Distances (m) | 0.5 | 0.5 | 0.5 | 0.5 | 0.5 | 0.5 |
| 12 | Time-Between Direction Changes (s) | 5.0 | 5.0 | 5.0 | 5.0 | 5.0 | 5.0 |
| 13 | Minimum Longitudinal Speeds (kmph) | 1.9 | 1.9 | 1.9 | 1.9 | 1.9 | 1.9 |
| 14 | Minimum Collision Time-gains (s) | 0.57 | 0.57 | 0.57 | 0.57 | 0.57 | 0.57 |
| Vehicle and Driver Characteristics Revised at the End of Second Level of Calibrations | |||||||
| 1 | Average Stand Still Distance (m) | 0.4 | 0.4 | 0.4 | 0.4 | 0.4 | 0.4 |
| 2 | Minimum Look-ahead distance (m) | 25 | 20 | 20 | 25 | 30 | 30 |
| 3 | Desired Speed: Lower Bounds (kmph) | 35 | 30 | 30 | 30 | 37 | 30 |
-
Source: Authors own creation.
-
Notes. MTW = Motorized two- wheelers, LCV = Light commercial vehicles of gross weight lesser than 7.5 metric tonnes.
Computed Values of the Relative Importance of the Vehicle and Driver Characteristics Based on Sensitivity Analysis.
| Vehicle and Driver Characteristics | Final Computed Values of Relative Importance(%) |
|---|---|
| Average Standstill Distance (m) | 36.03346781 |
| Minimum Look-ahead Distance (m) | 29.08247098 |
| Desired Speed: Lower Bounds (kmph) | 10.01939929 |
| Additive Part of Desired Safety Distance (m) | 6.018405862 |
| Minimum Look-back Distance (m) | 5.82585454 |
| Desired Acceleration at Desired Speed of 50 kmph (m/s2) | 4.047062691 |
| Maximum Acceleration at Desired Speed of 50 kmph (m/s2) | 3.425829983 |
| Multiplicative Part of Desired Safety Distance (m) | 1.990901583 |
| Minimum Longitudinal Speed (kmph) | 1.139688108 |
| Minimum Collision Time-gain (s) | 1.118960391 |
| Desired Speed: Upper Bounds (kmph) | 0.641713873 |
| Minimum Lateral Clearance (m) | 0.307529776 |
| Time-Between Direction Change (s) | 0.276678493 |
| Deceleration Distribution (m/s2) | 0.072036627 |
-
Source: Authors own creation.
Details of MAE, GEH, and RNSE at 18 Mid-Block Sections for the Validated Model.
| Direction of Traffic Flow | Simulated Volume | Observed Volume | Absolute Error (%) | GEH Statistic | RNSE Statistic | |
|---|---|---|---|---|---|---|
| From | To | |||||
| Jyothi | Hampankatta | 155 | 153 | 1.3 | 0.16 | 0.16 |
| Hampankatta | Jyothi | 146 | 167 | 12.6 | 1.68 | 1.63 |
| PVS | Bunts | 85 | 95 | 10.5 | 1.05 | 1.03 |
| Bunts | PVS | 77 | 94 | 18.1 | 1.84 | 1.75 |
| Navabharat | PVS | 147 | 164 | 10.4 | 1.36 | 1.33 |
| PVS | Navabharat | 129 | 184 | 29.9 | 4.40 | 4.05 |
| Hampankatta | Navabharat | 135 | 154 | 12.3 | 1.58 | 1.53 |
| Navabharat | Hampankatta | 117 | 105 | 11.4 | 1.14 | 1.17 |
| Jyothi | Bunts | 122 | 157 | 22.3 | 2.96 | 2.79 |
| Bunts | Jyothi | 136 | 108 | 25.9 | 2.54 | 2.69 |
| Jyothi | Balmatta | 106 | 115 | 7.8 | 0.86 | 0.84 |
| Balmatta | Jyothi | 169 | 155 | 9.0 | 1.10 | 1.12 |
| Balmatta | St. Theresa | 46 | 52 | 11.5 | 0.86 | 0.83 |
| St. Theresa | Balmatta | 61 | 50 | 22.0 | 1.48 | 1.56 |
| Bendoorwell | Balmatta | 99 | 91 | 8.8 | 0.82 | 0.84 |
| Balmatta | Bendoorwell | 96 | 110 | 12.7 | 1.38 | 1.33 |
| Bendoorwell | St. Theresa | 95 | 87 | 9.2 | 0.84 | 0.86 |
| St. Theresa | Bendoorwell | 70 | 79 | 11.4 | 1.04 | 1.01 |
| MAE | 13.7 | 1.51 | 1.47 | |||
-
Source: Authors own creation.
Calibrated Values for Characteristics later Refined at the End of the Second-Level of Calibrations, along with Comparisons to Related Studies in India, and Suggested Value Ranges for Simulation Trials.
| Vehicle and Driver Characteristics | Suggested Values Ranges for Simulation | Calibrated Values after Second Level of Calibrations | ||||
|---|---|---|---|---|---|---|
| Siddharth and Ramadurai (2013)* | Mathew and Radhakrishnan (2010)† | ThePresent Study‡ | Siddharth and Ramadurai (2013)* | Mathew and Radhakrishnan (2010)† | ThePresent Study‡ | |
| Minimum Look-ahead Distances (m) | 10 - 30 | - | 10 - 50 | 27.91 | - | 20§, 25§, 30§ |
| Minimum Look-back Distances (m) | 10 - 30 | - | 10 - 50 | 14.31 | - | 30 |
| Average Standstill Distances (m) | 1.0 - 2.0 | 0.0 - 4.0 | 0.5 - 2.5 | 1.0 | 1.33 | 0.4 |
| Additive Part of Safety Distances (m) | 0.1 - 2.0 | 0.0 - 4.0 | 0.2 - 2.0 | 0.2 | 0.28 | 0.4 |
| Multiplicative Part of Safety Distances (m) | 0.0 - 3.0 | 0.0 - 5.0 | 0.2 - 3.0 | 0.78 | 0.16 | 0.5 |
-
Source: Authors own creation.
-
*
Based on studies performed in Chennai city, India.
-
†
Based on studies performed in Trivandrum city, India.
-
‡
Based on studies performed in Mangalore city, India.
-
§
Minimum look-ahead distance of 20m for motorized two-wheelers and auto-rickshaws, 25 for cars and LCVs, 30 for buses and trucks.
Data and code availability
All data created or used during this study appeared in the submitted article. Additional data supporting the findings of the study such as calibration and validation results are available from the corresponding author upon reasonable request.
The microsimulation exercise was performed using VISSIM software licenced to National Institute of Technology Karnataka, Surathkal.